

Let’s face it: most “Buy/Sell” arrow indicators found on forums are trash. They repaint, they lag, and they light up your chart like a Christmas tree right before the market crashes against you.
But the Stochastic Momentum with Arrows (SMA) is different.
If you are tired of the standard Stochastic Oscillator getting stuck in the overbought zone for days while you blow your account shorting a rally, this tool is your fix. Based on the Stochastic Momentum Index (SMI), it refines the classic math to filter noise and spot trend exhaustion earlier than almost any other oscillator.
This isn’t just a download page. This is a complete blueprint for using the SMA to catch “sniper” entries on M15 and H4 charts without getting trapped by fakeouts.
What is the Stochastic Momentum with Arrows?
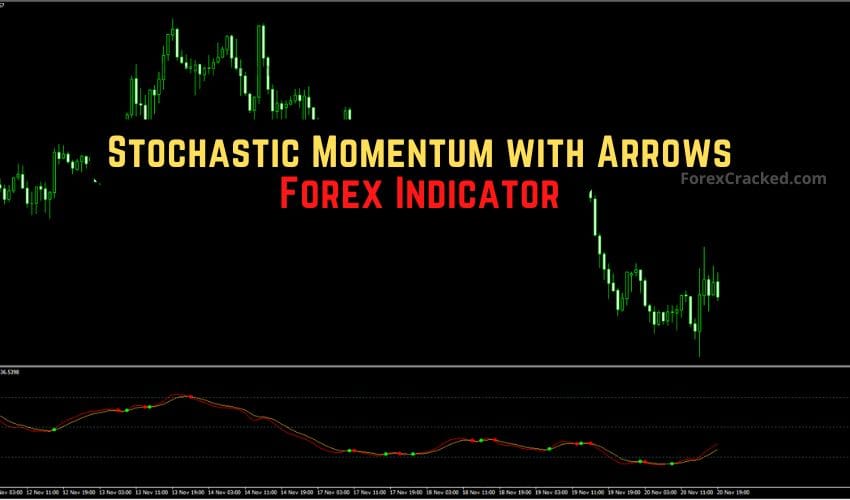
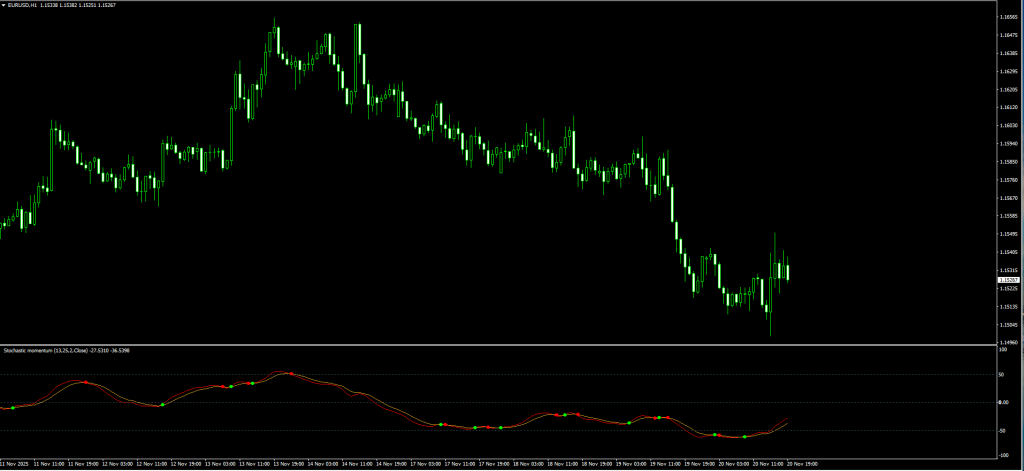
The Stochastic Momentum with Arrows is a custom technical indicator for MetaTrader 4 (MT4) that identifies Overbought and Oversold market conditions with visual precision.
Unlike the standard Stochastic, which compares the closing price to the entire High-Low range, the SMA measures the distance of the close from the High-Low range’s midpoint.
Why does this matter?
It makes the indicator significantly more sensitive to price pivots while reducing the “lag” associated with traditional moving averages.
Key Features:
- Visual Signals: Prints Lime (Buy) and Red (Sell) dots/arrows on the chart.
- Oscillator Window: Moves between +50 and -50 (centered around 0.00).
- Versatility: Works on all timeframes (M1, M5, M15, H1, H4, Daily).
- Alerts: Most versions include pop-up and email alerts (check the inputs).
Stochastic Momentum vs. Standard Stochastic: The Difference
Many traders ask, “Why should I download this if I already have Stochastic on MT4?”
Here is the breakdown:
| Feature | Standard Stochastic | Stochastic Momentum (SMI) |
| Math Logic | Close vs. Lowest Low | Close vs. Midpoint of Range |
| Sensitivity | Lower (Smoother) | Higher (Faster reactions) |
| False Signals | Fewer, but slower | More, but catches tops/bottoms |
| Best For | Trend Following | Reversal Trading / Scalping |
Verdict: If you are a scalper or a reversal trader, the Standard Stochastic is too slow. You need the Stochastic Momentum.
“Dr. Barry Burns breaks down exactly why the Stochastic Momentum Index (SMI) spots reversals faster than standard oscillators.”
Indicator Settings: Optimizing for Your Style
To get the best performance, you cannot always rely on the default settings. When you attach the indicator to your chart, you will see the “Inputs” tab. Here is how to tweak them:
- K_Period (Default: 14):
- What it does: The main time period for the calculation.
- Tweak: Increase to 20 or 24 to smooth out signals and reduce noise in volatile pairs like GBP/JPY. Decrease to 10 for hyper-scalping (risky).
- D_Period:
- What it does: The smoothing line.
- Tweak: Keep this standard.
- Arrow_Shift:
- What it does: Adjusts how far the arrow sits from the candle. Purely cosmetic.
Pro Tip: For Swing Trading (H4), set the K_Period to 24. For Scalping (M5/M15), leave it at 14 but use the filter strategy below.
The Strategy: How to Filter “Fakeouts” (The False Check)
Warning: If you unthinkingly follow every Red and Lime arrow, you will lose money. The market is full of noise.
To rank this strategy among the best, we apply a “False Check” Filter. We will use the 200 Exponential Moving Average (EMA) to identify the dominant trend. We only trade with the smart money.
Required Tools:
- Stochastic Momentum with Arrows (Download below).
- 200 EMA (Trend Filter).
- Price Action (Support/Resistance).
1. The “Sniper” Buy Setup (Long)
We are looking for the market to pull back (reload) during a strong uptrend. We do not catch falling knives.
- The Filter: Price must be strictly ABOVE the 200 EMA. This tells us the long-term trend is Bullish.
- The Setup: Wait for the price to pull back towards the EMA.
- The Signal: The Stochastic Momentum line drops below -40 (Oversold) and prints a LIME DOT/ARROW.
- The Trigger: Enter at the Close of the signal candle.
- Stop Loss: 5-10 pips below the recent swing low.
- Take Profit: Target the previous High or exit when a Red Dot appears.
2. The “Sniper” Sell Setup (Short)
We are looking to short a rally in a downtrend.
- The Filter: Price must be strictly BELOW the 200 EMA. This tells us the Bears are in control.
- The Setup: Wait for the price to rally up towards the EMA.
- The Signal: The Stochastic Momentum line rises above +40 (Overbought) and prints a RED DOT/ARROW.
- The Trigger: Enter at the Close of the signal candle.
- Stop Loss: 5-10 pips above the recent swing high.
- Take Profit: Target the previous Low or exit when a Lime Dot appears.


Download a Collection of Indicators, Courses, and EA for FREE
Advanced Tactics: Divergence Trading
If you are an experienced trader, you can ignore the 200 EMA only if you spot Divergence. This is the “Secret Weapon” of this indicator.
- Bullish Divergence: Price makes a Lower Low, but Stochastic Momentum makes a Higher Low (and prints a Lime arrow).
- Action: Strong Buy signal (Reversal imminent).
- Bearish Divergence: Price makes a Higher High, but Stochastic Momentum makes a Lower High (and prints a Red arrow).
- Action: Strong Sell signal.
Divergence trades often lead to the biggest moves of the week because you are entering exactly when momentum has died, but the crowd hasn’t realized it yet.
How to Install the Indicator on MT4
If you are new to custom indicators, follow these simple steps:
- Download the Stochastic_Momentum_Arrows.mq4 or .ex4 file from the link below.
- Open your MetaTrader 4 platform.
- Go to File > Open Data Folder.
- Navigate to MQL4 > Indicators.
- Paste the downloaded file into this folder.
- Restart MT4 or right-click the “Navigator” window and select “Refresh”.
- Drag the indicator onto your chart.
FAQ: Frequently Asked Questions
Does the Stochastic Momentum indicator repaint?
The u0022Arrowsu0022 generally appear at the close of the candle. Once the candle is closed and the arrow is confirmed, it should not disappear (non-repainting). However, never enter a trade while the candle is still moving (flickering signal).
What is the best timeframe for this indicator?
It works mathematically on all timeframes. However, M15 and H1 offer the best balance between signal frequency and reliability. M1 is too noisy; Weekly is too slow.
Can I use this for Binary Options?
Yes. Because it spots short-term momentum reversals, many Binary Options traders use the arrow as a trigger for a u0022Callu0022 or u0022Putu0022 on the next candle expiry.
Conclusion
The Stochastic Momentum with Arrows is a precision tool, but it is not a crystal ball. By combining its sensitive entry signals with the robust filtering of the 200 EMA, you turn a “lagging” indicator into a “leading” strategy.
Your Trading Plan for Tomorrow:
- Download the indicator.
- Apply the Buy/Sell rules above on a Demo Account.
- Wait for the price to touch the 200 EMA and look for the arrow.
Free Download Stochastic Momentum With Arrows Indicator
Read More Extreme Spike MTF Forex Indicator MT4
(Note: Always test new strategies on a demo account before risking real capital. Trading Forex involves significant risk.)