

Introduction: The “Wake Up” Call for Sleepy Markets
Most traders lose money because they try to trade when the market is asleep. They enter a trade, and the price just sits there, chopping sideways until it hits their Stop Loss.
The Volatility Ratio V2 Indicator for MetaTrader 4 is designed to solve this. It acts as a “Wake Up” call.
It uses the concept of True Range to measure the market’s heartbeat. It stays silent when the market is dead, but usually sends a signal the moment price explodes out of its average zone. If you are a breakout trader looking to catch the start of a massive move, this is your tool.
What is the Volatility Ratio V2?
The Volatility Ratio V2 is a technical indicator that identifies when the current market volatility has exceeded its historical average.
The Math Behind the Move
It uses a specific formula to compare “Today’s Energy” vs. “Yesterday’s Energy”:
- Formula:
Today’s True Range / True Range of N Days. - True Range: This calculates the real distance price traveled, including gaps (High minus Low, or High minus Yesterday’s Close).
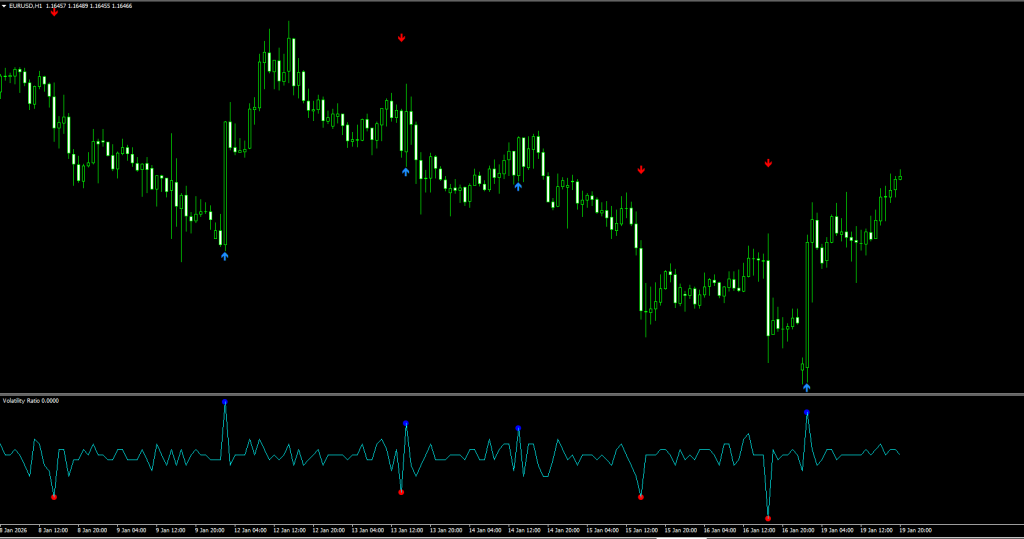
How to Read the Signals:
As seen in the image you will download, the indicator simplifies complex math into visual cues:
- Blue Arrow & Spot: Indicates a Bullish Volatility Breakout (Buy).
- Red Arrow & Spot: Indicates a Bearish Volatility Breakout (Sell).
- The 0.5 Threshold: The indicator triggers a signal when the ratio hits 0.5. In this specific tool, this level signifies that the current range has expanded significantly (often double the previous average), meaning the “explosion” has occurred.
Review: Pros and Cons
Is this breakout tool reliable? Here is our verdict.
✅ PROS (The Good)
- Objective Entries: You don’t have to guess if the candle is “big enough.” The arrow tells you instantly.
- Catches Big Trends: Since every major trend starts with a volatility breakout, this tool gets you in at the ground floor.
- Universal: Works on any asset (Forex, Crypto, Stocks) because “Volatility” is a universal language.
❌ CONS (The Bad)
- The “Whipsaw” Risk: In a choppy market, volatility can spike temporarily and then reverse. You must use the filter strategy below to avoid these “Fakeouts.”
- Lag: Because it relies on the candle closing to calculate the “True Range,” the signal appears after the move has already started.
The Strategy: The “Vol-Expansion” Breakout System
The sample post suggests entering blindly on every arrow. Do not do this.
Breakouts fail 70% of the time without confirmation. To fix this, we add a Trend Filter and a Volume Check.
Setup & Settings
- Volatility Ratio V2: Default Settings (Signal Level 0.5).
- 100 EMA (Exponential Moving Average): Applied to Close (Trend Filter).
- Volume Indicator: Standard MT4 Volumes.
- Timeframe: H1 or H4 (Avoids noise).
1. The “Power” Buy Setup
We are looking for an explosion UP in a rising market.
- The Filter: Price must be ABOVE the 100 EMA.
- The Trigger: Wait for the Volatility Ratio V2 to print a Blue Arrow (and Blue Spot).
- The “False Check” (Crucial): Look at the Volume bars.
- The volume bar for the signal candle must be higher than the previous 5 bars. This confirms “Smart Money” is fueling the move.
- Entry: Buy at the close of the signal candle.
- Stop Loss: Below the signal candle’s Low.
- Take Profit: Target a 1:2 Risk-Reward ratio, or exit when a Red Arrow appears.
2. The “Crash” Sell Setup
We are looking for an explosion DOWN in a falling market.
- The Filter: Price must be BELOW the 100 EMA.
- The Trigger: Wait for the Volatility Ratio V2 to print a Red Arrow (and Red Spot).
- The “False Check”: Check the Volume. It must be rising/higher than recent bars.
- Entry: Sell at the close of the signal candle.
- Stop Loss: Above the signal candle’s High.
- Take Profit: Target 1:2 Risk-Reward.
Pro Tip: If you see a Blue Arrow while price is below the 100 EMA, ignore it. That is likely a “Fakeout” retracement against the trend.


Download a Collection of Indicators, Courses, and EA for FREE
Indicator Settings: Customizing the Range
When you open the indicator inputs, you can tweak the sensitivity.
- Period (Default: 14 or 10): The number of days/candles used to calculate the “Average” range.
- Tweak: Increase to 20 to see fewer, more reliable signals. Decrease to 7 for scalping (more signals, more noise).
- Level (Default: 0.5): This is the breakout threshold.
- Tweak: If you want to catch only massive explosions, raise this to 0.6 or 0.7.
Understand the math behind the move: This video explains how ‘True Range’ works and why volatility is the best predictor of a new trend.
How to Install (MT4)
- Download the
.ex4file from the link below. - Open MetaTrader 4.
- Go to File > Open Data Folder > MQL4 > Indicators.
- Paste the file.
- Restart MT4 or Right-Click “Navigator” and hit Refresh.
- Drag the indicator onto your chart.
FAQ: Frequently Asked Questions
What is the best timeframe for Volatility Ratio?
H1 (1-Hour) and H4 (4-Hour) are ideal. Volatility on M1 or M5 is often just random noise (news spikes) rather than a true trend change.
Can I use this on Crypto?
Yes! Crypto is highly volatile. This indicator is excellent for catching Bitcoin or Ethereum breakouts after a weekend consolidation.
Why did the arrow disappear?
This indicator likely waits for the to confirm the “True Range.” Never enter a trade while the candle is still moving; always wait for the close to lock in the signal.
Final Verdict: Is it Worth Using?
Score: 4.5/5 Stars ⭐⭐⭐⭐🌗
The Volatility Ratio V2 is a “must-have” for breakout traders. It removes the subjectivity of drawing trendlines.
Instead of asking “Is this a breakout?”, the indicator uses cold, hard math to tell you: “Yes, the range has expanded.” Combine it with our Volume Rule, and you have a professional-grade system.