
In the ever-evolving world of forex trading, analytical tools play a pivotal role in aiding traders’ decision-making. The Forex Future Forecast Indicator is one such tool, designed to predict future price developments by examining past price behaviors. Drawing inspiration from Lorenz’s analogue method, a technique originally developed for atmospheric forecasting. This Forex Forecast Indicator offers an approach rooted in pattern recognition and historical comparison.
Understanding Indicator’s Forecasting Technique
At its core, the Forex Future Forecast Indicator proposes that market prices can be anticipated by locating historical price patterns that closely resemble recent movements. This concept relies heavily on correlation coefficients to measure the likeness between recent and past price sequences, a method commonly used in periodic time series forecasting.
Unlike some forecasting tools that limit themselves to identifying only similarly behaving patterns, this indicator allows for the analysis of both similar and dissimilar historical price movements. This dual approach is intended to offer a broader range of market insights. The inclusion of dissimilar periods may help traders identify potential reversals or deviations from established market behavior, though it can also introduce additional complexity in interpreting the forecasts.
How Does Forex Forecast Indicator Work?
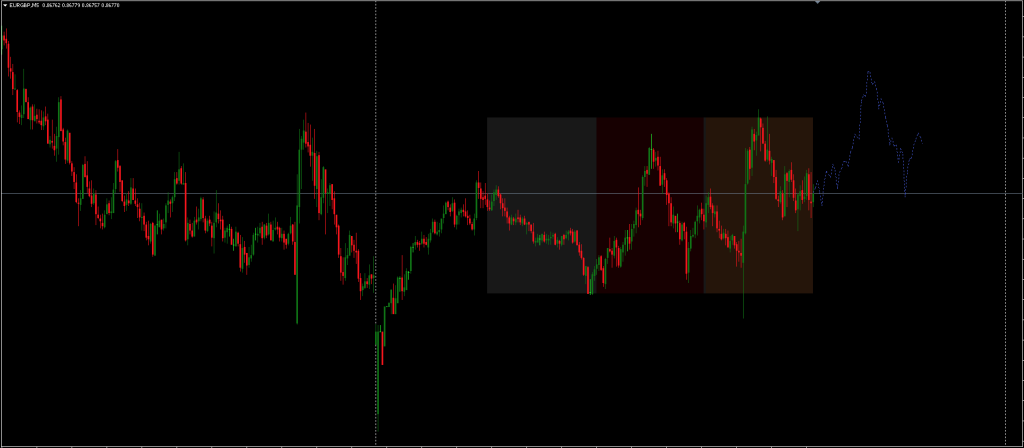
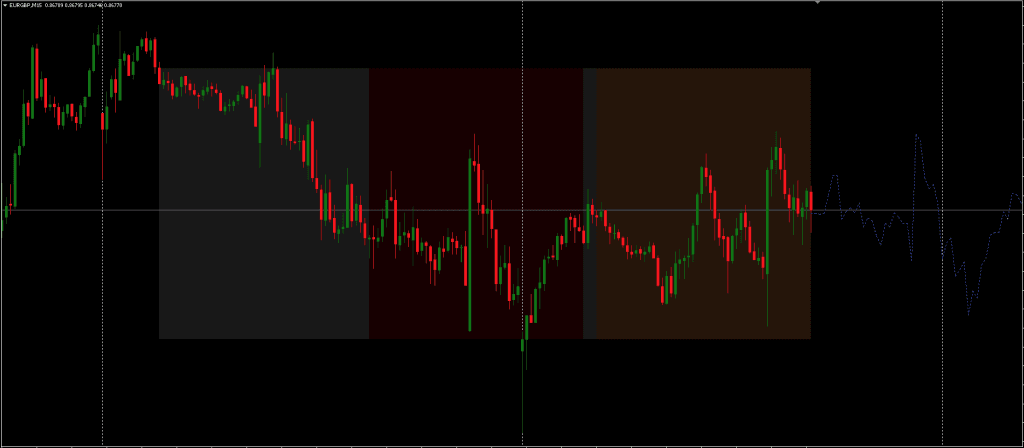
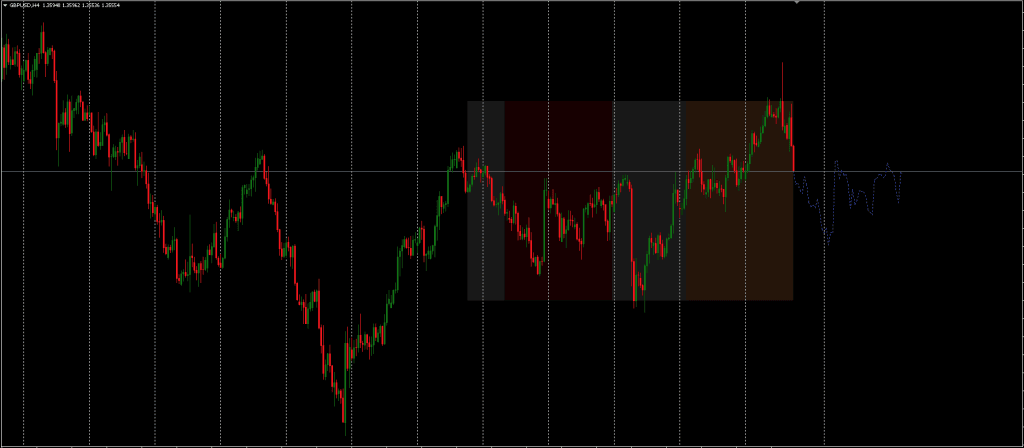
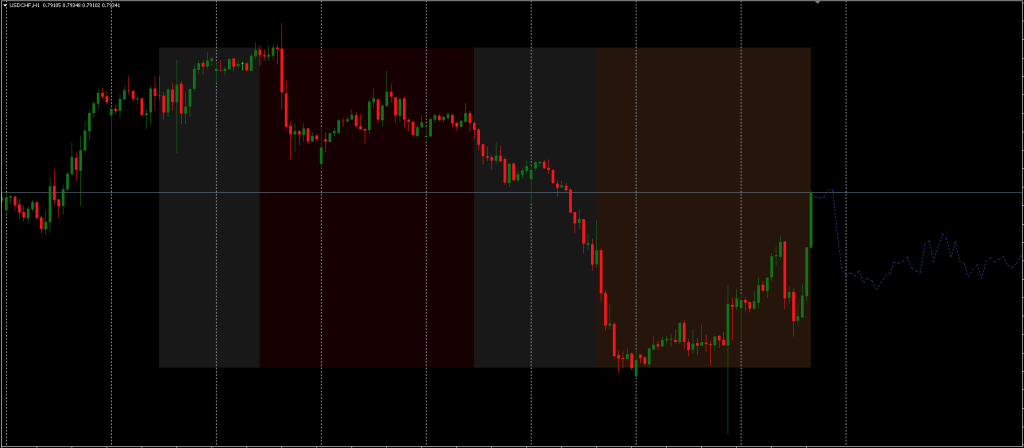
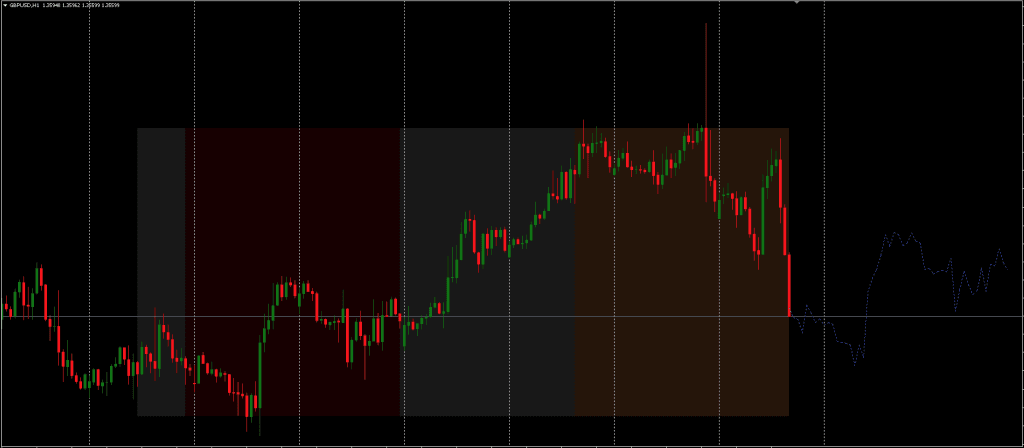
The Forex Forecast Indicator functions by extracting a segment of recent price behavior, referred to in documentation as the orange segment and comparing it against historical data within a broader time frame, marked as the gray zone. The tool searches for segments (shown in red) that either align or diverge in structure from the orange benchmark, based on calculated correlation values.
Notably, the method is intended to work best on detrended and periodic datasets. Removing trends from price data may help in highlighting the underlying periodic patterns that the algorithm is designed to detect. Nonetheless, this preprocessing requirement may limit its straightforward application across all market scenarios, particularly instruments that exhibit strong, non cyclic trends.
The Future Forecast Indicator primarily analyzes price fluctuations in the segment identified as w(t) (typically plotted in green). Several forecast modeling options are available:
- Cumulative: This method accumulates w(t) over the forecast period and adds the sum to the current price.
- Mean: This combines w(t) with the average price over the orange segment.
- Linreg: This utilizes a linearly extrapolated regression model based on the orange segment combined with w(t).
Each method has differing implications for forecast outcomes, and the choice may depend on the trader’s strategy or market conditions.
Forex Forecast Indicator isn’t a standalone trading indicator System. Still, it can be very useful for your trading as additional chart analysis, to find trade exit position(TP/SL), and more. While traders of all experience levels can use this system, practicing trading on an MT4 demo account can be beneficial until you become consistent and confident enough to go live. You can open a real or demo trading account with most Forex brokers.
Input Parameters
- Evaluation Window – This parameter designates the window size that helps find historical observations that are similar or dissimilar to current market behaviors. The total evaluation window is determined by combining the “Forecast Window” and “Evaluation Window.”
- Forecast Window – Defines the time horizon for the forecast.
- Forecast Mode – Enables selection between historical series that are either similar or different from the newest price observations.
- Forecast Construction – Influences the method of forecast development.
- Source Input – The primary data input utilized for the forecast.
Additional style settings are intuitive and easy to set.


How to Trade with the Future Forecast Indicator?
In use, the Future Forecast Indicator does not merely generate future predictions; it also serves as an archival analyzer by displaying historical patterns of similarity or deviation. These pattern segments can potentially inform traders of how similar scenarios unfolded in the past.
When applying the Forex Forecast Indicator, traders will observe key visual distinctions. The orange area indicating the base reference, and red segments representing historical matches within the dataset. It’s worth noting that color representations may vary based on chart background or platform settings.
A central element of the tool’s philosophy is that understanding the structure of historical price trajectories can provide a relative basis for market expectations. However, since the method depends on historical parallels, its effectiveness is inherently tied to the recurrence of similar price behaviors, something not guaranteed in dynamic forex markets.
Conclusion
The Forex Future Forecast Indicator presents a methodical approach to forecasting by repurposing historical price data to shed light on possible future movements. Its combination of statistical correlation, detrended data analysis, and multiple forecast options positions it as a tool for pattern based evaluation rather than a predictive guarantee.
Whether or not Forex Forecast Indicator aligns with a trader’s goals will depend on individual trading styles, strategy preferences, and comfort with time series analysis. Like many technical indicators, its utility likely improves when used in combination with other analysis tools rather than as a standalone forecasting solution.
Comment
Arafat