
Introduction: The Brazilian Secret to Catching Explosions
Most Moving Average crossovers are boring. By the time the Golden Cross happens, the trend is half over. But in Brazil, a legendary analyst named Odir “Didi” Aguiar discovered a specific crossover pattern that predicts not just a trend, but a market explosion.
He called it the “Agulhada” (The Needle).
The Didi Index Indicator for MetaTrader 4 (MT4) is the digital version of this famous setup. It takes three specific Moving Averages (3, 8, and 20) and flattens them into an oscillator window.
Instead of staring at messy charts, this indicator tells you exactly when the market is “threading the needle,” preparing for a massive breakout. If you are tired of late entries, this tool is your wake-up call.
Table of Contents
What is the Didi Index Indicator?
The Didi Index is a trend-following oscillator that displays the relationship between three Simple Moving Averages (SMAs):
- Fast: 3-Period SMA.
- Medium: 8-Period SMA (This acts as the Zero Line or Axis).
- Slow: 20-Period SMA.
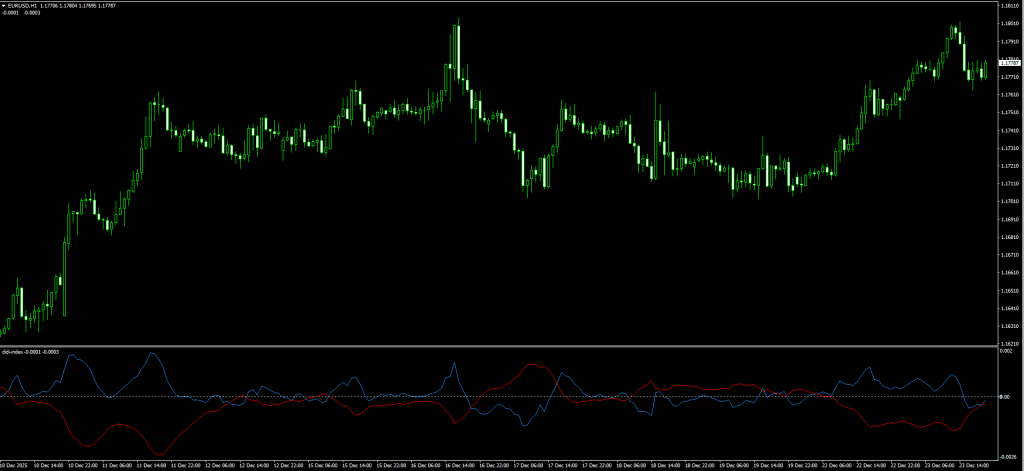
How It Works Visually:
In the indicator window, the 8 SMA is flattened out to become the straight Zero Line (0.00).
- The Fast Line (Green/Blue) moves above or below the zero line.
- The Slow Line (Red/Yellow) moves in the opposite direction.
When these lines pinch together and then violently separate, it looks like a thread passing through the eye of a needle. That is the “Agulhada”—the moment a consolidation turns into a trend.
Note: While some sources claim the indicator measures volume, the classic Didi Index used by institutional traders is based solely on the 3-8-20 Moving Average formula.
Review: Pros and Cons
Is the famous “Agulhada” strategy still valid for 2025? Here is our honest verdict.
✅ PROS (The Good)
- Explosive Entries: It is specifically designed to catch the start of a momentum burst, not the middle.
- Visual Clarity: It removes MAs from your main chart, letting you see price action clearly.
- Objective Signals: The “Needle” pattern (line convergence) is easy to spot.
- Versatile: Works on Stocks, Forex, and Crypto (where Didi Aguiar originally applied it).
❌ CONS (The Bad)
- The “Fake Needle”: In a completely flat market, the lines will knot together but never separate. You need a volatility filter (see Strategy below).
- Lag: While the Didi Index detects breakouts early, it is mathematically based on Moving Averages. Always wait for the candle to close to confirm the ‘Needle’ pattern is locked in.
The Strategy: The “Agulhada” Breakout System
Trading the Didi Index alone is risky because you might get caught in a “knot” (sideways chop). To rank this strategy among the best, we add a “False Check” Filter.
We will use the ADX (Average Directional Index) to confirm that the “Needle” actually has power behind it.


Setup & Settings
- Didi Index: Settings 3, 8, 20 (Standard).
- ADX Indicator: Period 14, Level 25 or 30 added.
- Bollinger Bands: Period 20, Deviation 2 (Main Chart).
- Timeframe: H1 or H4 (Best results).
1. The “Bullish Needle” Buy Setup
We are looking for the lines to pinch tight, then explode upwards.
- The Setup: Look for the “Pinch.” The Fast, Slow, and Zero lines should all be very close together (threading the needle).
- The Trigger: Watch for the Fast Line (Green) to shoot ABOVE the Zero line, while the Slow Line (Red) shoots BELOW the Zero line.
- Visual: It looks like an open mouth or scissors opening up.
- The False Check (Crucial): Check the ADX. The ADX line must be rising and ideally crossing above the level 20 or 25.
- Why? If ADX is flat or falling, the Needle is a dud.
- Bollinger Check: Price should be piercing the Upper Bollinger Band.
- Entry: Buy at the close of the breakout candle.
- Stop Loss: Below the recent consolidation low.
- Take Profit: Exit when the Fast Line hooks back down towards the Zero line.
2. The “Bearish Needle” Sell Setup
We are looking for the floor to drop out.
- The Setup: Look for the “Pinch” (Convergence).
- The Trigger: Watch for the Fast Line (Green) to shoot BELOW the Zero line, while the Slow Line (Red) shoots ABOVE the Zero line.
- The False Check: Check the ADX. It must be Rising (showing strong trend strength).
- Note: ADX rises for both uptrends and downtrends.
- Bollinger Check: Price should be piercing the Lower Bollinger Band.
- Entry: Sell at the close of the breakout candle.
- Stop Loss: Above the recent consolidation high.
- Take Profit: Exit when the Fast Line hooks back up towards the Zero line.
Pro Tip: The best trades happen when the Bollinger Bands are “Squeezed” (narrow) right before the Didi Index signals the breakout.
Indicator Settings: The Magic Numbers
When you open the Didi Index inputs, you will see three MA settings. Do not change these if you want to trade the authentic strategy.
- Prd_1 (Fast): 3 (Represents short-term momentum).
- Prd_2 (Slow): 20 (Represents the long-term trend).
- Prd_3 (Medium): 8 (This is the “Axis” or Mean).
Note: Some versions allow you to change the MA method (Simple, Exponential). Didi Aguiar originally used Simple Moving Averages (SMA), but many modern traders prefer Exponential (EMA) for faster reactions.
See the Agulhada in action: This video breaks down why the 3-8-20 crossover is so powerful.
How to Install (MT4)
- Download the Didi_Index.ex4 file from the link below.
- Open MetaTrader 4.
- Go to File > Open Data Folder > MQL4 > Indicators.
- Paste the file.
- Restart MT4 or Right-Click “Navigator” and hit Refresh.
- Drag it onto your chart.
FAQ: Frequently Asked Questions
Why is one line straight?
That is the 8-period Moving Average. The indicator flattens it to zero so you can easily see how the 3 and 20 MAs move relative to it.
Can I use this on M1?
You can, but the “Needles” are less reliable due to noise. We recommend M15 and H1 for the cleanest breakouts.
What if the lines don’t cross perfectly?
That is fine. As long as they are “pinched” very close together and then explode outward, the signal is valid. It’s about the compression of energy.
Final Verdict: Is it Worth Using?
Score: 4.5/5 Stars ⭐⭐⭐⭐🌗
The Didi Index Indicator is a legendary tool for a reason. It simplifies one of the most effective market concepts: Volatility Compression.
By visualizing the “Needle,” it helps you stay out of choppy markets and only enter when the MAs are aligned for a massive move. Just remember to use the ADX Filter to verify the explosion!
This indicator was featured in our Top 10 Best Free MT4 Indicators for 2026 — read the full comparison with expert reviews and trading strategies.
No funcionan los enlaces de descarga
Ahora si funcionan