

Pro Trend Line is a non-repainting trend line indicator for MT4, also sold under its original name TREND LINES PRO. Rather than smoothing price into a moving average, it tracks swing highs and lows, marks the point where one of them is taken out, and draws that level on the chart as a Break of Structure line. Everything it plots is fixed at bar close.
Most trend indicators tell you which way price has been moving. This one is built to answer a narrower question: where did the trend actually change, and at what price does that change stop being valid. This review covers what it draws, how the three structure tiers differ, what the control panel does, the settings that matter, and where the tool falls short. The indicator is also sold under its original name, TREND LINES PRO.
TL;DR – A non-repainting market structure indicator for MetaTrader 4. It draws Break of Structure levels in three tiers, each doubling as a stop level, and numbers re-entry points inside a single trend leg. It holds up from M5 upward and struggles on M1. There is no MT5 build, and the developer intends it to be run alongside a second paid indicator.
Key Takeaways
- Non-repainting trend line indicator for MetaTrader 4, free to download here
- Levels fix at bar close, so the back-scrolled chart matches what you would have traded
- The cost of that: every entry is one bar late, so it suits structure trading over scalping
- Grades breaks into three tiers, and each tier label doubles as your invalidation price
- Holds up from M5 upward and struggles on M1
- MT4 only, with no MT5 build, and built to run beside a second paid indicator
What It Draws and How to Read It
A Break of Structure is the moment price closes beyond a prior swing point, which says that swing no longer holds. The indicator finds those automatically and, more usefully, grades them. Not every break carries the same weight, and treating them as equal is how traders end up buying the top of a pullback.
- BOS – A minor swing high or low taken out. The smallest tier and the noisiest. Inside an established trend it reads as continuation. On its own it says the last leg is over, not that a new one has started.
- ChoCH SL – A Change of Character: a break against the prevailing trend, and the first real evidence of a turn rather than a pullback. It is also the tier that needs the most confirmation, not the least. The same concept in isolation is our BOS and ChoCH Market Structure Indicator.
- MEGA BOS SL – A break of the level that defined the entire prior leg. Rare, holds on the chart far longer than the other two, and the tier worth sizing properly.
The mechanics behind those labels:
- The tier label is your stop – Each level sits at the price where that structure read stops being valid, so the invalidation point is placed for you rather than eyeballed.
- Nothing commits until the bar closes – Swings are detected from price alone, with no oscillator or volume input, and no level is drawn on an open candle. This is why the historical chart matches what you would have seen live. It also means entries are always one bar late.
- Numbered re-entries – Inside one active line, further points are numbered 2, 3, 4. These mark continuation after a pause rather than fresh signals, which is what lets you scale into a move instead of getting one chance at a fill.
- Move SL – As a move extends, the plotted stop steps toward entry and cuts open risk without you touching the trade.
- Higher-timeframe overlay – Structure from higher intervals is drawn under the working chart, so an M15 signal can be checked against H4 without switching charts.
The vendor describes MEGA BOS levels as the footprints of the largest market participants. We would not put it that way. What the tool measures is the size of the swing that broke, which is an objective property of the chart. Whether a bank was behind it is not something an indicator can see.
If you would rather have this logic inside a broader package than as a standalone tool, our Market Structure All In One and Smart Money Concept AIO both cover it.
Does Pro Trend Line Repaint?
No, and it is worth knowing exactly why, because the reason is also the catch. Swings are detected from price alone. There is no oscillator and no volume input feeding the calculation, and nothing is drawn on an open candle. Every level fixes at bar close and then stays put, which is why the historical chart you scroll back through matches what you would actually have seen live. That is the whole test, and this tool passes it.
The cost is simple and no review should skip it. Because nothing is committed until a bar closes, every entry is one bar late. A tool that can never repaint can never be early either. Those are the same sentence. On M15 that is fifteen minutes of the move gone before the level appears, which is fine for structure trading and wrong for scalping. It is the trade you are making when you choose a non-repainting tool over a predictive one.
Controls and Settings
The tool is driven from on-chart buttons rather than the inputs window, and ships with no reference. Here is one.
| Control | What it does |
|---|---|
X key | Hide/show the panel |
S key | Hide/show trend change points |
L key | Hide/show SUPER BOS and MEGA BOS levels |
| SCANNER | Multi-symbol, multi-timeframe trend strip |
| BOS LINE | Structure lines on/off |
| FILTER MTF | Overlay higher-timeframe structure |
| MM BOS | Full structure read: last change, numbered highs and lows, direction printed mid-chart. Learn this one first |
| MM PRO | Adds the higher tiers to that view |
| ENTRY POINTS | Entry markers and their numbering |
Three inputs matter:
- Symbol suffix – Needed if your broker names instruments
EURUSD.morGBPUSDpro. Wrong value, empty scanner. - Alerts – Pop-ups and mobile push. Push needs your MetaQuotes ID under Tools, Options, Notifications.
- Candle colouring – Colours candles after an arrow prints, until target or an opposing signal.
| Timeframe | MTF overlay | Best use |
|---|---|---|
| M1 | Not advised | Structure reads break down here |
| M5 | M30 or H1 | Intraday scalping, practical floor |
| M15 | H1 or H4 | Day trading, best balance |
| H1 | H4 or D1 | Swing entries, cleanest levels |
| H4 / D1 | D1 or W1 | Position trading, levels hold for weeks |
Sizing and Risk
The one thing the indicator does not do for you is decide how much to risk. Because the stop is plotted rather than chosen, the distance changes from signal to signal, which means a fixed lot size gives you a different risk on every trade. Size from the level instead, using our Lot Size Optimizer, and check the trade is worth taking with the Risk-Reward Ratio Indicator before you click.
As a standalone indicator, its effectiveness often depends on how it’s combined with other tools or strategies. Structure tells you where price broke. It does not tell you whether the level it broke into is already spoken for, which is why pairing it with a zone tool such as Auto Supply and Demand earns its chart space.
What We Saw on the Charts
Running it across GBPUSD and USDCHF from M1 up to H1 produced one clear pattern, and it is not the one the sales page implies.
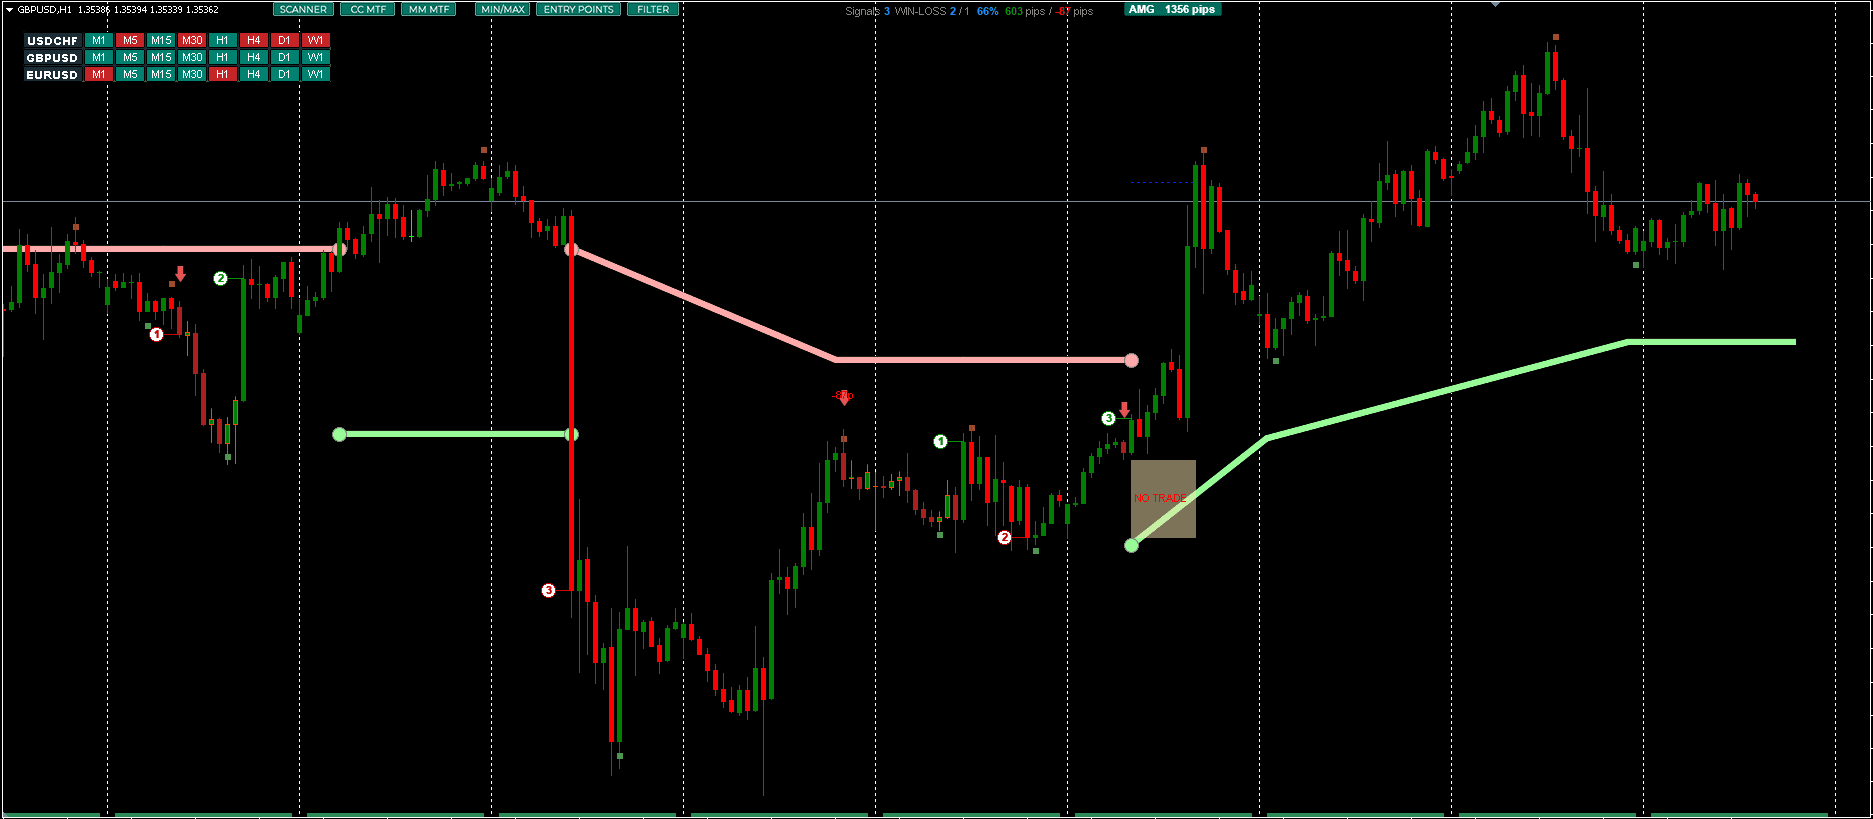
The tool keeps its own running tally on the chart of signals fired and pips won against pips lost. On M5 and H1 that tally sits comfortably positive, and the levels land where you would have drawn them by hand. On M1 it is close to break-even.
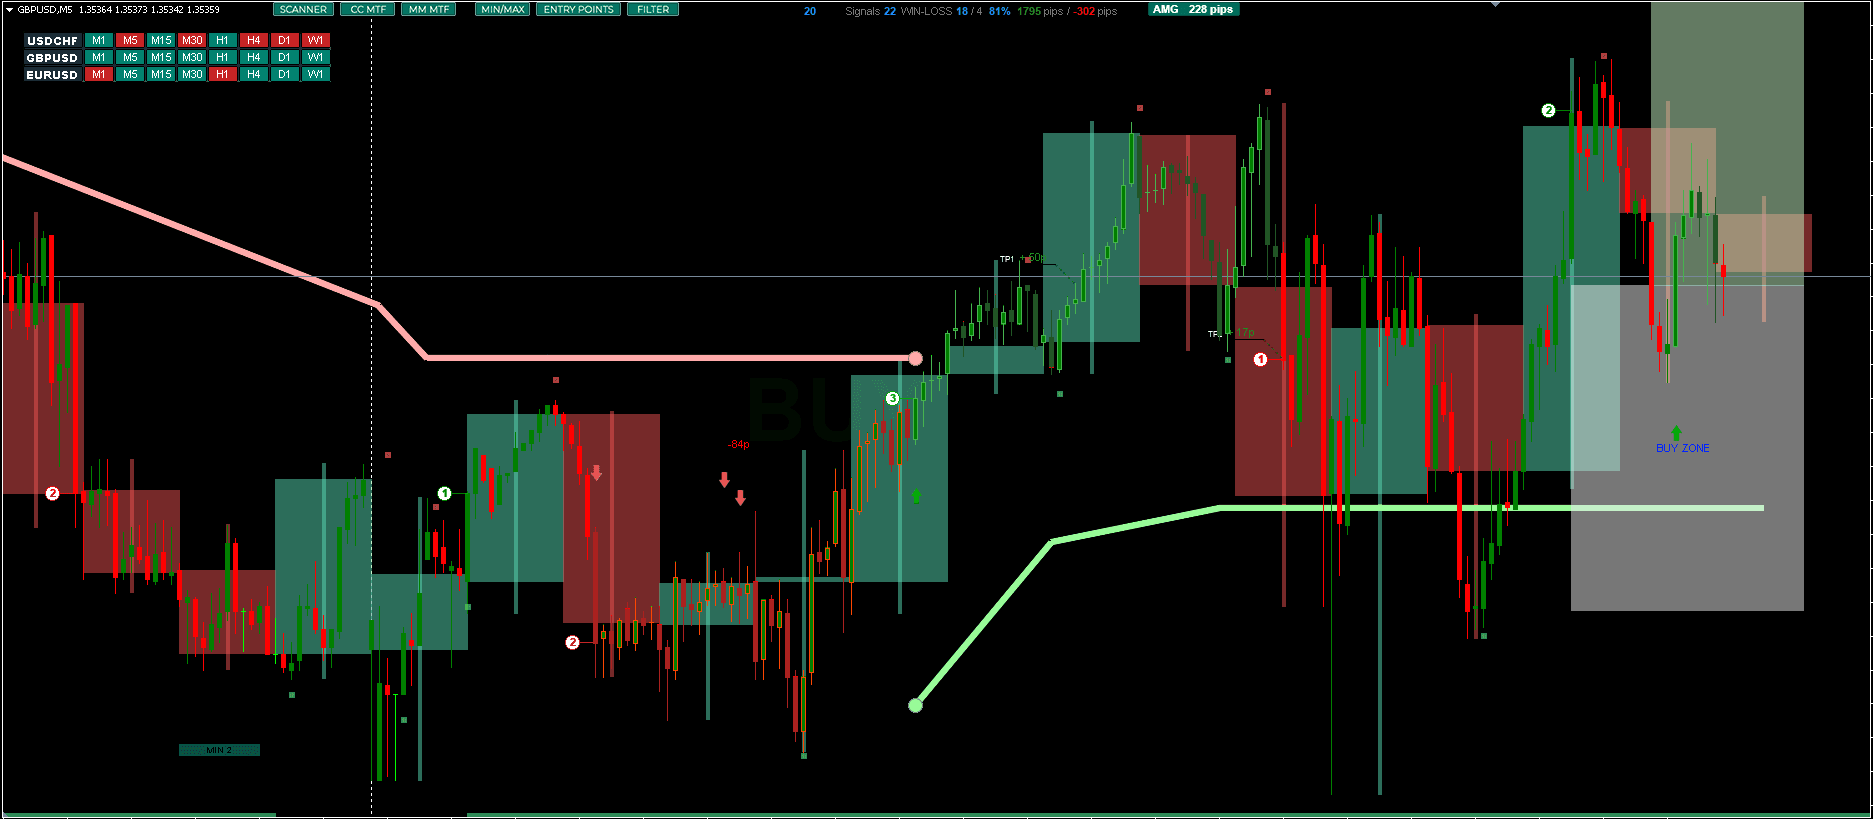
That is what a structure tool should do. Swing detection needs swings, and on a one-minute chart most of what looks like a swing is spread and noise. Compare the M5 chart above against the M1 chart below: same pair, one timeframe down, and a visibly worse read. Treat M5 as the floor and prefer M15 or higher.
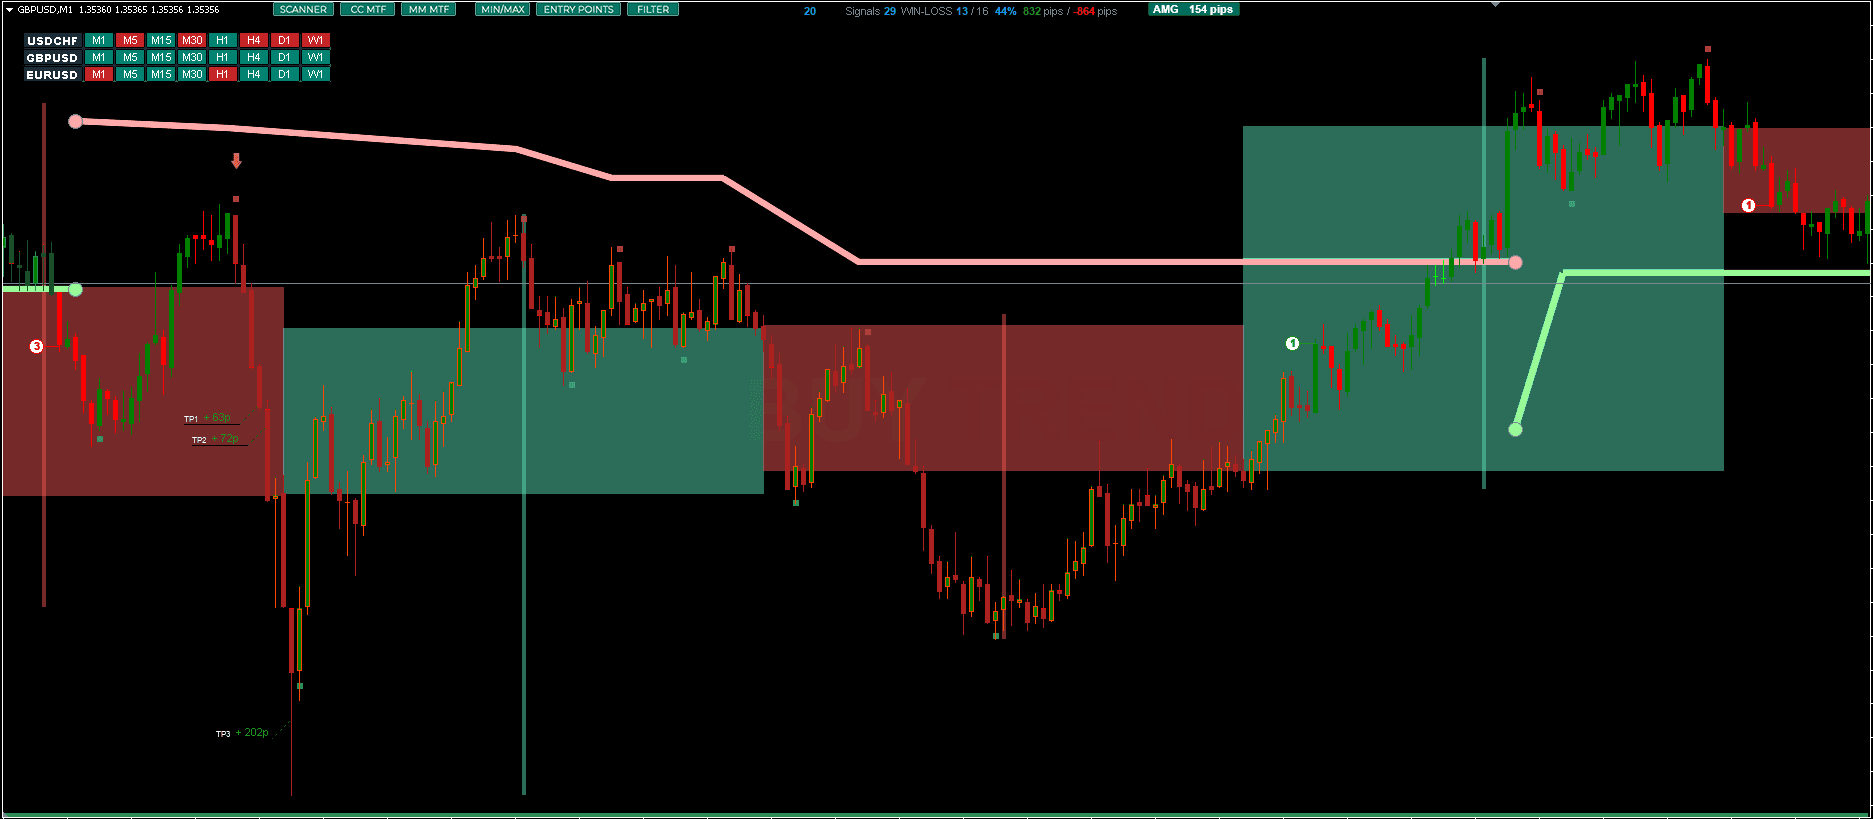
One caveat on that tally: the indicator generates it, not an independent backtest, so it ignores spread and slippage and closes each signal on its own terms. Read it as a feel for behaviour, not as performance data.
Higher up the picture tightens. Fewer levels get drawn, they sit further apart, and the ones that print survive longer, which is exactly what you want if you are placing a stop against them.
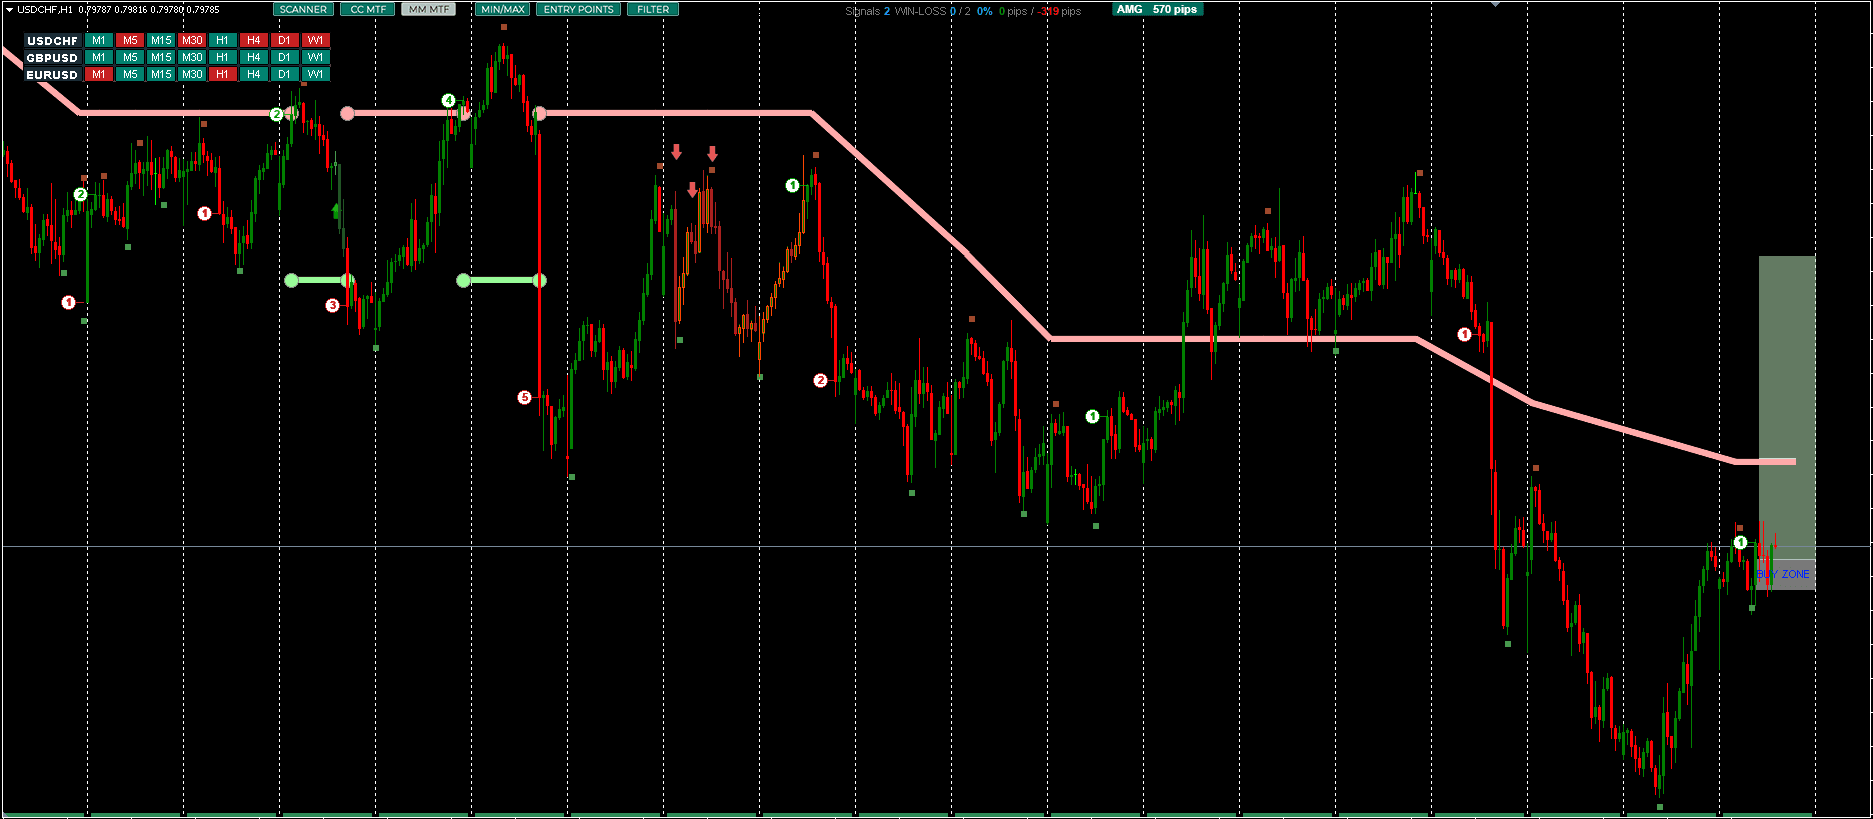
The scanner strip in the top-left is the part most traders end up using daily. Each row is a symbol, each chip a timeframe, coloured by direction. A row reading one colour end to end means every interval agrees, and those are the setups worth waiting for. For that function on its own, our Trend Radar covers a wider symbol list.
Core Features
- Broad instrument support – Any forex pair, metal, or index in your terminal.
- Three-tier structure ranking – BOS, ChoCH, and MEGA BOS separated by significance rather than lumped together.
- Non-repainting by design – Calculations fix at bar close and levels persist, so the chart history is honest.
- Numbered re-entry markers – Continuation points inside one trend leg, numbered in sequence.
- Automatic stop reduction – The
Move SLfunction steps the stop toward entry as a move extends. - Full market structure view – Numbered swing points and a printed direction label via the
MM BOSbutton. - Multi-timeframe overlay – Higher-interval structure shown under the working chart.
- Multi-symbol scanner – Fires an alert when intervals converge on one direction.
- Terminal and mobile alerts – Pop-ups on the platform, push notifications to the phone.
Pro Trend Line Indicator
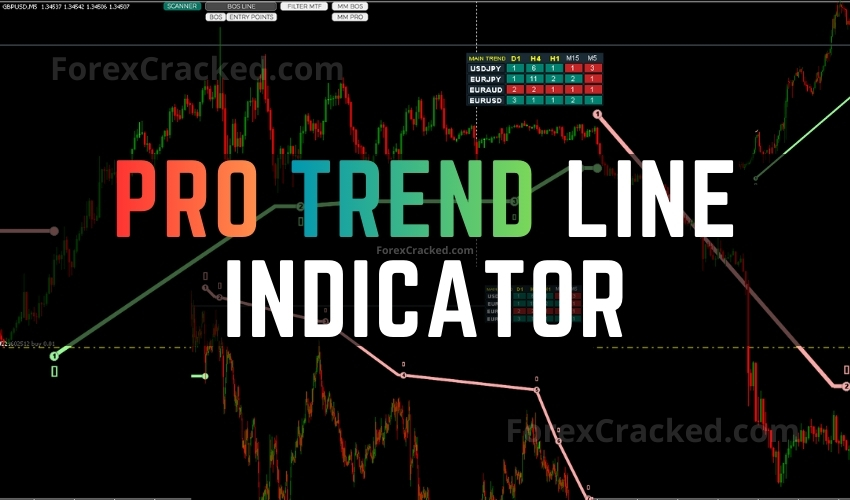
A non-repainting MT4 market structure indicator that plots Break of Structure levels in three significance tiers, tracks numbered re-entries inside a single trend leg, and includes a multi-timeframe trend scanner with mobile alerts.
Pros
- Structure breaks ranked by significance instead of treated as equal
- Levels and arrows fixed at bar close and never redrawn
- Numbered re-entry markers inside a single trend leg
- Stop level tightens automatically as a move extends
- Built-in scanner flags when timeframes line up, with mobile push alerts
Cons
- Interface depends on panel buttons and hot keys with no written reference
- Signal quality drops off badly on M1
- Entries are always one bar late by design
Summary
A focused structure tool that does one job properly. Ranking breaks into three tiers is genuinely useful, because it separates a minor swing failure from a break of the level that defined the whole leg. The bar-close rule means the chart you review on Sunday is the chart you traded on Friday. The trade-offs are real though: MT4 only, an interface driven by unlabelled panel buttons, and a developer who steers you toward buying a companion indicator.

 Built by ForexCrackedWe tested 1,200+ indicators. Then we built our own.Six years of reviewing EAs and indicators went into FXC Fusion: two engines, the seven-panel cockpit, MT4 and MT5, from the team behind this site.
Your download will start automatically. If it doesn’t, click here.Right now a download can take up to a minute to start. Please wait a moment, or use click here.
Who It Is Not For
- M1 scalpers – The structure logic needs room. On a one-minute chart it does not get it.
- MT5 users – There is no build for you, and no sign that one is planned.
- Traders who want a signal to follow blindly – This draws structure. Deciding what to do about it is still your job.
- Anyone who dislikes a busy chart – With every panel toggle on it gets crowded fast. Learn the hot keys.
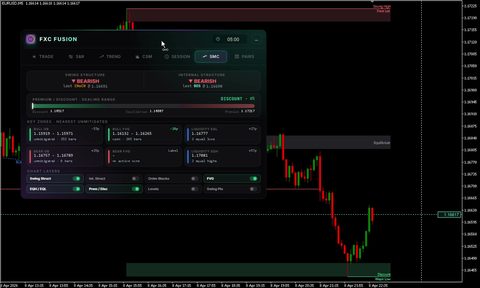
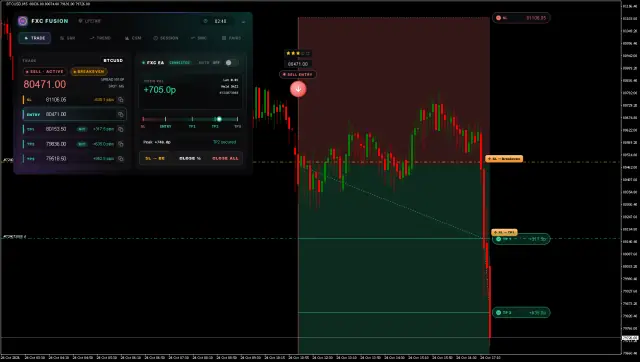
Prefer one tool that commits instead of three that need reconciling? FXC Fusion is the first indicator we built ourselves rather than reviewed, for MT4 and MT5. It waits for one specific condition, scores it, and either commits to a full trade plan or stays quiet. The dashboard and the signal engine are the same system, so the panels explain why a signal fired instead of sitting next to it.
How It Compares to the Alternatives
| Pro Trend Line | Entry Point Trend | RFI Levels | |
|---|---|---|---|
| Core job | Where structure broke | When to enter | Where price reverses |
| Main output | Tiered BOS levels | Entry arrows and zones | Reversal zones with TP/SL |
| Break ranking | Three tiers | None | Not applicable |
| Stop handling | Level plus auto-reduction | Suggested zone | Built-in, minimum 1:2 |
| Scanner | Yes | Yes | Yes |
| Platform | MT4 | MT4 | MT4 |
| Best paired with | A zone or reversal tool | A structure tool | A structure tool |
The three overlap less than the marketing suggests. Pro Trend Line answers where, Entry Point answers when, RFI Levels answers what happens at the level. The developer recommends running this one with RFI LEVELS PRO, and the logic holds up, but it is also a second paid product. Test this one alone first and decide whether you actually need the pair.
FAQ: Frequently Asked Questions
EURUSD.m, EURUSDpro or similar, enter that suffix in the inputs. The scanner builds its symbol list from that setting and silently returns nothing when it is wrong.Conclusion
The Pro Trend Line Indicator does one thing and does it properly. Grading structure breaks into three tiers is a real improvement over tools that treat every swing failure as equal, and the bar-close rule means the chart you review later is the chart you traded. The automatic stop reduction and the numbered re-entry markers are practical additions rather than decoration.
The limits are worth respecting. It is MT4 only, it is weak below M5, the interface assumes you will discover it by clicking, and the developer would prefer you bought a second indicator to go with it. As a structure layer inside a wider process it earns its place. As a complete system on its own it is not one.


Discussion 3 comments
Is this still working?
THE PREVIEWS POST IS WRONG —- THE ProTrent works BEST !! THK U
works But DVP Settings have (?????) language usuported
It dosent work