

If you love the classic SuperTrend but often get caught in false flips, the SuperTrend Strategy gives you a smarter, cleaner solution. With this advanced SuperTrend Oscillator indicator for MT4 and MT5 converts traditional SuperTrend logic into an oscillator view complete with a main line, signal line, histogram, and built-in false-signal statistics. It helps you instantly read trend direction, strength, and reliability, while filtering out weak or choppy setups.
In this guide, you’ll learn:
- What makes the SuperTrend Oscillator unique
- How to interpret its main line, signal line, histogram, and accuracy metrics
- A complete Trend-Plus-Pullback SuperTrend Strategy
- Recommended settings, risk management, and best market conditions
- And finally, where to download the indicator and test it on your charts
Table of Contents
What Is the SuperTrend Oscillator Indicator?
The SuperTrend Oscillator is an ATR-based momentum and trend tool built from the standard SuperTrend indicator. Instead of drawing a trailing line on your chart, it compresses all that information into an oscillator in a separate window.
Core design:
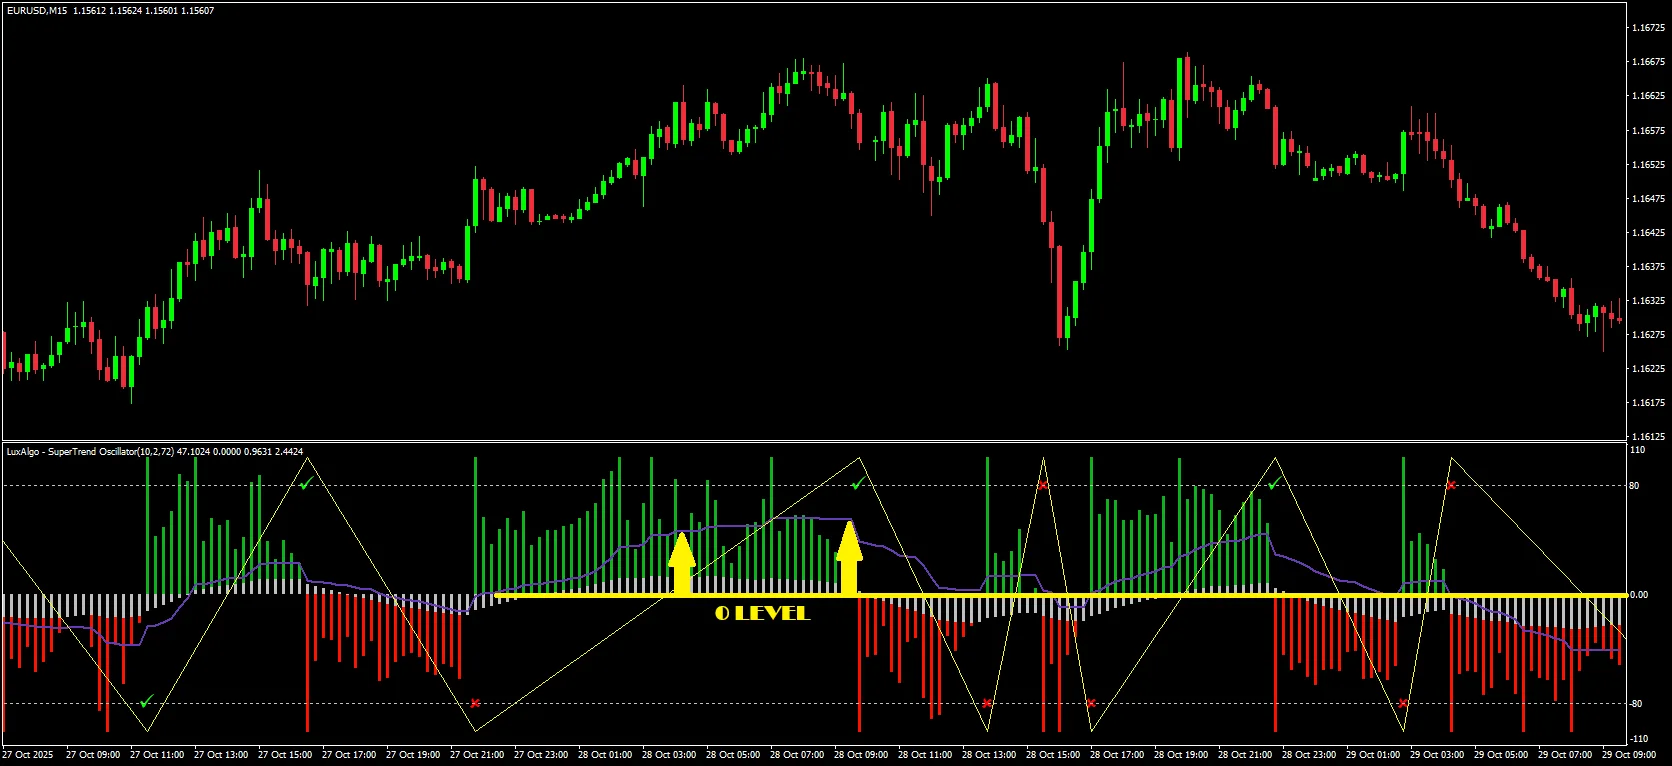
- Main oscillator line
- Derived from the distance between price and the SuperTrend line, normalized into a fixed range (typically –100 to +100).
- Above 0 → price is above the SuperTrend (bullish bias).
- Below 0 → price is below the SuperTrend (bearish bias).
- Signal line
- A smoothed version of the main oscillator, computed with an adaptive exponential filter.
- Stays closer to the main line during strong trends, smooths more when markets are quieter.
- Histogram
- Shows the difference between the main line and the signal line (similar to MACD’s histogram).
- Used to anticipate potential crosses of price and SuperTrend, and to filter false signals when the sign of the histogram disagrees with the main line.
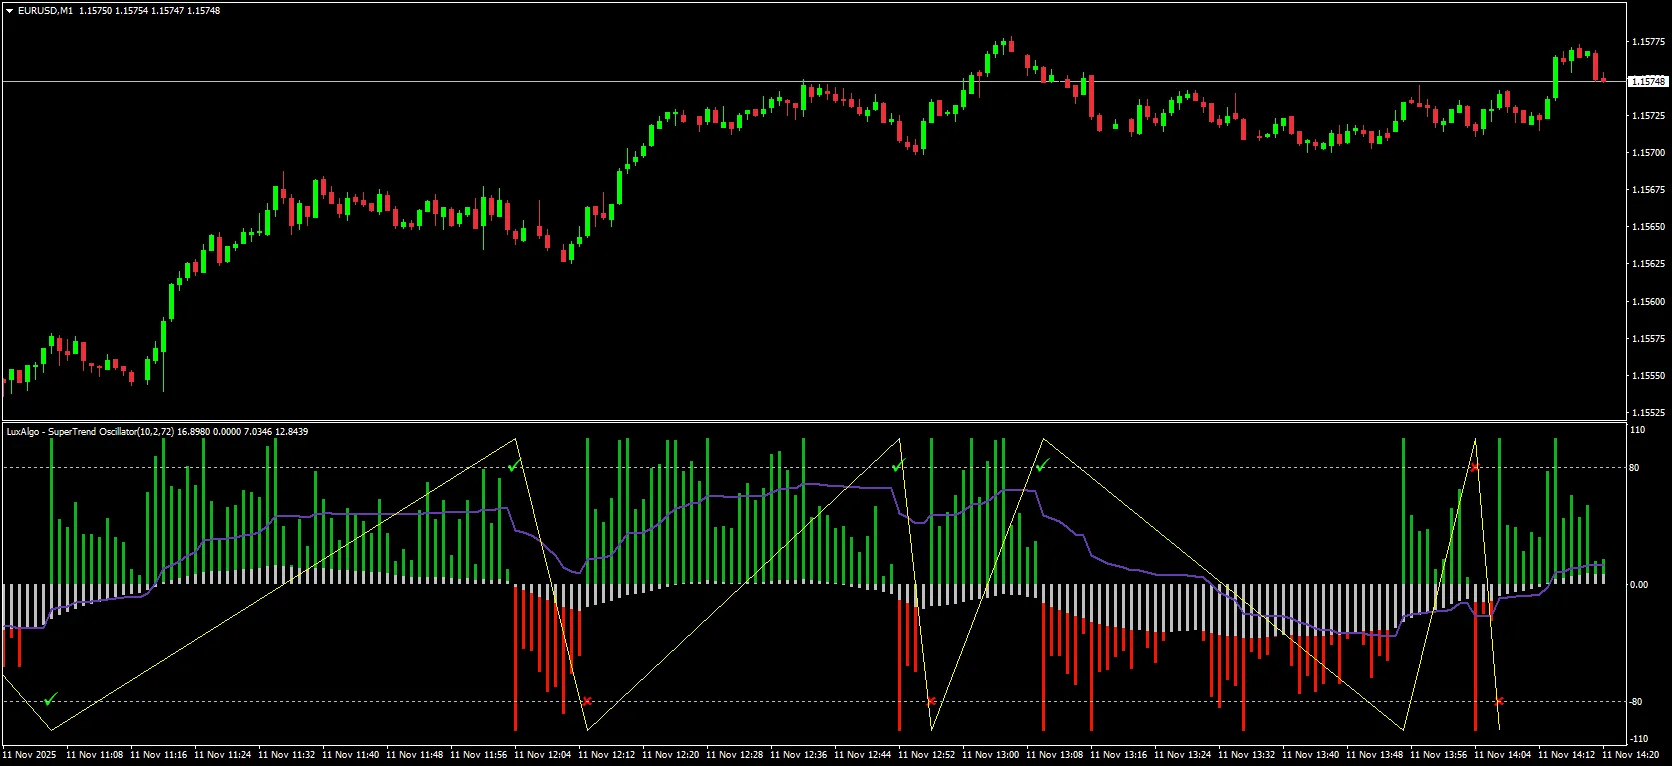
- False-signal analytics
- The indicator can tag historical SuperTrend signals with checkmarks (valid) and crosses (false), plus a percentage of false signals over the visible chart.
It works on any symbol and timeframe supported by MT4/MT5: Forex, indices, commodities, crypto, metals, and more.
How to Read the SuperTrend Oscillator
1. Trend Direction
- Main line > 0
- Price trades above the SuperTrend line
- Market bias: bullish
- Main line < 0
- Price trades below the SuperTrend line
- Market bias: bearish
For a simple trend filter:
- Only look for buys when the main line stays above 0.
- Only look for sells when the main line stays below 0.
2. Trend Strength
Because the oscillator is normalized, the distance from 0 gives a quick view of strength:
- +70 to +100 → strong bullish trend
- –70 to –100 → strong bearish trend
- Values closer to 0 → weaker or undecided conditions
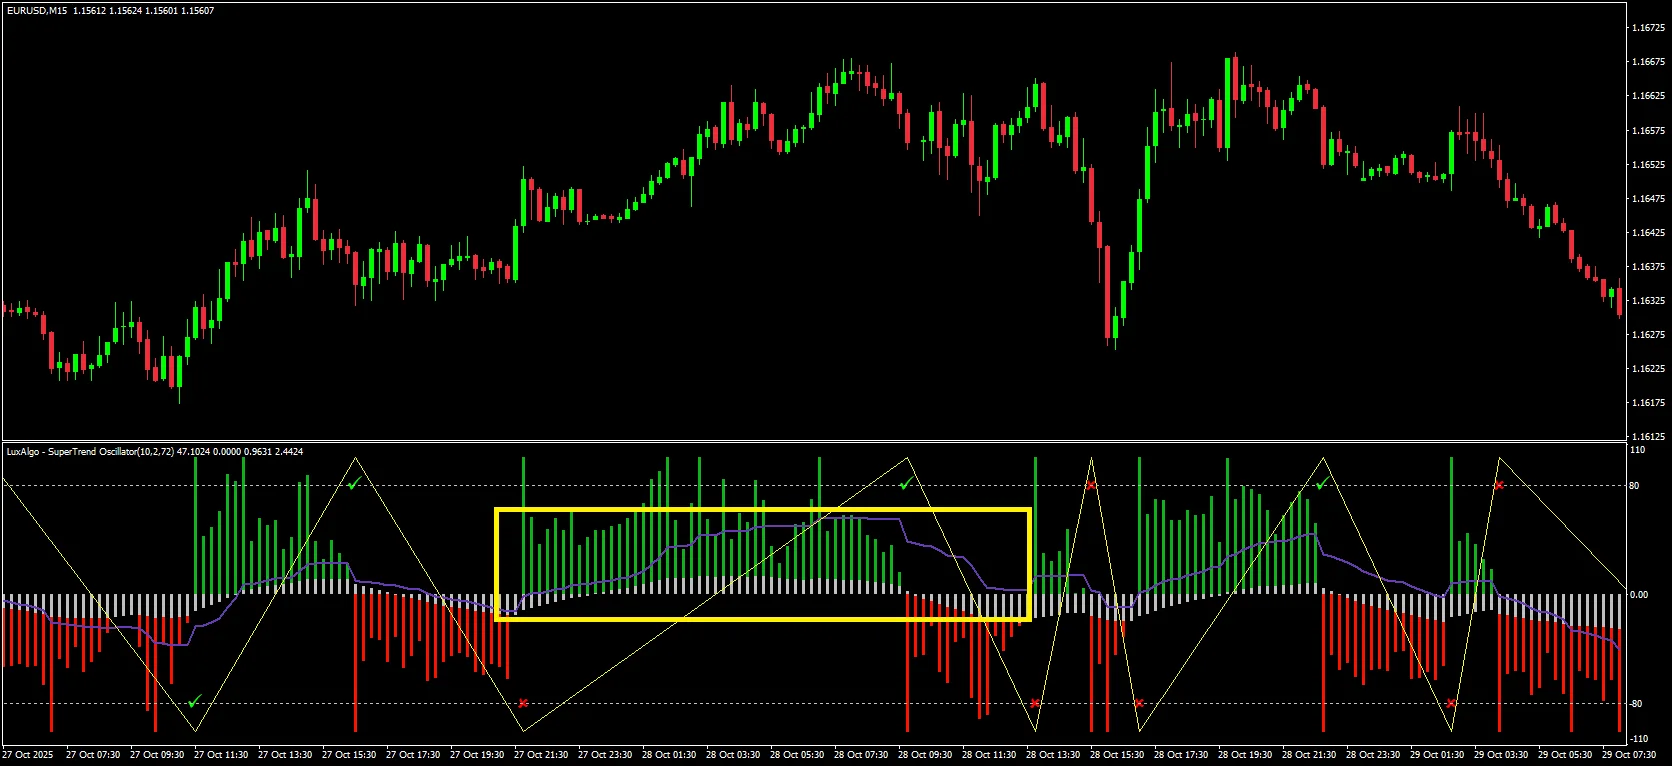
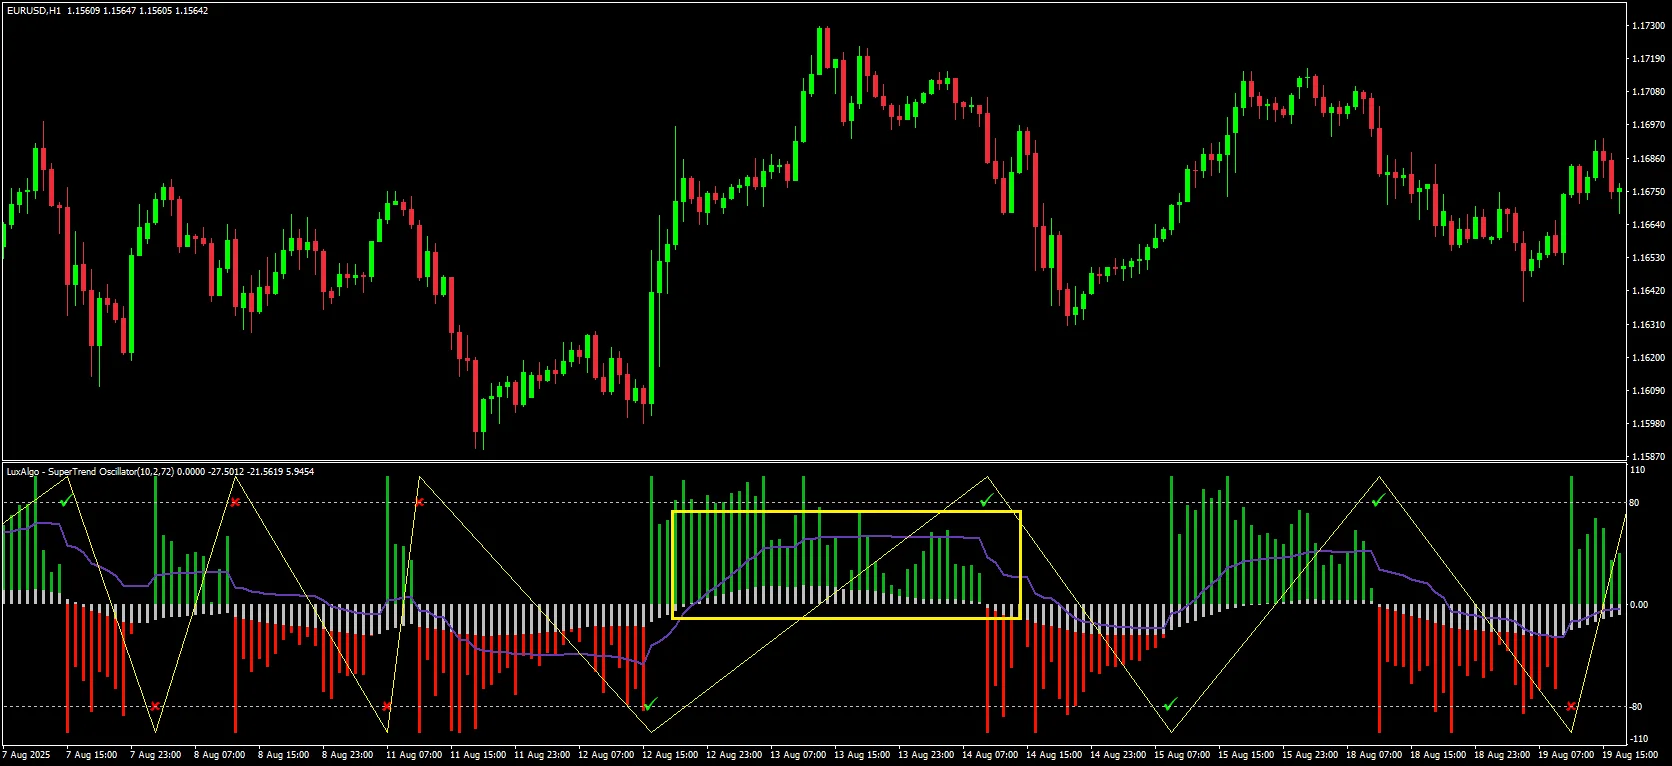
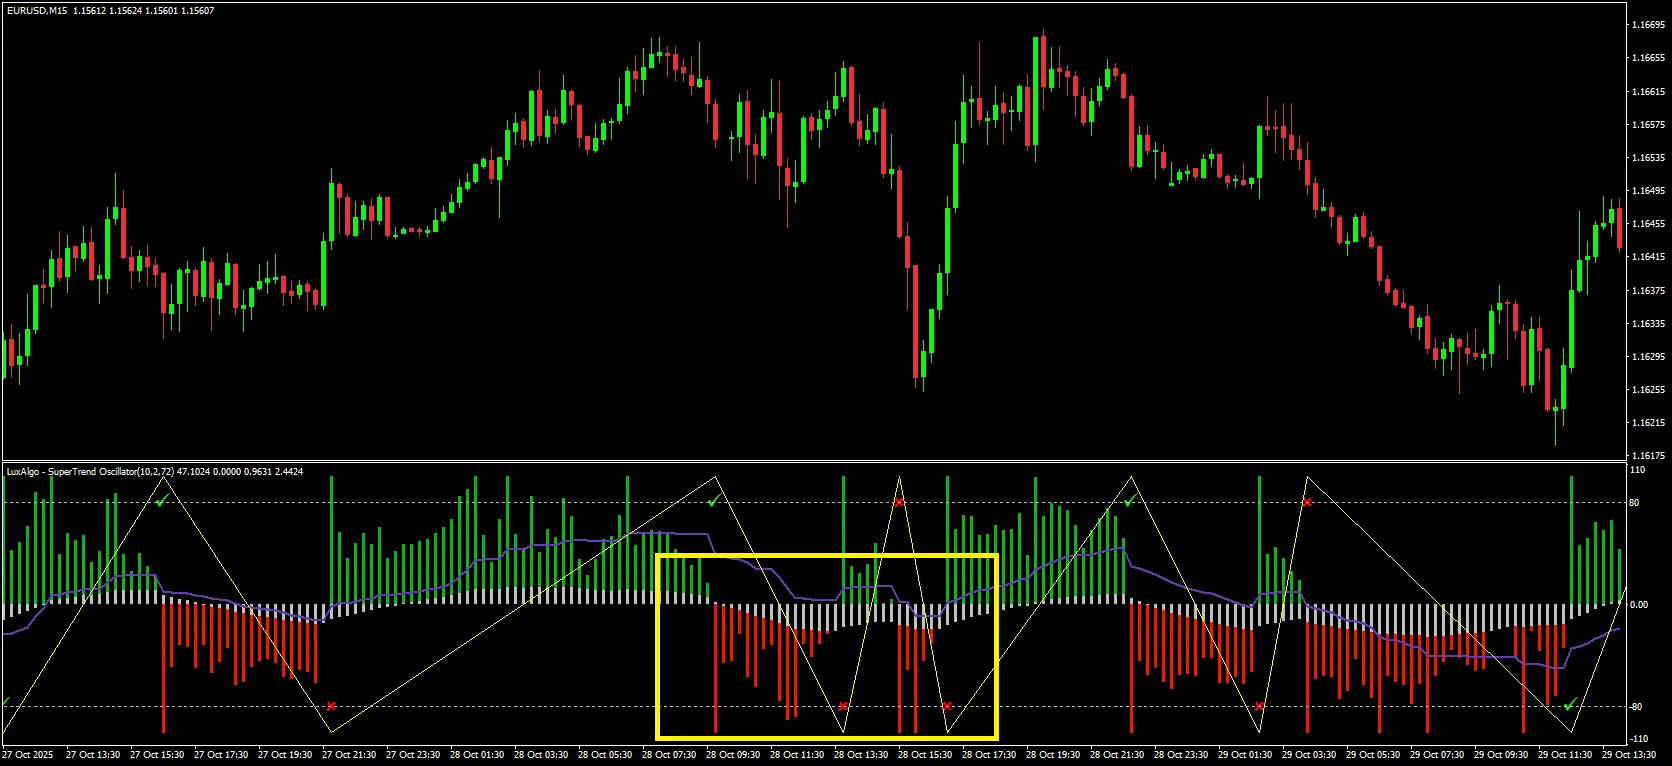
3. Retracements and Ranging Markets
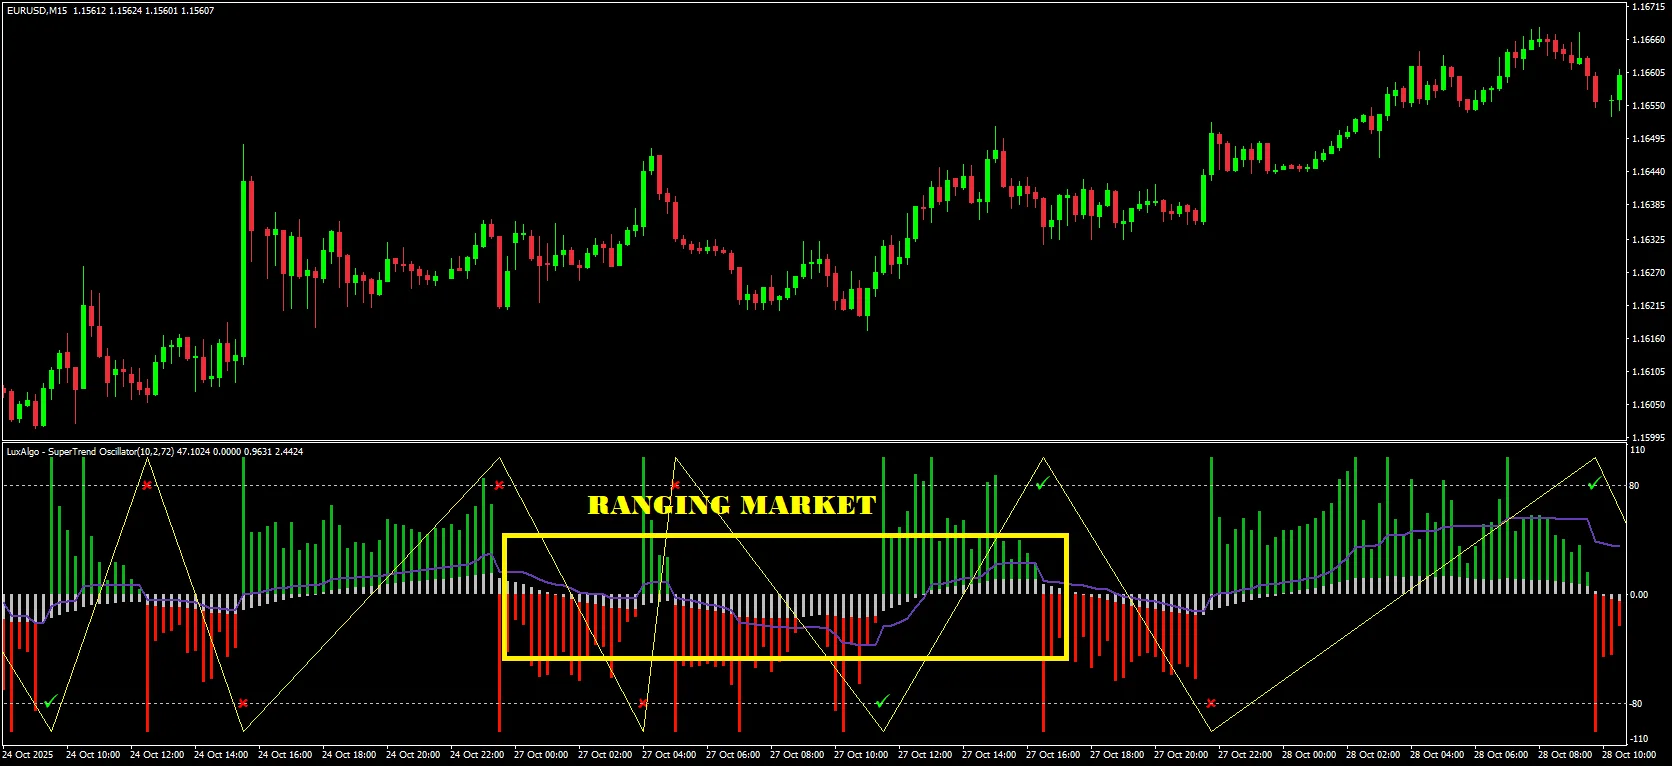
When the main line oscillates in the –50 to +50 zone, the indicator often interprets that as:
- A pullback inside a larger trend, or
- A sideways/ranging phase with no clear momentum edge
This “mid-zone” is crucial for pullback strategies: you use it as your setup area, then wait for the oscillator to re-align with the dominant trend before entering.
4. Histogram and False-Signal Filter
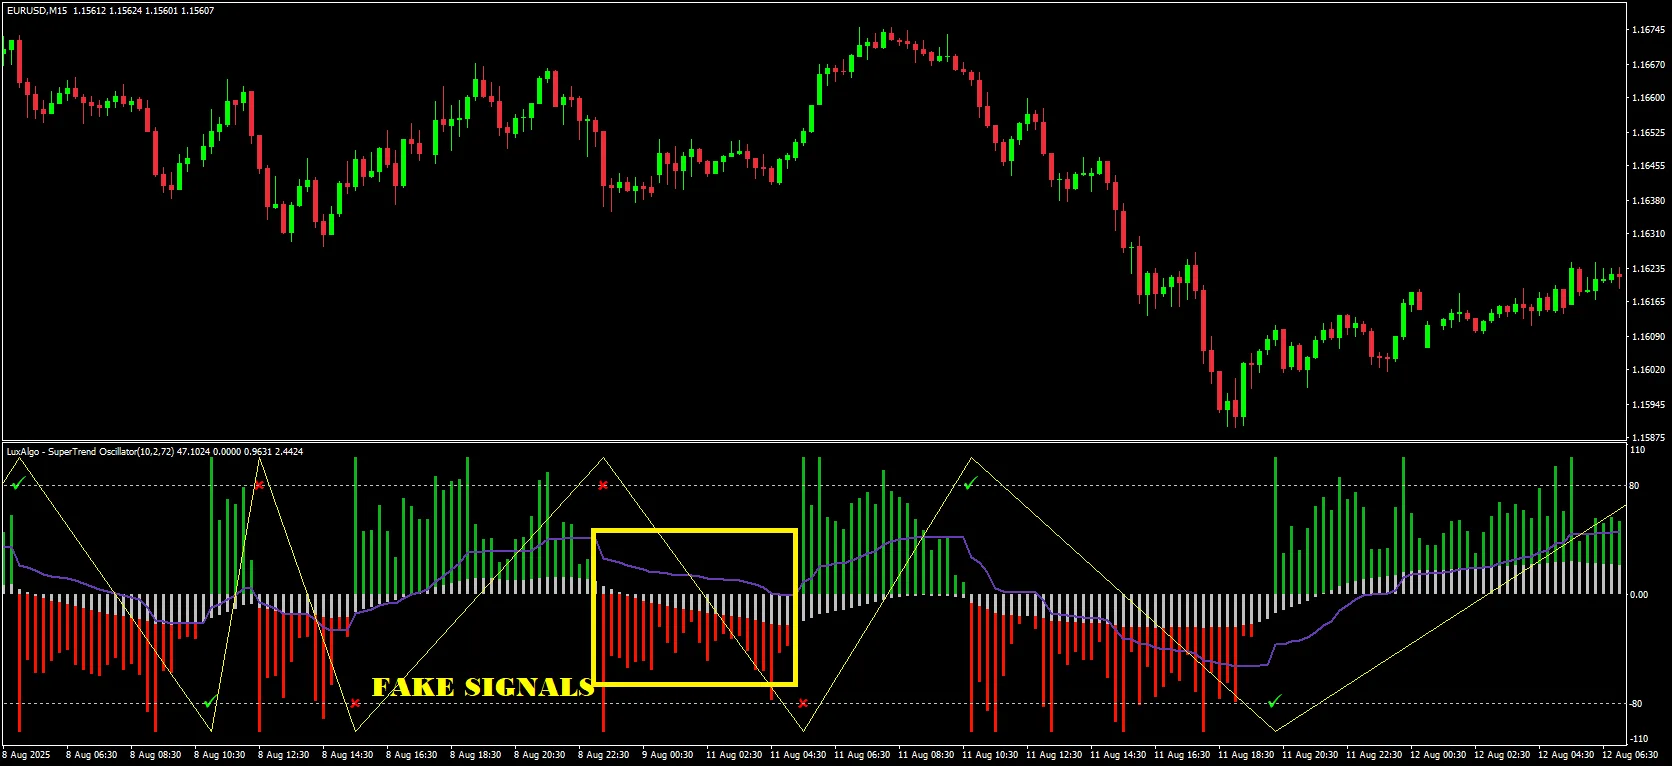
The histogram compares the main oscillator to its signal line. You can treat it as a quality control layer:
- Main > 0 and Histogram > 0
- Bullish pressure confirmed
- Main < 0 and Histogram < 0
- Bearish pressure confirmed
- Main and Histogram with opposite signs
- Potential fake SuperTrend cross → many traders ignore those signals.
Add to that:
- Checkmark ✔ above/below price → previous SuperTrend signal ended up valid.
- Cross ✖ above/below price → previous signal was false.
This gives you something most “raw” trend indicators don’t: historical reliability feedback right on the chart.
Recommended SuperTrend Oscillator Settings for MT4/MT5
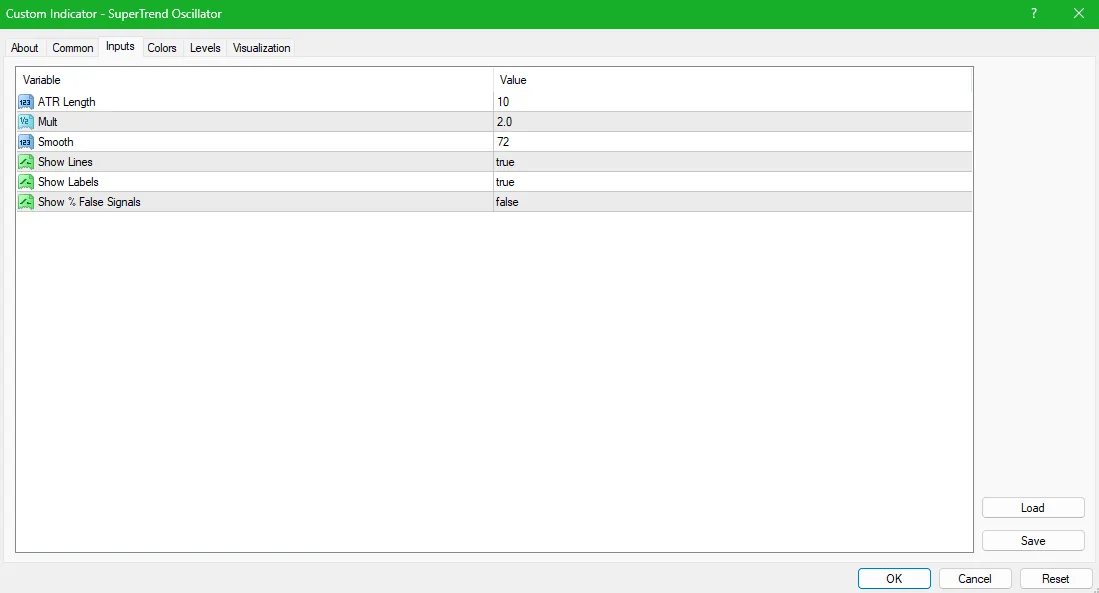
Exact defaults can vary by implementation, but they all rely on the Average True Range (ATR) length and a multiplier (factor), inherited from the underlying SuperTrend. A very common starting point for SuperTrend-type tools is:
- Length (ATR period): 10
- Mult (ATR factor): 3.0
- Smooth (histogram smoothing): 2–5 (higher = cleaner, but a bit slower)
Practical tuning:
- For scalping / fast intraday
- Slightly lower Length (7–10) and moderate Mult (2.5–3.0).
- Aim for faster turns but be ready for more signals.
- For swing trading on H1–H4 / D1
- Standard Length ≈ 10–14, Mult ≈ 3.0–4.0.
- Fewer flips, more stable trend legs.
If you see constant choppy flips around 0, either:
- Increase Length or Mult to smooth things, or
- Move up one timeframe.
Download a Collection of Indicators, Courses, and EA for FREE
The Core SuperTrend Oscillator Strategy (Trend + Pullback + Filter)
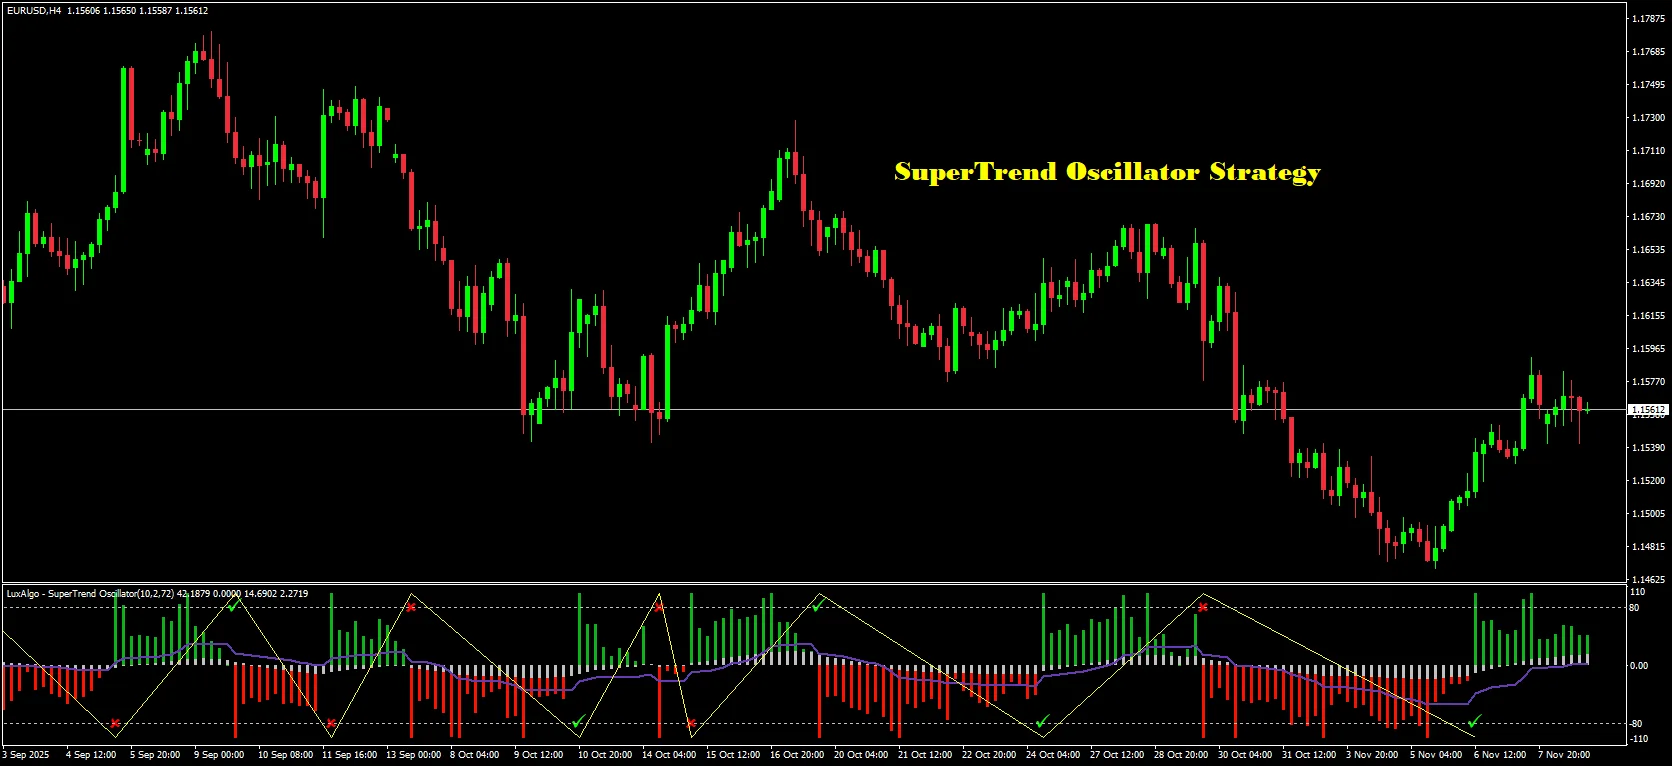
Below is a simple, rules-based strategy built for Forex pairs on MT4/MT5, but the logic works on indices and crypto too. The idea:
Use the SuperTrend Oscillator to define trend, wait for a mid-zone pullback, then enter when momentum re-aligns and the histogram confirms.
Step 1 – Choose Timeframes
- Higher-timeframe trend filter: H4 or H1
- Entry timeframe: M15, M30, or H1
Example:
- Trade entries on M15
- Confirm larger trend with the H1 SuperTrend Oscillator
Step 2 – Define the Higher-Timeframe Bias
On the higher timeframe (e.g. H1):
- Bullish bias:
- Main oscillator above 0
- Ideally above +20 for a clear slope
- Bearish bias:
- Main oscillator below 0
- Ideally below –20
You only trade with this bias on your entry timeframe.
Step 3 – Wait for a Pullback on the Entry Timeframe
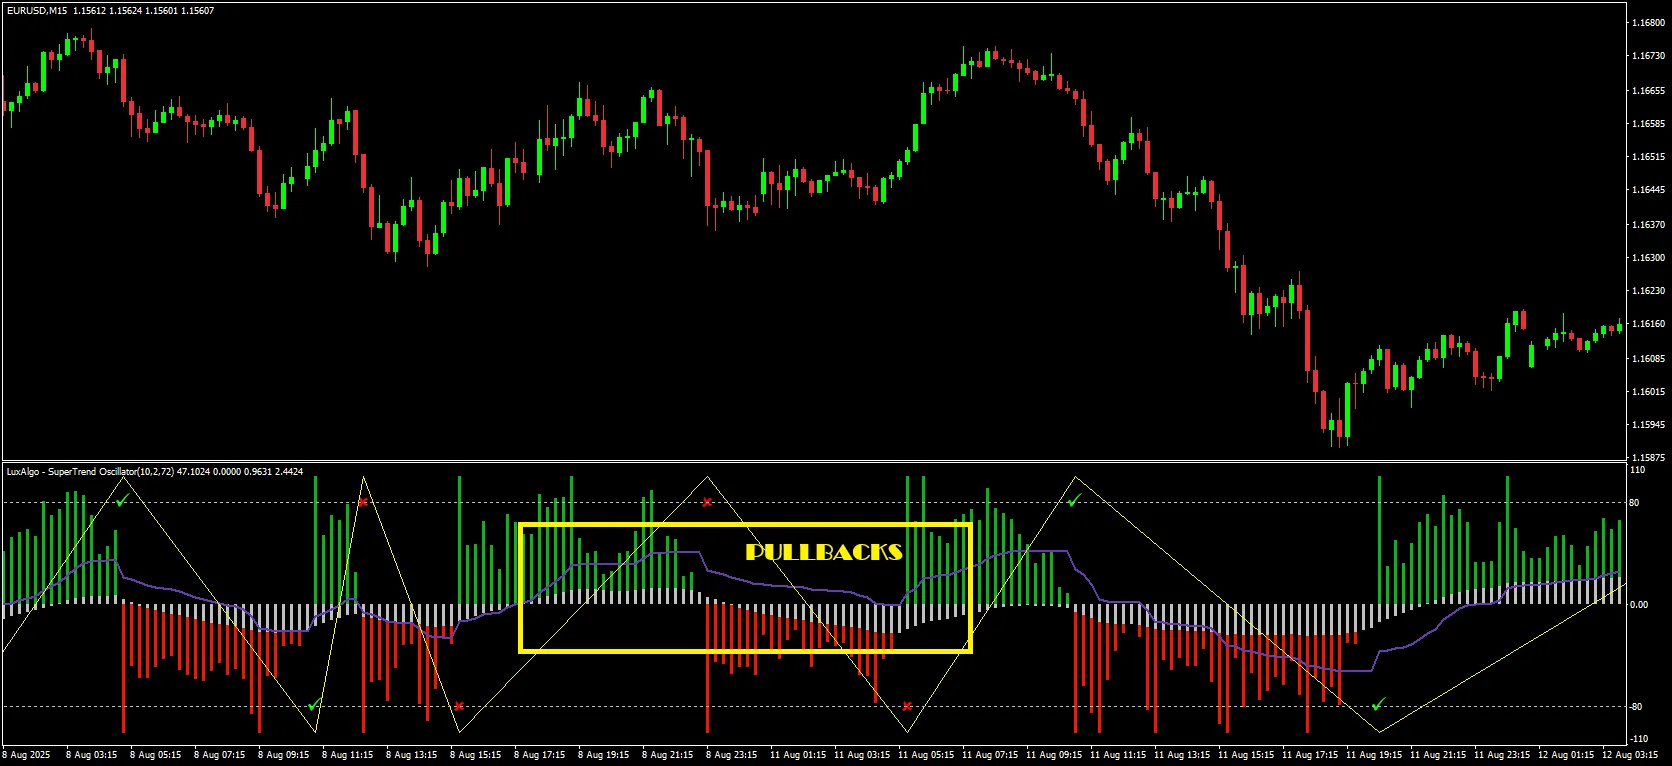
On your entry chart (e.g. M15):
For long setups:
- Higher-timeframe bias is bullish
- On M15, the main oscillator has been:
- Above 0 previously (trend in place), then
- Dips back into the +50 to –20 zone (shallow pullback) without spending much time far below –20
For short setups:
- Higher-timeframe bias is bearish
- On M15, the main oscillator:
- Was below 0, then
- Pulls back into the –50 to +20 zone
Think of this as the “discount / pullback” phase inside a larger trend.
Step 4 – Entry Trigger with Histogram Confirmation
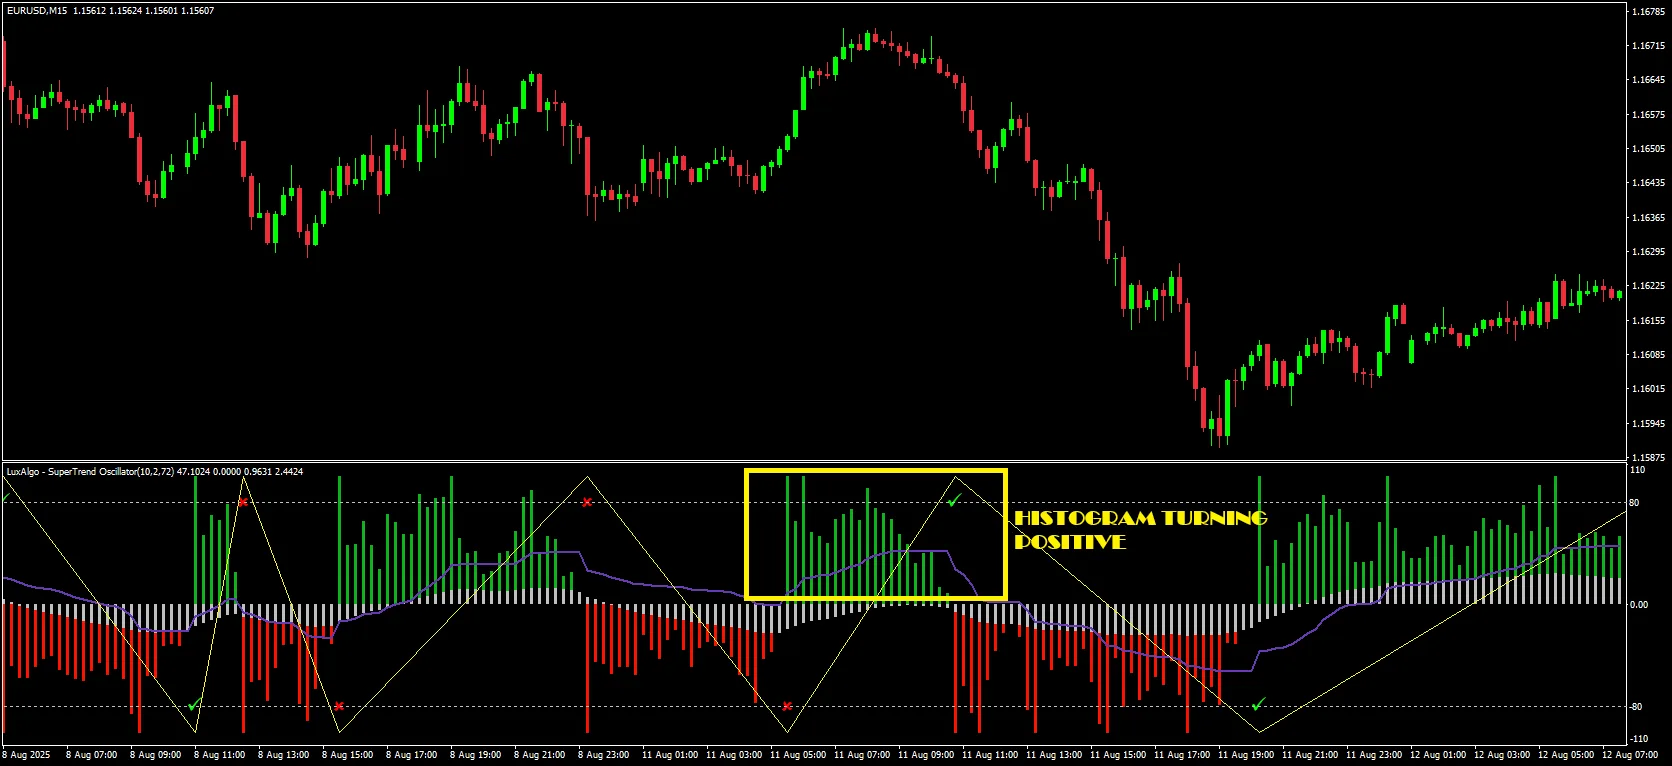
Long entry rules
Once the pullback is visible:
- Wait for the main oscillator to cross back above 0 on the entry timeframe.
- Confirm that the histogram turns positive (same sign as the main).
- Ideally, the last SuperTrend signal on the chart is marked with a checkmark rather than a cross.
- Enter long at the close of that confirmation candle.
Short entry rules
Mirror of the above:
- Main oscillator crosses below 0 after a pullback.
- Histogram turns negative.
- Recent SuperTrend signal on the chart was validated (checkmark).
- Enter short at candle close.
This way you:
- Trade in trend direction
- Enter only after a controlled pullback
- Use the histogram and false-signal logic to filter weak flips
Step 5 – Stop Loss and Trade Management
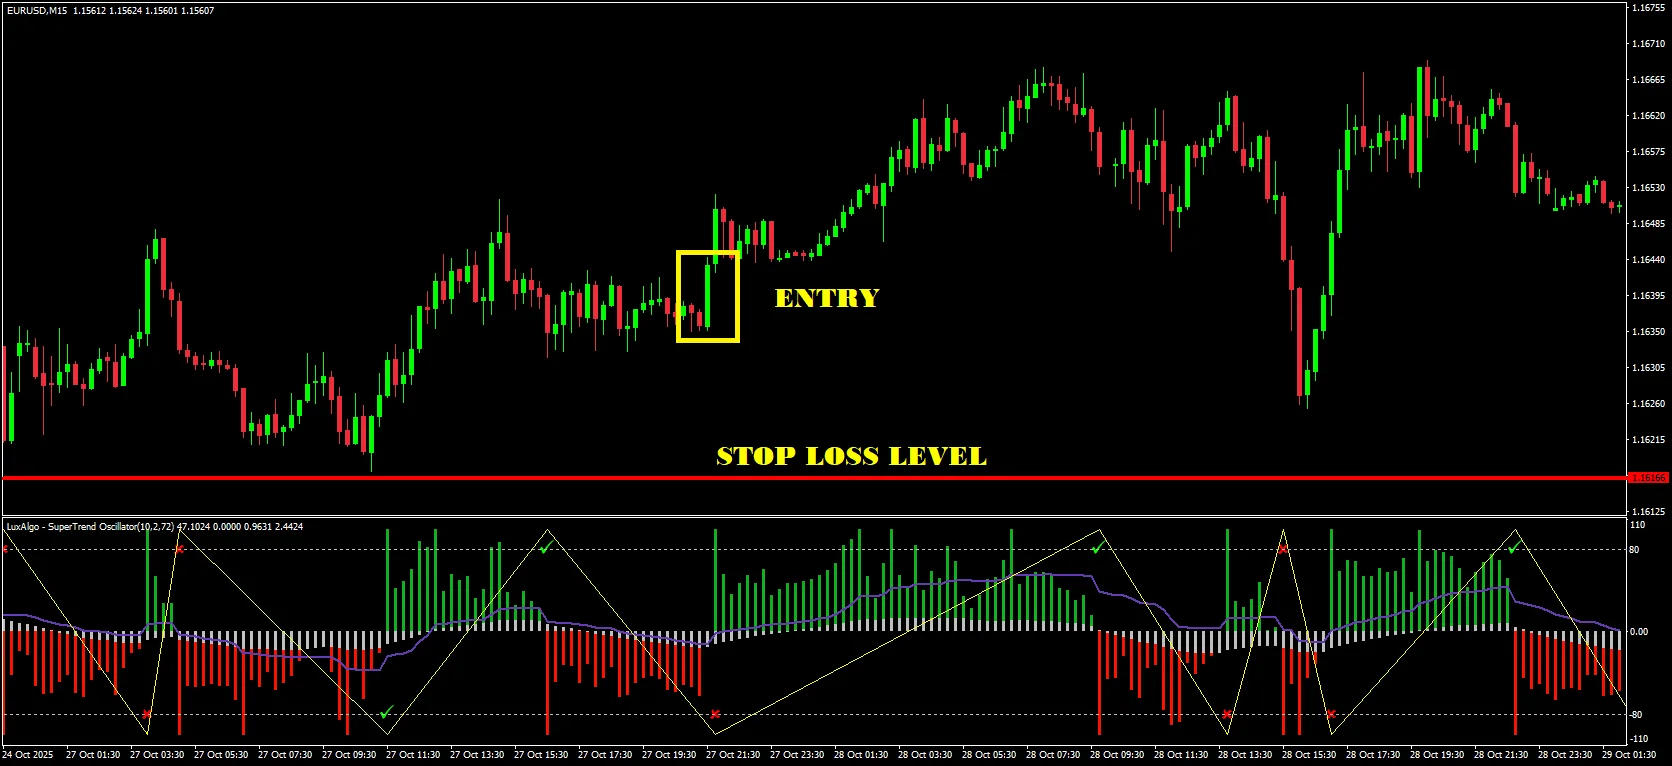
Initial stop-loss:
- Conservative approach:
- Place SL just beyond the underlying SuperTrend line or beyond the recent swing high/low.
- Faster approach:
- Use a multiple of ATR (e.g. 1.5–2 × ATR(10)) beyond entry.
Risk per trade:
- Keep risk 0.5%–1% of account per trade for swing/intraday, especially when testing.
Trade management:
- Once price moves 1R in your favor, consider:
- Moving SL to breakeven, or
- Scaling out partial size and letting the rest run.
Step 6 – Exit Rules Using the Oscillator
You can exit using the same tool that got you in:
For longs:
- Take partial or full profits when:
- Main oscillator climbs into +80 to +100 (extended trend zone), or
- Main oscillator crosses back below 0, or
- Histogram flips negative and stays negative for 2–3 candles.
For shorts:
- Mirror logic:
- Main oscillator hits –80 to –100, or
- Crosses back above 0, or
- Histogram turns positive for several candles.
Alternative: trail your stop behind the SuperTrend line itself; exit when price closes on the opposite side.
When the SuperTrend Strategy Works Best
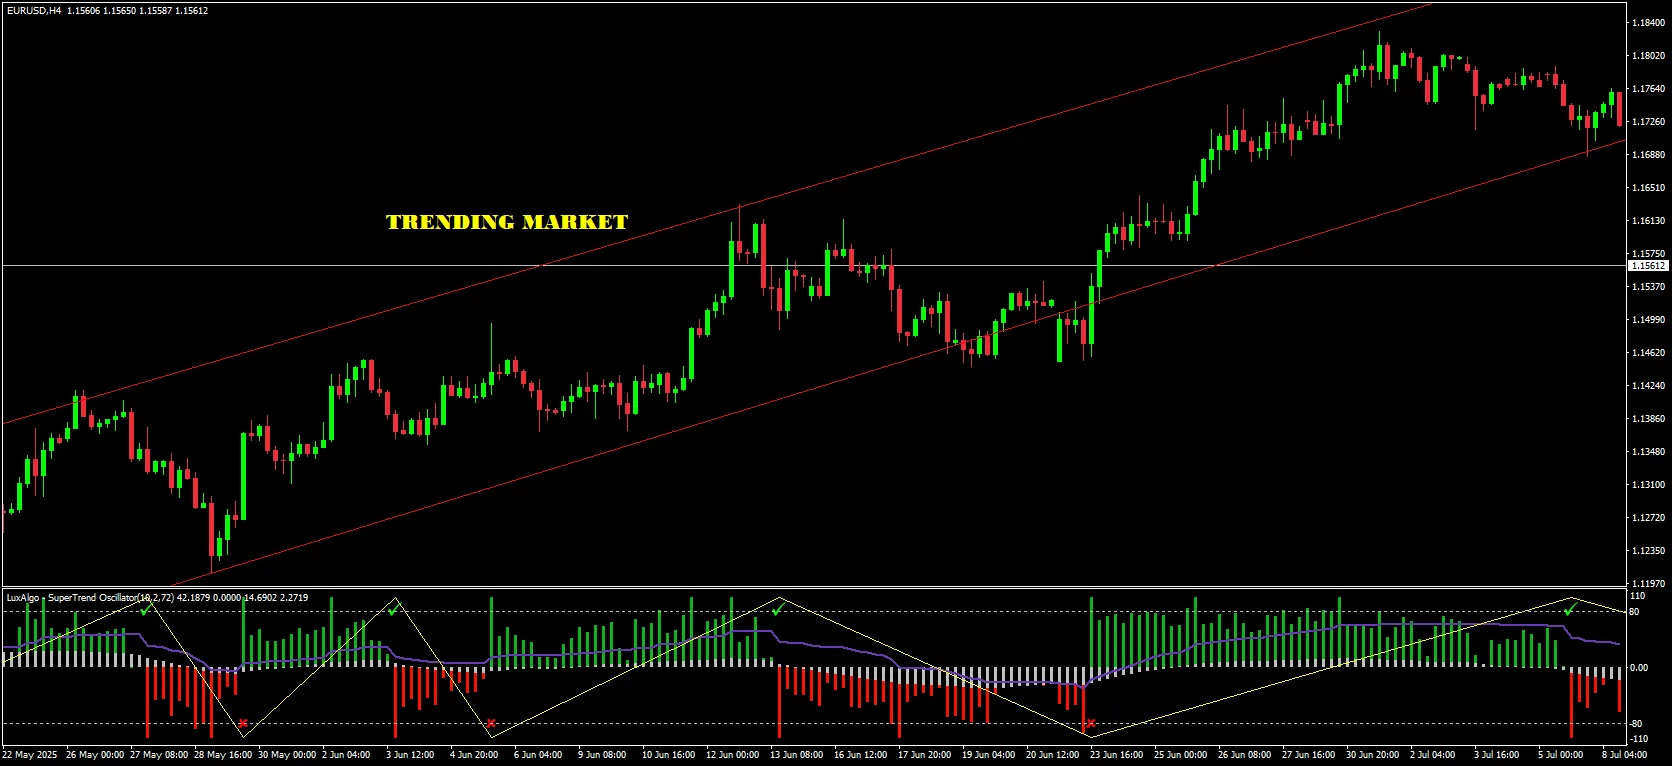
This SuperTrend Strategy is at its strongest when:
- Markets are trending cleanly (London/NY sessions, volatile pairs, strong macro moves).
- You combine it with basic structure:
- Support/resistance
- Session highs/lows
- Breakouts from well-defined ranges
You should be more selective when:
- The oscillator whipsaws tightly around 0 with tiny ranges.
- The false-signal percentage shown by the indicator is unusually high over your visible history.
In those conditions, consider:
- Moving up a timeframe
- Increasing Length / Mult
- Or simply skipping that market until volatility normalizes
Advanced Tips: Combining SuperTrend Oscillator With Other Tools
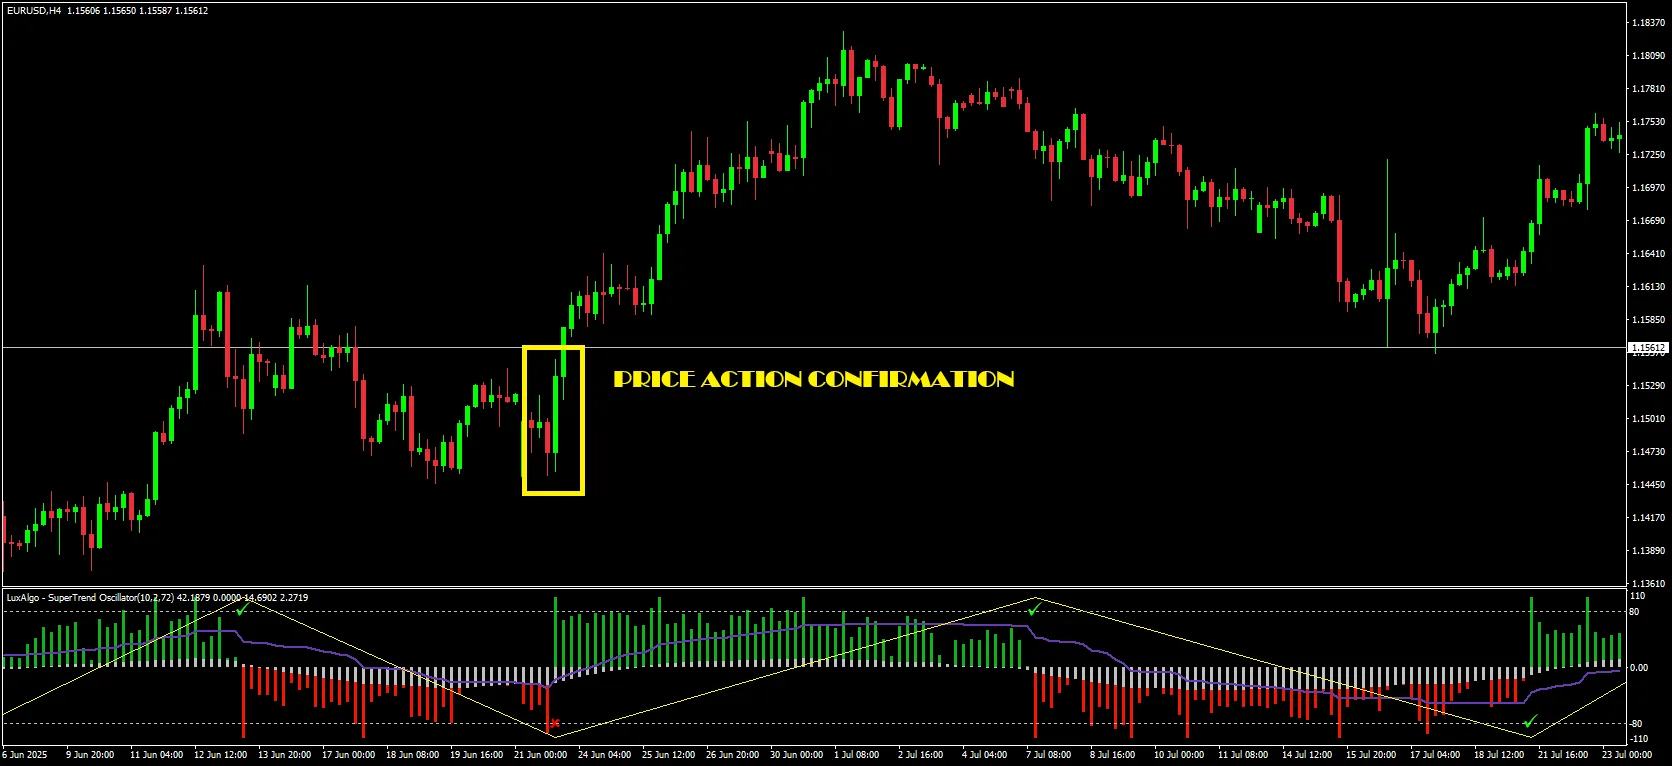
You can enhance the base strategy with order blocks:
- Price action filters
- Only take long entries after a bullish engulfing or a break of a minor high.
- Only take shorts after clear lower-high structure.
- Volume or session filters
- Focus on the main liquid sessions (London, New York).
- Avoid low-volume chop where oscillators tend to fake out.
- Confluence with the base SuperTrend line
- Use the SuperTrend line on the chart as:
- Dynamic support/resistance
- A trailing stop
- A visual confirmation that matches your oscillator bias
- Use the SuperTrend line on the chart as:
Final Thoughts + Download
The SuperTrend Oscillator indicator for MT4/MT5 is basically a “SuperTrend control panel” in one window. It tells you:
- Direction (above/below 0)
- Strength (how close it is to ±100)
- Pullbacks (mid-zone swings)
- Reliability (histogram alignment + false-signal stats)
Used with a simple trend–pullback–confirmation framework and sensible risk management, it can help you ride cleaner moves and ignore a good chunk of fake SuperTrend flips.
To put this strategy to the test:
may i know where to download the indicators ?
I found it ! sorry for my mistake ..