

The Bollinger Bands Trader is a free mean reversion indicator developed for MetaTrader 4 (MT4) by Trade Code Labs (TCL). Unlike standard Bollinger Bands implementations that simply plot bands and leave interpretation to the trader, this indicator functions as a complete “Strategy-in-a-Box” combining dual deviation Bollinger Bands, RSI exhaustion filters, and a multi-factor trend filter to generate high-probability reversal signals with built-in trade management.
The core problem it addresses is a familiar one: traders blindly buying when price touches the lower Bollinger Band, only to watch it continue falling, a scenario commonly known as “catching a falling knife.” This article provides a technical overview of the indicator’s logic, its dual layer entry system, settings, and a download link.
How the Bollinger Bands Trader Works: The Algorithm Behind the Signals
The Bollinger Bands Trader indicator builds on the well established statistical concept of mean reversion, the tendency of price to return to its average after extreme moves. Standard Bollinger Bands (20-period SMA with 2.0 standard deviation) are widely used to identify these extreme price levels, but they suffer from a critical flaw: during sustained trends, price can “ride the bands” for extended periods, generating signal after signal that all fail. This is the same overextension problem that the Mean Reversion Indicator addresses from a purely mathematical perspective, but the Bollinger Bands Trader takes it further with a multi-layered filtering approach.
This indicator solves that problem through a layered filtering approach that gates every potential signal through multiple checks before it appears on the chart.
- Dual-Deviation Bollinger Bands – The indicator plots two sets of bands simultaneously. The standard 2.0 deviation band identifies normal overextension, while the 3.0 deviation band marks rare, statistically extreme (3-sigma) price events. This creates two distinct entry tiers for different risk appetites. The concept of dual layer band systems is also explored in tools like the TCL Adaptive Super Bands, which uses an advanced EWMA volatility model with ADX/R² regime filtering to dynamically adjust band width.
- RSI Exhaustion Filter – Band touches alone are not sufficient to trigger a signal. The indicator requires RSI confirmation that momentum is genuinely overextended, a concept similar to what the TCL Super RSI does with its auto adaptive RSI engine and 3 zone dynamic coloring for overbought and oversold territory. This reduces false signals from shallow pullbacks that merely graze the bands.
- Multi-Factor Trend Filter – The core differentiator. Before any signal is allowed on the chart, the indicator runs a three part background check using a 50-period EMA (directional bias), RSI at 14 periods (momentum validation, above 55 for uptrend, below 45 for downtrend), and MACD (12, 26, 9) for volume pressure confirmation. If all three confirm a “Super-Trend,” counter-trend signals are automatically blocked.
- Dynamic Take-Profit System – Rather than a fixed pip target, the take-profit level dynamically adjusts to the Middle Band (20 SMA). As the market moves, the target moves with it, ensuring exits align with the statistical mean, the natural endpoint of a reversion move.
The Bollinger Bands Trader can be used on any Forex currency pair and other assets such as stocks, commodities, cryptos, precious metals, oil, gas, etc. It can also be used on any time frame that suits you best, from the 1-minute to the 1-month charts.cious metals, oil, gas, etc. It can also be used on any time frame that suits you best, from the 1-minute to the 1-month charts.
Core Features of the Bollinger Bands Trader
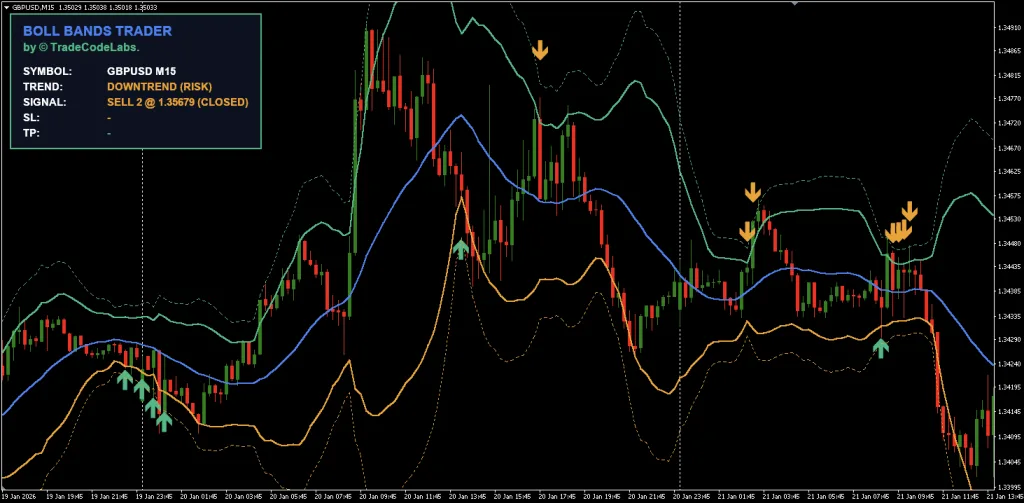
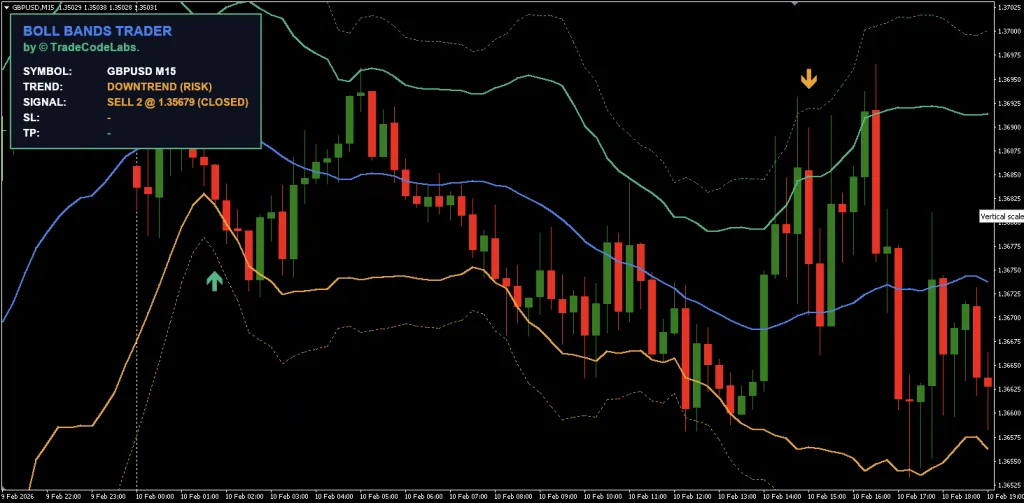
- Non-Repainting Signal Arrows – Signal arrows appear when price touches the band and the RSI condition is met. The live dashboard locks the signal once confirmed on the current bar to prevent flickering or repainting.
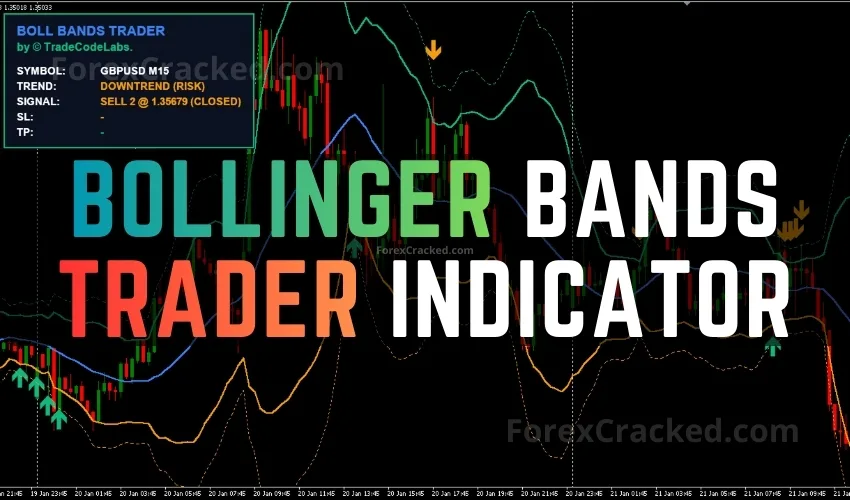
- On-Chart Strategy Dashboard – Displays trend filter status, signal level, calculated stop loss, and dynamic take-profit in real time directly on the chart.
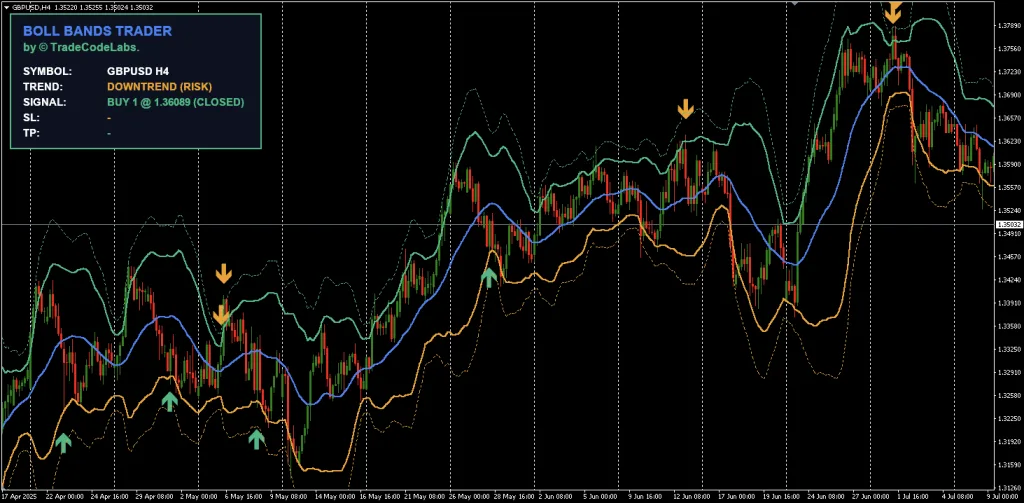
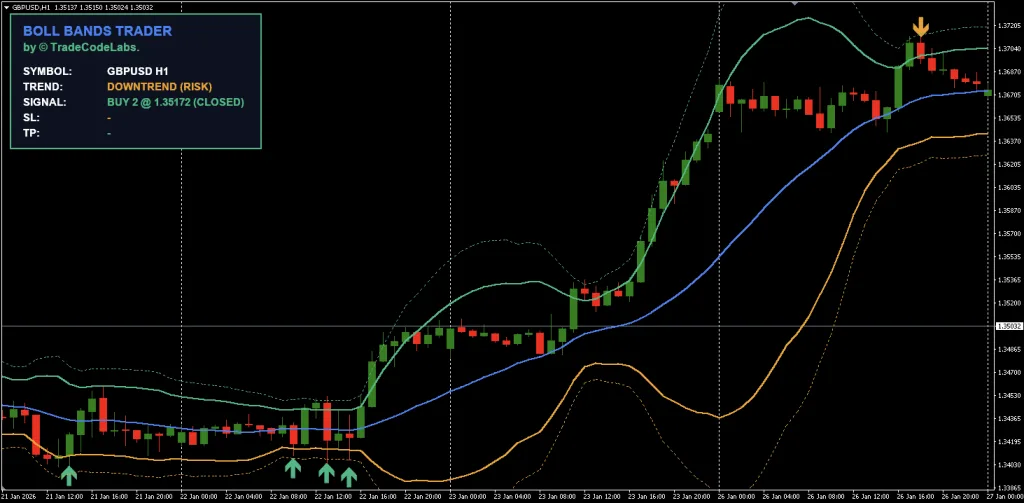
- Dual-Deviation Bands – Two layers of Bollinger Bands (2.0 and 3.0 standard deviations) plotted simultaneously for tiered entry management.
- Dynamic Take-Profit – TP level auto adjusts to the Middle Band (20 SMA), moving with the market to target the statistical mean.
- Multi-Factor Trend Filter – Three metric background check (EMA + RSI + MACD) blocks dangerous counter-trend signals during strong moves.
- Universal Asset Compatibility – Works on all forex pairs, metals (XAUUSD), indices, commodities, and cryptocurrencies available in MT4.
- All Timeframes – From M1 scalping to Monthly position trading.
- 100% Free – No premium tier, no locked features, no trial period. The full indicator is available for free download from TradeCodeLabs.
Signal Levels: Level 1 vs Level 2 Entry System
One of the distinguishing features of the Bollinger Bands Trader is its dual layer signal system, designed to support professional grade position management.
Signal Level 1 (Standard Entry)
Triggered when price pierces the 2.0 Standard Deviation band AND the RSI exhaustion condition is met. This is the primary entry signal for normal volatility conditions. Level 1 signals are heavily filtered by the trend engine, they will only appear when the trend filter confirms the reversal is likely valid.
Signal Level 2 (Extreme Entry)
Triggered when price stretches further to the 3.0 Standard Deviation band. These represent rare, 3 sigma statistical events, extreme overextension that carries a very high probability of reversion. Traders familiar with the CHT Value Chart Indicator will recognize the concept of identifying “extreme value” zones where price has deviated far from fair value. Level 2 signals are particularly useful for two scenarios:
- Scaling in – If you already entered on a Level 1 signal and price continues to stretch, a Level 2 signal provides an opportunity to add to the position at a statistically superior price.
- Aggressive sniper entries – Some traders prefer to wait exclusively for Level 2 signals, accepting fewer trades in exchange for higher probability setups.
Pro Tip: The recommended approach is to use Level 1 as your primary entry, then add to the position if price stretches to Level 2. This “scaling in” method gives you a better average entry price while the 3 sigma level statistically has a very high reversion probability. When scaling in, proper position sizing is critical to prevent overexposure.
Settings and Customization
The Bollinger Bands Trader provides several configurable parameters that allow traders to adjust the indicator’s behavior:
- Enable Trend Filter – The most critical setting. When set to
true(default), the indicator blocks counter trend signals during strong trends. Set tofalseto see all band touches regardless of trend direction, useful for ranging markets or manual analysis, but increases the risk of catching falling knives. - Bollinger Band Period – The lookback period for the moving average and standard deviation calculation. Default is 20 periods, which is the industry standard established by John Bollinger.
- Inner Deviation (Level 1) – The standard deviation multiplier for Signal Level 1. Default is 2.0. Increasing this value narrows the trigger zone, producing fewer but more extreme signals.
- Outer Deviation (Level 2) – The standard deviation multiplier for Signal Level 2. Default is 3.0. This represents the extreme boundary for 3-sigma events.
- Stop Loss (Pips) – The fixed pip distance for the suggested stop loss displayed on the strategy dashboard. Adjust this based on the volatility of your trading instrument and timeframe. Tools like the Volatility Ratio V2 Indicator can help you gauge current market volatility when configuring this value.
- Trend Filter Parameters – The trend filter uses a 50 EMA, RSI 14, and MACD (12, 26, 9) internally. These are optimized defaults based on institutional conventions and do not require frequent adjustment for most trading conditions.
The relationship between the Inner and Outer deviation settings is important. Keeping a meaningful gap between the two (e.g., 2.0 and 3.0) allows the tiered entry system to function as intended. Setting them too close together defeats the purpose of having distinct entry levels.


Download a Collection of Indicators, Courses, and EA for FREE
How to Use the Bollinger Bands Trader
The indicator is designed as a complete trading system with a clear workflow:
- Step 1: Assess the Trend Filter Status – After attaching the indicator, check the on chart strategy dashboard. The trend filter will display whether the market is in a Super Trend (strong directional move), a neutral zone, or showing signs of exhaustion. This context determines which signals the indicator will allow.
- Step 2: Wait for a Signal Arrow – Do not anticipate signals. Wait for the indicator to plot a buy or sell arrow. Level 1 arrows indicate standard overextension, while Level 2 arrows mark extreme 3 sigma events. During a confirmed Super Trend, you will only see signals in the direction of the trend, counter trend entries are blocked.
- Step 3: Check the Strategy Dashboard – Once a signal appears, the on chart dashboard displays the suggested Stop Loss (based on your configured pip distance) and the Dynamic Take Profit level, which automatically adjusts to the Middle Band. This gives you a complete trade plan without manual calculation.
- Step 4: Execute and Manage the Trade – Enter the trade at the signal arrow. Place your stop loss at the dashboard suggested level. The take-profit target will move as the Middle Band shifts, so monitor the dashboard as the trade progresses.
- Step 5: Consider Scaling In – If you entered on a Level 1 signal and price continues to extend toward the Level 2 band, consider adding to your position. The combined average entry and the high reversion probability at the 3.0 deviation level can significantly improve the trade’s risk-to-reward ratio.
As with any technical indicator, its effectiveness improves when combined with other forms of analysis. Consider pairing the Bollinger Bands Trader with automatic support and resistance levels, candlestick patterns, or a multi-timeframe trend scanner like the TCL Trend Radar for additional confluence.
As a standalone indicator, its effectiveness often depends on how it’s combined with other tools or strategies. often depends on how it’s combined with other tools or strategies.
How the Trend Filter Protects You
Understanding the trend filter is crucial because it is the single biggest edge this indicator has over standard Bollinger Band tools.
The filter runs a three-part background check before allowing any signal:
- EMA Check (50 EMA) – Is price above or below the 50-period Exponential Moving Average? This establishes the baseline directional bias.
- RSI Validation (14-period) – Is RSI above 55 (for uptrend confirmation) or below 45 (for downtrend confirmation)? This ensures momentum supports the detected trend direction.
- MACD Confirmation (12, 26, 9) – Is the MACD histogram confirming volume pressure in the trend direction?
If all three conditions confirm a strong trend (Super Trend): Counter trend signals are completely blocked. This means during a market crash, you will NOT see buy signals at the lower band, protecting you from the “falling knife” scenario that destroys accounts.
If the conditions do NOT all align: The indicator treats the current market state as ranging or transitional, and allows reversal signals in both directions, precisely the conditions where mean reversion strategies perform best.
This intelligent filtering mechanism is what separates the Bollinger Bands Trader, developed by TradeCodeLabs, from conventional Bollinger Band indicators. Traders who want full control can disable the filter (Enable Trend Filter = false ), but doing so removes the primary safety mechanism.
Bollinger Bands Trader Indicator
A free MT4 Bollinger Bands indicator with built-in trend filter and dual-deviation entry system for high-probability mean reversion trades.
✓ Pros
- Built-in trend filter prevents counter-trend signals during
- Dual-deviation bands (2.0 and 3.0) support tiered entry strategies
- Dynamic take-profit auto-adjusts to the middle band
- On-chart strategy dashboard with SL/TP levels
✗ Cons
- MT4 only — no MT5 version currently available
- ean reversion strategies may underperform in strongly trending markets even with the filter
Summary
The Bollinger Bands Trader Indicator by Trade Code Labs delivers a well engineered approach to mean reversion trading. Its built-in trend filter addresses the most common failure point of Bollinger Band strategies, trading against strong trends. The dual deviation entry system and dynamic take profit add practical trade management that most free indicators lack.
FAQ: Frequently Asked Questions
false in the indicator settings to see every band touch regardless of trend direction. However, this removes the primary safety mechanism that prevents counter trend entries during strong moves.Conclusion
The Bollinger Bands Trader Indicator for MT4, developed by Trade Code Labs (TCL), offers a sophisticated yet accessible approach to mean reversion trading. Its three factor trend filter directly addresses the most dangerous failure mode of standard Bollinger Band strategies, catching falling knives during strong trends. The dual deviation entry system and dynamic take profit provide institutional grade position management in a free, no configuration required package. However, mean reversion strategies inherently underperform in extended trending markets, and no filter system is infallible. This indicator is best utilized as the core component of a broader strategy that includes additional confluence tools.
Impossible to automate = useless
(Error : cannot set timer)