

Introduction: Seeing “True Value” in a Distorted Market
Have you ever looked at a chart rocketing upwards and thought, “It’s too expensive to buy now,” only to see it go up another 100 pips? Or have you tried to buy a dip, only to realize the “dip” was actually the start of a crash?
The problem isn’t your eyes; it’s the chart. Standard candlestick charts show you Price, but not Value.
The CHT Value Chart V2.5.3, available for both MetaTrader 4 and MetaTrader 5, solves this by stripping away the trend. It presents price action in a “detrended” window, allowing you to see exactly when an asset is mathematically “Overpriced” or “Underpriced” relative to its recent history.
If you are a reversal trader or a “buy low, sell high” swing trader, this tool is your X-Ray vision.
What is the CHT Value Chart V2.5.3?
The CHT Value Chart is not a standard oscillator like the RSI or Stochastic.
- Stochastic flattens price into a percentage (0 to 100).
- CHT Value Chart plots actual Candlesticks in a separate window.
It uses a complex algorithm to calculate the “floating average” of the price, then plots how far the current candle is from that average.
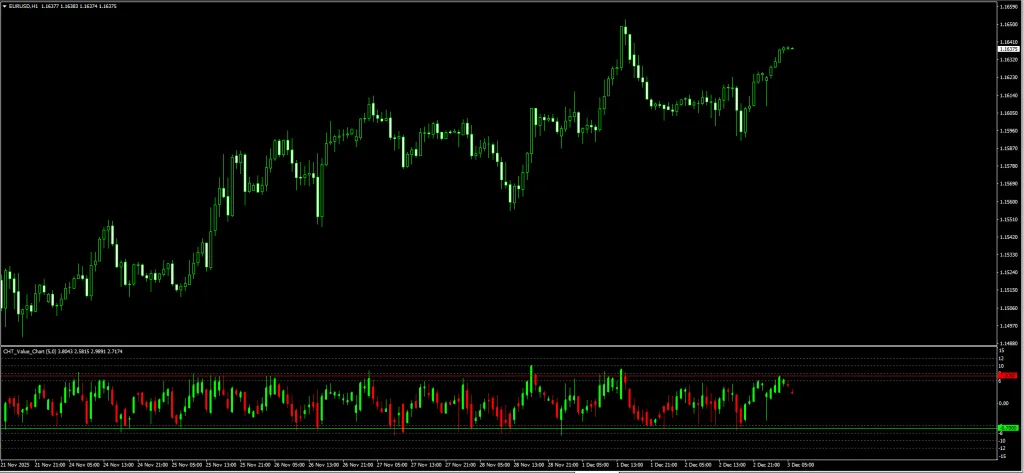
The Visuals:
- The Candlesticks: Inside the bottom window, you see Red (Bearish) and Green (Bullish) bars. These represent the volatility relative to value.
- The Zones:
- Upper Level (Red Line): Represents the “Overbought” zone (usually set to +6 or +8). Price is expensive here.
- Lower Level (Green Line): Represents the “Oversold” zone (usually set to -6 or -8). Price is cheap here.
The Logic: Markets act like rubber bands. When the CHT candles hit the upper or lower lines, the rubber band is stretched to its limit and is statistically likely to snap back.
Value Chart vs. RSI: Why Upgrade?
Many traders ask, “Why not just use RSI?”
| Feature | Standard RSI / Stochastic | CHT Value Chart |
| Data Shown | A single line (Line Graph) | Full Candlesticks (OHLC) |
| Reaction | Flattens/Hides volatility at extremes | Shows [Internal Link: Pin Bars] & Engulfing patterns inside the indicator |
| Speed | Often lags (waiting for close) | Instant visual of “Price Stretch” |
| Best For | General Momentum | Precision Reversal Entries |
Verdict: The CHT Value Chart is superior because it lets you use Price Action patterns directly within the oscillator window.
Review: Pros and Cons
Here are our honest test results after running this on MT4 and MT5 charts.
✅ PROS (The Good)
- Dual Platform: We love that the developer provides files for both MT4 and MT5.
- Detrended View: It helps you spot “divergence” much easier than standard charts.
- Universal: Works on everything from Crypto (Bitcoin) to Forex to Stocks.
- Pinpoint Entries: You enter exactly when the “Value Candle” touches the line, reducing drawdown.
❌ CONS (The Bad)
- The “Train Wreck” Risk: In a super-strong trend (like a market crash), the Value Chart will stay in the “Oversold” zone for a long time. Buying early here is dangerous.
- Learning Curve: Reading candlesticks in a sub-window takes some getting used to.
The Strategy: The “Value Trap” System
The biggest mistake traders make with this indicator is buying simply because the bar touched the Green Line. Do not do this. You will catch a falling knife.
To filter out fake signals, we need a Trend Filter. We will use the 200 Exponential Moving Average (EMA) on the main chart.
Setup & Settings
- CHT Value Chart V2.5.3: Default Settings (Levels +/- 8 are usually best for Volatility).
- 200 EMA: Applied to Close (Main Chart).
- Timeframe: H1 or H4 (Highest accuracy).
1. The “Value” Buy Setup
We want to buy cheap assets, but only when the long-term trend is UP.
- The Filter: Price on the main chart must be ABOVE the 200 EMA.
- The Setup: Wait for price to pull back (dip).
- The Trigger: Look at the CHT Value Chart window. A Value Candle must touch or pierce the Lower Green Line (Oversold).
- The Confirmation: Wait for that candle to close. Ideally, it should leave a wick (tail) at the bottom, showing rejection.
- Entry: Buy at the open of the next candle.
- Stop Loss: Below the recent swing low.
- Take Profit: Target the 200 EMA or the Upper Red Line on the Value Chart.
2. The “Value” Sell Setup
We want to sell expensive assets, but only when the long-term trend is DOWN.
- The Filter: Price on the main chart must be BELOW the 200 EMA.
- The Setup: Wait for price to rally (bounce).
- The Trigger: Look at the CHT Value Chart window. A Value Candle must touch or pierce the Upper Red Line (Overbought).
- The Confirmation: Wait for the candle to close. Look for a wick at the top.
- Entry: Sell at the open of the next candle.
- Stop Loss: Above the recent swing high.
- Take Profit: Target the 200 EMA or the Lower Green Line.
Pro Tip: If the CHT Value Candle is a massive “Marubozu” (no wicks) pushing through the line, WAIT. Momentum is too strong. Wait for a smaller candle or a reversal shape before entering.
Indicator Settings: MT4 vs MT5
When you install the indicator, the inputs are generally the same for both platforms.
- Period (Default: 5):
- This controls how many candles are used to calculate “Value.”
- Tweak: Keep it at 5 for Scalping. Increase to 10 or 14 for Swing Trading to reduce noise.
- Overbought / Oversold Levels:
- Default: Often set to roughly 7 or 8.
- Tweak: If you are getting too many signals, widen the gap (e.g., set to 9 and -9). If you aren’t getting enough signals, narrow it (e.g., 6 and -6).
How to Install (MT4 & MT5)
Since we provide both versions, ensure you install them in the correct folders.
For MT4:
- Download the .ex4 file.
- Go to File > Open Data Folder > MQL4 > Indicators.
- Paste the file.
For MT5:
- Download the .ex5 file.
- Go to File > Open Data Folder > MQL5 > Indicators.
- Paste the file.
Restart your terminal after pasting!
FAQ: Frequently Asked Questions
Q: Can I use the MT4 version on MT5?
A: No. MT4 uses MQL4 language, and MT5 uses MQL5. They are not compatible. Make sure you download the correct file for your platform from the links below.
Q: Does the CHT Value Chart repaint?
A: The “Value” bars behave like normal candles. They move while the timeframe is active. Once the candle closes, the High, Low, Open, and Close of that Value Bar are fixed. It does not repaint historical data.
Q: Why is my Value Chart empty?
A: This sometimes happens if your history data is incomplete. Right-click your chart, select “Refresh,” or switch timeframes to force it to reload.
Final Verdict: Is it Worth Using?
CHT Value Chart V2.5.3 Indicator
Summary
The CHT Value Chart V2.5.3 is a professional-grade tool often kept secret by institutional traders. Visualizing the Price Stretch allows you to fade the crowd with confidence.
Whether you use MT4 or MT5, adding this to your chart gives you a significant edge, provided you use the 200 EMA filter we described to keep you on the right side of the trend.