

Finding the exact moment to enter a trade is often the most challenging aspect of technical analysis. While many traders can correctly identify the overall trend, mistiming the entry can lead to unnecessary drawdowns or stopped-out positions.
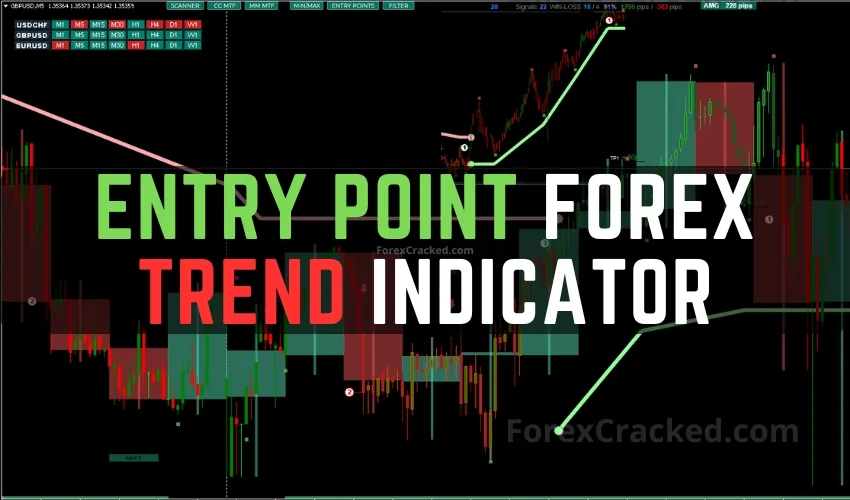
The Entry Point Forex Trend Indicator is a technical tool designed to solve this specific problem by automating market structure analysis. Rather than relying on lagging indicators alone, this system attempts to replicate “human-like” price action analysis identifying impulses, pullbacks, and breakouts in real-time.
In this review, we analyze the indicator’s logic, its reliability, and how to download it for your own trading setup.
How It Works: The Algorithm Behind the Entry Point Indicator
Unlike standard moving average crossovers, the Entry Point Indicator evaluates market data by analyzing individual candlesticks. It categorizes price action into impulses (strong moves) and corrections (pullbacks).
The core algorithm is built on the principle of Market Structure:
- Bullish Scenario: It looks for a “Rise → Pullback → Rise” sequence.
- Bearish Scenario: It looks for a “Fall → Pullback → Fall” sequence.
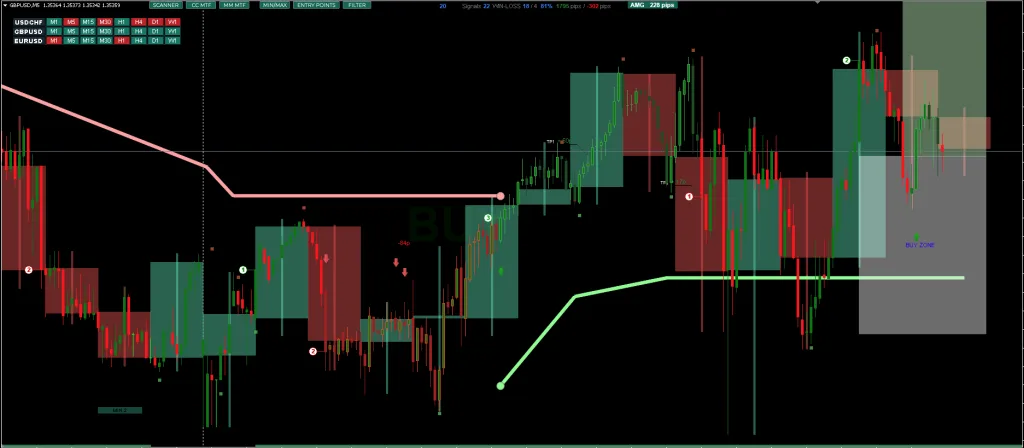
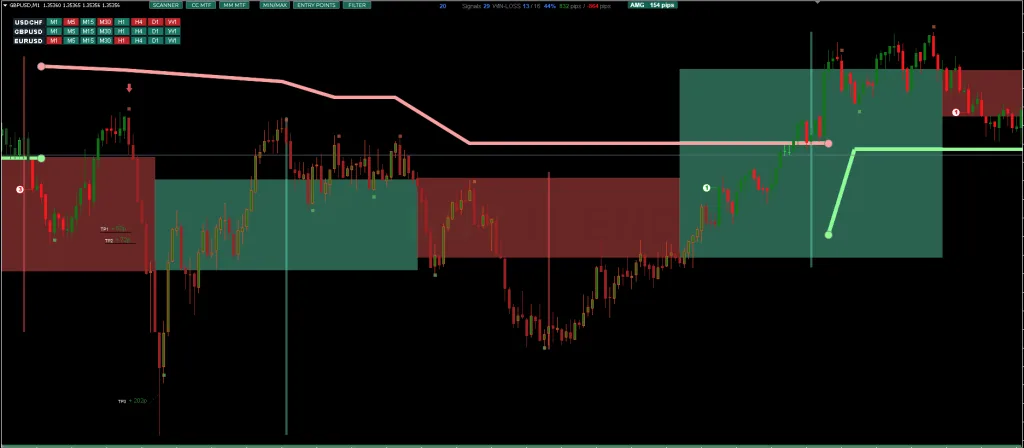
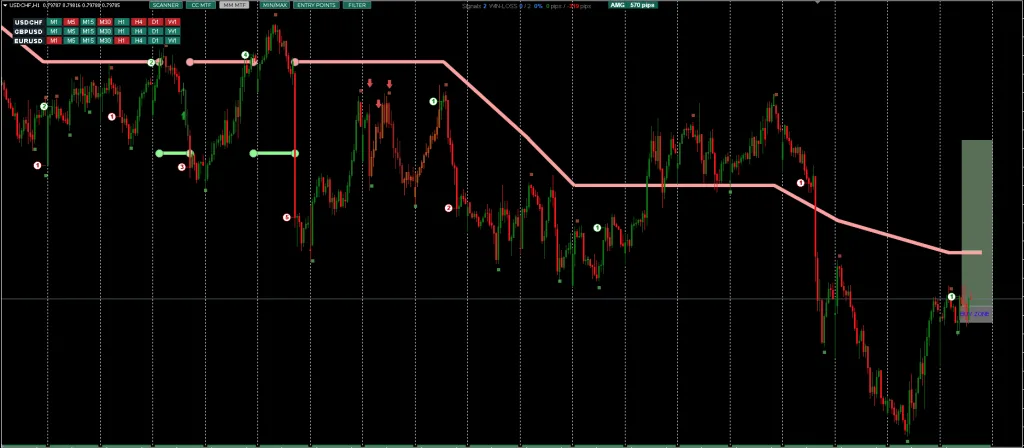
By detecting these sequences, the indicator attempts to identify Highs and Lows with high precision. It then plots visual aids, such as arrows and candle coloring, to signal when a specific market structure has been broken, suggesting a high-probability entry point.
Forex Trend Indicator can give you trading signals you can take as they are or add your additional chart analysis to filter the signals further, which is recommended. While traders of all experience levels can use this system, practicing trading on an MT4 demo account can be beneficial until you become consistent and confident enough to go live.
This Entry Point Indicator is straightforward. Even a complete beginner can start trading and making profits with this system. You can set it to send you a signal alert via Mobile Notification, platform pop-ups, and Email. This is helpful as it means you do not need to stare at the charts all day, waiting for signals to appear, and you can monitor multiple charts simultaneously.
The Forex Trend Indicator can be used on any Forex currency pair and other assets such as stocks, commodities, cryptos, precious metals, oil, gas, etc. It can also be used on any time frame that suits you best, from the 1-minute to the 1-month charts.
Trading Strategy – Best Practices
While the indicator can be used “out of the box,” professional traders rarely rely on a single tool. To maximize the effectiveness of the Entry Point Indicator, we recommend the following confluence strategy:
- Step 1: Check the Trend Scanner Before looking for entries, glance at the dashboard. Ensure the higher timeframes (e.g., H4 or Daily) align with your intended trade direction.
- Step 2: Wait for the Signal Wait for the indicator to plot an entry arrow (Buy or Sell).
- Note: Do not enter immediately if the candle is still open. Always wait for the Bar Close to confirm the signal is valid.
- Step 3: Volume or Price Action Confirmation (Recommended) Filter false signals by checking for a supportive candlestick pattern (like an Engulfing Bar) or increased volume. The developers also suggest pairing this with support/resistance tools to avoid buying into resistance or selling into support.
- Step 4: Execute and Manage Risk Place your Stop Loss at the indicator’s suggested zone (or the recent swing low/high). Target a minimum Risk-to-Reward ratio of 1:1.5.


Download a Collection of Indicators, Courses, and EA for FREE
Core Features of Forex Trend Indicator
The Forex Trend Indicator offers several functions aimed at assisting both novice and experienced traders, including:
- Non-Repainting Signals at Bar Close – The trend scanner indicator provides entry signals that do not adjust after the bar closes. This can assist in decision-making consistency.
- Trend Direction Tracking across Timeframes – A multi-timeframe (MTF) mode allows users to view major support/resistance areas and correction zones from higher intervals.
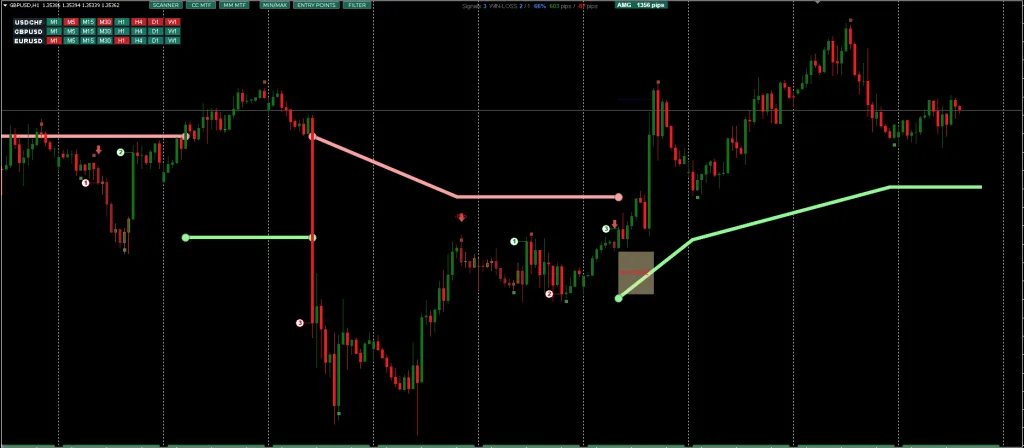
- Stop Loss and Take Profit Visualization – The tool displays proposed buy and sell zones, with dynamic stop-loss adjustment features to manage trade risk.
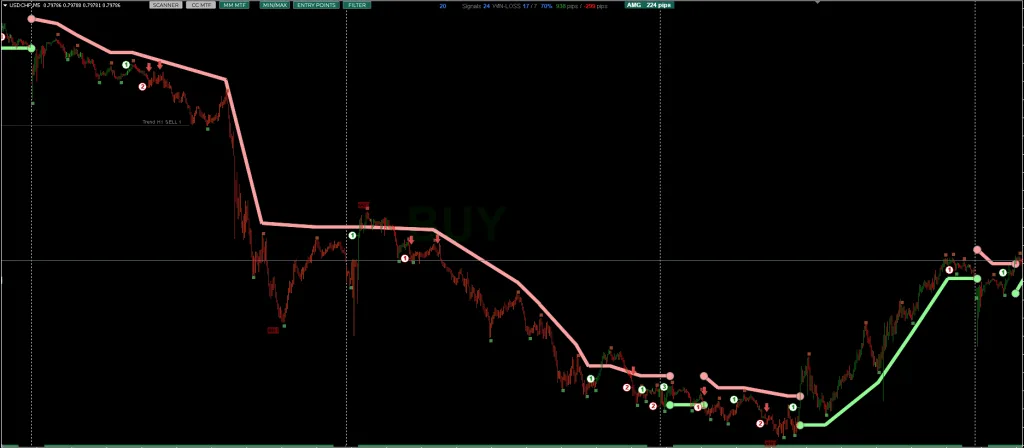
- Risk-To-Reward Visualization – Trend continuation or reversal signals are supported with visual elements like colored candles to represent a trade’s expected trajectory.
- Statistical Feedback – The software includes trade outcome statistics, such as win rates and profit tracking based on historical signal performance.
- Alert System – Includes push notifications, email alerts, pop-ups, and sound cues intended to keep traders updated in real-time.
- Asset Compatibility – Works on various markets beyond forex, including cryptocurrencies, metals, indices, and stocks.
The indicator is also promoted as being compatible with automated systems and expert advisors, potentially beneficial for those developing algorithmic trading setups.
Additional Tools and Integration
For enhanced functionality, the developers recommend using the Entry Point Indicator alongside the RFI LEVELS Indicator, though detailed documentation on how both tools integrate is limited in the overview.
The tool also includes a “trend scanner” – a compact interface designed to notify traders when multiple timeframes align in the same direction, potentially signaling a strong trend. This is intended to help reduce the time needed to monitor different instruments manually.
Updated on 2025/11/30
Conclusion of Trend Scanner
Overall, the Trend Scanner Indicator is positioned as a multi-functional tool intended to simplify trend and entry point detection through automation and visualization. While its effectiveness may vary depending on the market context and user experience, it can be viewed as a supportive option among many available indicators in a trader’s toolkit. Downloading and testing it on a demo or practice account could help determine how well it aligns with individual trading styles and strategies.