

Introduction: The “Big Picture” Advantage
The #1 reason traders fail is “Tunnel Vision.” They stare at the M15 chart, see a buy signal, and jump in, completely ignoring that the H4 Daily trend is crashing down.
The MTF (Multi-Timeframe) MACD Bars Indicator solves this instantly.
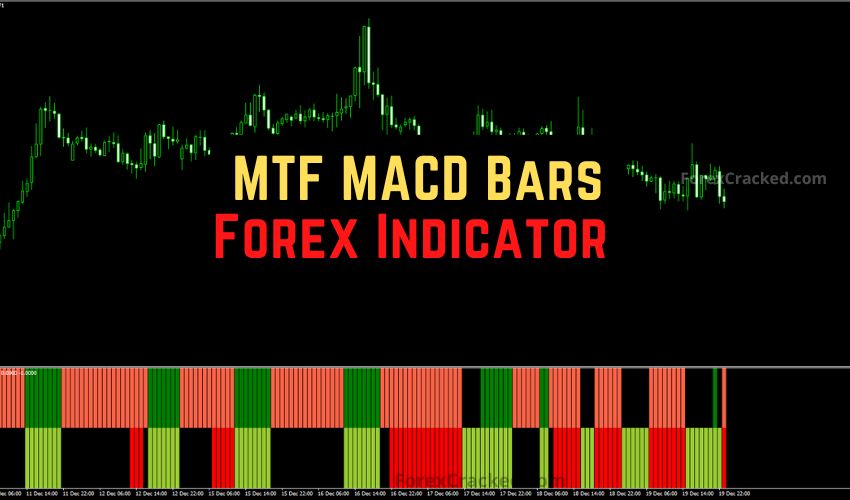
Instead of switching back and forth between charts (which is annoying and confusing), this tool displays the trend momentum of a Higher time frame right underneath your current price candles. It converts the complex lines of the standard MACD into a simple, color-coded Bar Histogram.
If you want to trade with the “Smart Money” flow, this indicator acts as your compass.
What is the MTF MACD Bars Indicator?
The MTF MACD Bars is a modified version of the classic Moving Average Convergence Divergence. Instead of showing you lines and histograms that take up space, it simplifies the data into a Dual-Color Bar System.
How to Read the Signals:
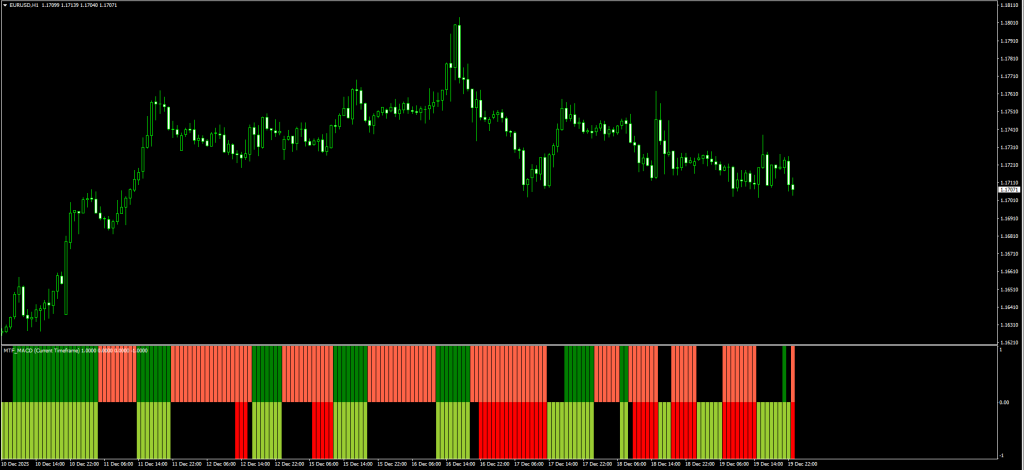
The indicator usually sits in a separate window and provides two key pieces of information:
- Trend Direction (Color):
- Green / YellowGreen: Bullish Trend (MACD is moving Up).
- Red / Tomato: Bearish Trend (MACD is moving down).
- Trend Alignment (Rows):
- Many versions of this indicator show two rows of bars.
- Top Row: Shows the signal from your Current Timeframe.
- Bottom Row: Shows the signal from a Higher Timeframe (e.g., H4 trend shown on an H1 chart).
The Logic: You only enter a trade when BOTH rows are the same color. This ensures you are never swimming upstream.
Review: Pros and Cons
Here are our honest test results after running this on trend-heavy pairs like GBP/JPY and Gold.
✅ PROS (The Good)
- Zero Tunnel Vision: Forces you to respect the higher timeframe trend.
- Visual Simplicity: No crossover lines to interpret, just “Red” or “Green.”
- Flexible: You can set it to show any timeframe (e.g., display the Daily trend on a 5-minute chart).
- Filters Noise: Keeps you out of choppy trades where the lower timeframe disagrees with the higher timeframe.
❌ CONS (The Bad)
- Lag: Like all MACD tools, it is a lagging indicator. You will not catch the exact top or bottom.
- Repaint Risk (MTF): Crucial Note: The bar for the Higher Timeframe will update as that higher candle forms. Always wait for the higher-timeframe candle to close before being 100% sure of the signal.


Download a Collection of Indicators, Courses, and EA for FREE
The Strategy: The “Trend Alignment” System
The sample strategy suggests buying when the bar turns Green. That is too risky. In a strong downtrend, you will get small Green bars (pullbacks) that immediately fail.
To rank this strategy among the best, we apply the “Dual-Confirmation” Rule.
Setup & Settings
- MTF MACD Bars Indicator:
- TimeFrame 1: Current (e.g., H1).
- TimeFrame 2: Higher (e.g., H4 or 240 minutes).
- 200 EMA: Trend Filter (Main Chart).
- Timeframe: M15 or H1 (Execution).
1. The “Aligned” Buy Setup
We only buy when the short-term momentum agrees with the long-term direction.
- The Filter: Price must be ABOVE the 200 EMA.
- The Setup: Wait for the price to pull back. The Top Row (Current TF) may turn Red temporarily.
- The Trigger: Wait for the Top Row to turn GREEN (YellowGreen) again.
- The False Check (Crucial): The Bottom Row (Higher TF) must already be GREEN.
- Rule: If the Bottom Row is Red, DO NOT BUY. The big trend is down.
- Entry: Buy at the candle’s close.
- Stop Loss: Below the recent swing low.
- Take Profit: Ride the trend until the Top Row turns Red.
Read More 200 EMA Multiple Chart Timeframe Forex Trading Strategy
2. The “Aligned” Sell Setup
We only sell when the floor drops out.
- The Filter: Price must be BELOW the 200 EMA.
- The Setup: Wait for a rally. The Top Row may temporarily turn Green.
- The Trigger: Wait for the Top Row to turn RED (Tomato) again.
- The False Check: The Bottom Row (Higher TF) must already be RED.
- Entry: Sell at the close of the candle.
- Stop Loss: Above the recent swing high.
- Take Profit: Ride the trend until the Top Row turns Green.
Pro Tip: The most explosive trades happen when the Top Row changes color to match the Bottom Row immediately after a pullback to the 200 EMA.
Read More Trend Following Profitable Forex Strategy FREE Download
Indicator Settings: How to Set the Timeframe
This is the tricky part for beginners. In the “Inputs” tab, you will often see a setting called TimeFrame or TF_Bar_2. You usually need to enter the number of minutes:
- M15 = 15
- H1 = 60
- H4 = 240
- Daily = 1440
Example: If you are trading on the H1 chart, set the indicator’s TimeFrame input to 240. This will show you H4 bars on your H1 chart.
How to Install (MT4 & MT5)
- Download the file from the link below.
- Open MetaTrader.
- Go to File > Open Data Folder.
- Navigate to MQL4 > Indicators.
- Paste the file.
- Refresh your Navigator list.
- Drag the MTF MACD Bars Indicator onto your chart, then set your desired time frames in the Inputs tab.
FAQ: Frequently Asked Questions
Why does the bottom bar change color sometimes?
This is because the Higher Timeframe candle hasn’t closed yet. For example, if you are on M15 and watching H1 bars, the H1 bar is still forming for four candles. Always wait for the higher timeframe close if you want to be conservative.
Can I use this for Scalping?
Yes. Set your chart to M1 or M5, and set the MTF MACD Bars Indicator to M15 or M30. This keeps you scalping in line with the 30-minute trend, which drastically increases your win rate.
What do “Tomato” and “YellowGreen” mean?
These are just the default MT4 color names. Tomato = Bearish (Red), YellowGreen = Bullish (Green). You can change them to standard Red/Green in the “Colors” tab.
Final Verdict: Is it Worth Using?
Score: 5/5 Stars ⭐⭐⭐⭐⭐
The MTF MACD Bars Indicator is an essential tool for any trader who struggles with patience. It literally paints a “Red Light” or “Green Light” on your chart based on the higher timeframe.
By forcing you to wait for the “Dual Green” or “Dual Red” alignment, it automatically filters out the low-probability choppy trades that drain your account.