

Introduction: A Hidden Momentum Tool That Actually Works
Most momentum indicators give you the same recycled signals. You slap on a MACD, wait for a crossover, and get stopped out because the signal came three candles too late.
The PAFX Secret Indicator takes a different approach.
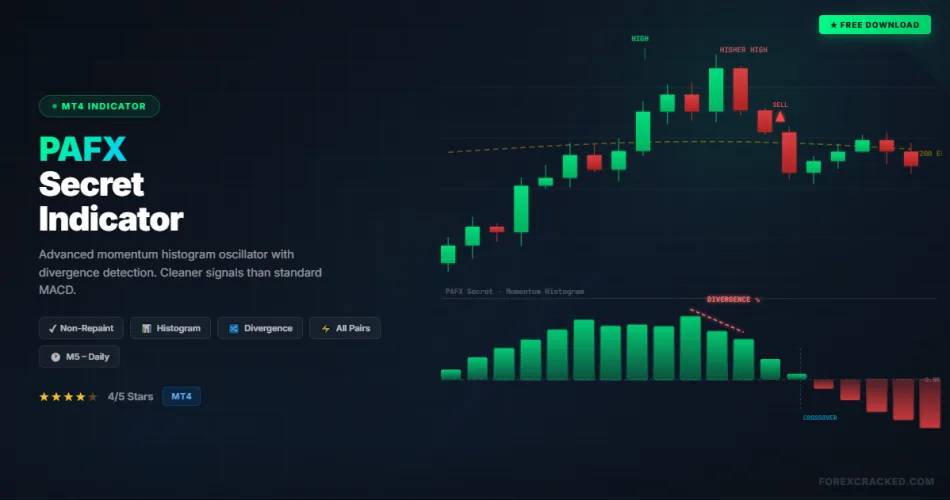
It is a histogram-based momentum oscillator for MetaTrader 4 that visually maps buying and selling pressure around a zero line — similar to the MACD histogram, but with cleaner signal separation and built-in divergence detection that most default tools lack.
If you are tired of cluttered charts and noisy signals, the PAFX Secret Indicator strips everything down to what actually matters: who is in control right now — buyers or sellers?
We tested it across multiple pairs and timeframes. Here is our honest review, a complete trading strategy, and a free download link.
What Is the PAFX Secret Indicator?
The PAFX Secret Indicator is a custom MT4 oscillator that displays momentum as a histogram in a separate sub-window below your price chart. It operates on the same core principle as the MACD measuring the difference between fast and slow momentum cycles — but presents the data in a more visually intuitive format.
How to read it:
- Upward bars (above zero line): Bullish momentum is in control. The market is pushing higher.
- Downward bars (below zero line): Bearish momentum is in control. The market is pushing lower.
- Bar height: The taller the bars, the stronger the momentum. Shrinking bars indicate momentum is fading — a potential reversal warning.
- Zero line crossover: When bars flip from below zero to above (or vice versa), it signals a momentum shift.
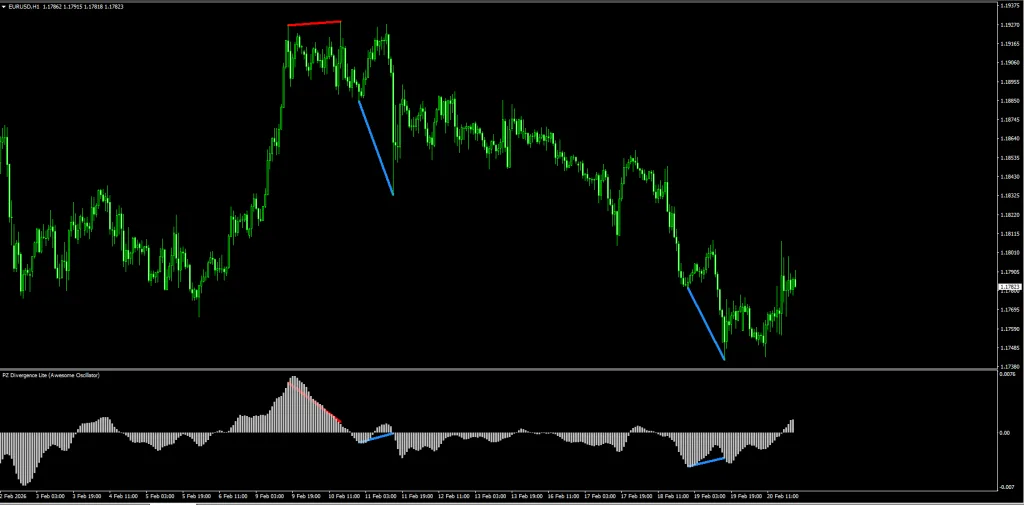
The real power of this indicator is divergence detection. When price makes a new high but the histogram makes a lower high, it signals hidden weakness — a classic bearish divergence setup. The same works in reverse for bullish divergence.
PAFX Secret Indicator vs. Standard MACD
Why use a custom indicator when MT4 has a built-in MACD? Here is why:
| Feature | PAFX Secret Indicator | Standard MACD |
|---|---|---|
| Visual clarity | ✅ Clean histogram, easy to read | ❌ Signal line overlap creates noise |
| Divergence spotting | ✅ Cleaner peaks/troughs for divergence | ⚠️ Possible but harder to see |
| False signals | ✅ Fewer whipsaws on higher TF | ❌ Frequent false crossovers |
| Customization | ✅ Adjustable periods | ✅ Adjustable periods |
| Repainting | ✅ Non-repainting | ✅ Non-repainting |
Verdict: If you already use the MACD and want cleaner momentum reads with easier divergence identification, the PAFX Secret is a direct upgrade.


Download a Collection of Indicators, Courses, and EA for FREE
Review: Pros and Cons
Here are our honest test results after running this indicator on EUR/USD, GBP/USD, and XAU/USD across M15 to Daily charts.
PROS (The Good)
- Clean Visual Output: The histogram is uncluttered and easy to interpret at a glance — no overlapping lines or confusing signal crossovers.
- Non-Repainting: Once a candle closes, the histogram bar is locked in. No redrawing of past signals.
- Excellent for Divergence: The smooth histogram peaks and troughs make divergence trading significantly easier compared to standard oscillators.
- Works on All Pairs and Timeframes: We confirmed functionality on forex majors, gold, and indices from M5 to Daily.
- Lightweight: Minimal CPU usage — will not slow down your MT4 even with multiple charts.
CONS (The Bad)
- Not a Standalone System: Like any momentum oscillator, using it alone without a trend filter will result in losses during ranging markets.
- No Built-In Alerts: The indicator does not include push notifications or email alerts — you need to monitor the chart manually.
- Requires Patience: The best signals come from divergence setups on higher timeframes, which may not suit aggressive scalpers.
The Strategy: The “Secret Momentum Divergence” System
The raw crossover signals work, but they are dangerous in choppy markets. To maximize accuracy, we combine the PAFX Secret Indicator with the 200 EMA as a trend filter and trade only divergence setups aligned with the dominant trend.
Setup & Settings
- PAFX Secret Indicator: Default settings
- 200 EMA: Applied to Close (Main Chart)
- Timeframe: H1 or H4 (Best signal quality)
1. The “Hidden Strength” Buy Setup
We are looking to buy when momentum is secretly building during an uptrend.
- The Filter: Price must be ABOVE the 200 EMA. This confirms the trend is Bullish.
- The Setup: Wait for price to make a lower low while the PAFX histogram makes a higher low (bullish divergence).
- The Trigger: The histogram bars start flipping from negative (below zero) to positive (above zero).
- Entry: Buy at the close of the candle that confirms the crossover.
- Stop Loss: Below the recent swing low (typically 20-40 pips depending on timeframe).
- Take Profit: Target the nearest resistance level, or hold until the histogram starts shrinking significantly.
2. The “Exhaustion” Sell Setup
We are looking to sell when momentum is secretly dying during a downtrend.
- The Filter: Price must be BELOW the 200 EMA. This confirms the trend is Bearish.
- The Setup: Wait for price to make a higher high while the PAFX histogram makes a lower high (bearish divergence).
- The Trigger: The histogram bars start flipping from positive (above zero) to negative (below zero).
- Entry: Sell at the close of the candle that confirms the crossover.
- Stop Loss: Above the recent swing high.
- Take Profit: Target the nearest support level, or hold until the histogram flattens.
Pro Tip: If the histogram bars are tiny and hugging the zero line, DO NOT TRADE. This means the market is ranging and momentum is non-existent. Wait for a clear expansion of bars before entering.
Indicator Settings
The default settings work well for most trading styles. However, you can optimize:
| Parameter | Default | Scalping (M5-M15) | Swing (H4-Daily) |
|---|---|---|---|
| Fast Period | 12 | 8 (more sensitive) | 16 (smoother) |
| Slow Period | 26 | 18 (faster signals) | 34 (less noise) |
| Signal Period | 9 | 5 (quicker trigger) | 12 (fewer false signals) |
How to Install (MT4)
- Download the
.ex4or.mq4file from the link below. - Open MT4 → Go to File > Open Data Folder > MQL4 > Indicators.
- Paste the downloaded file into the Indicators folder.
- Restart MT4 or right-click Navigator panel and hit Refresh.
- Drag the PAFX Secret Indicator onto any chart — it will appear in the sub-window.
Final Verdict: Is the PAFX Secret Indicator Worth Using?
Score: 4/5 Stars ⭐⭐⭐⭐
The PAFX Secret Indicator is a solid momentum histogram tool that does one thing well — it shows you who is in control of the market right now. The clean visual output makes divergence trading significantly easier compared to the standard MACD, and the non-repainting confirmation gives you confidence in your signals.
The lack of built-in alerts is a minor drawback, but the overall signal quality on H1 and H4 timeframes makes it a valuable addition to any MT4 setup. Just remember: never trade it alone. Always pair it with a trend filter like the 200 EMA to avoid getting chopped up in ranging markets.
If you want a clean, lightweight momentum tool that cuts through the noise, download the PAFX Secret Indicator and test it on your demo account today.
This indicator pairs well with indicators from our Top 10 Best Free MT4 Indicators — read the full comparison with expert reviews and trading strategies.
Mirror Download PAFX Secret Indicator for MT4
FAQ: Frequently Asked Questions
Does the PAFX Secret Indicator repaint?
No. The PAFX Secret Indicator is non-repainting. Once a candle closes, the histogram value is permanent and will not change on past bars.
Which timeframe is best for the PAFX Secret Indicator?
While the indicator works on every timeframe from M1 to Monthly, we found the most reliable signals on H1 and H4. Higher timeframes produce fewer but higher-quality setups, especially for divergence trading.
Can I use the PAFX Secret Indicator for Gold (XAUUSD)?
Yes. The indicator works on all instruments available in MT4 — forex pairs, gold, silver, indices, and cryptocurrencies. For gold-specific strategies, check our Best Gold Trading Indicators guide.
Can I combine it with other indicators?
Absolutely. The PAFX Secret pairs well with the RSI for overbought/oversold confirmation or with the Bollinger Bands for volatility squeeze setups.