
Support and Resistance Indicator FREE Download
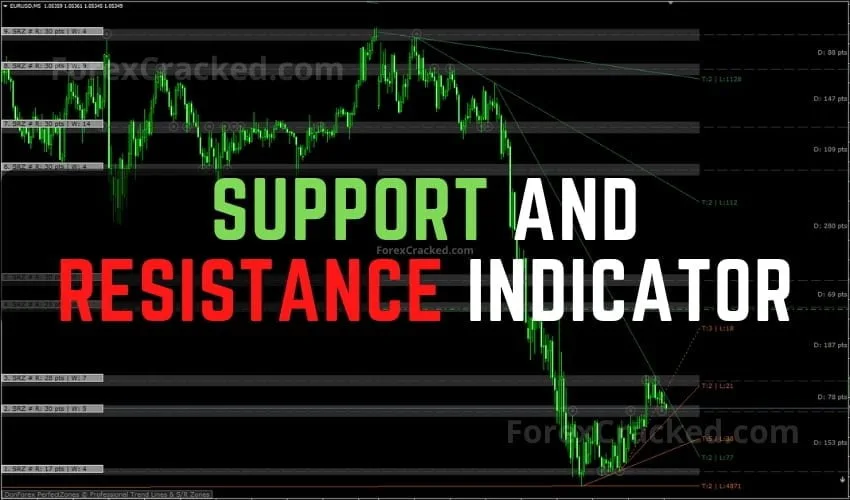
This Support and Resistance Indicator for MT4 is a highly advanced indicator that automatically draws the support and resistance zones...
Looking for support and resistance indicators that automatically plot key levels? Browse our collection of verified S&R tools for MT4 and MT5. From fractal-based zones to dynamic levels and supply & demand detectors — find the right tool for your trading style.
Popular S&R Indicator Types:
| Indicator | Type | Platform | Best For |
|---|---|---|---|
| KG Multi-Timeframe S&R | Auto Zones | MT4 | Multi-Timeframe Analysis |
| Fractal Support & Resistance | Fractal-Based | MT4 | Key Level Detection |
| Bands Sniper | Dynamic S&R | MT4 | Dynamic Levels |
| Quarters Theory | Round Numbers | MT4 | Institutional Levels |
| Givonly SnR SnD | Supply & Demand | MT4 | Supply/Demand Zones |
💡 Pro Tip: Combine a support & resistance indicator with a non-repainting arrow indicator for confirmed entry signals at key levels.
46 posts found
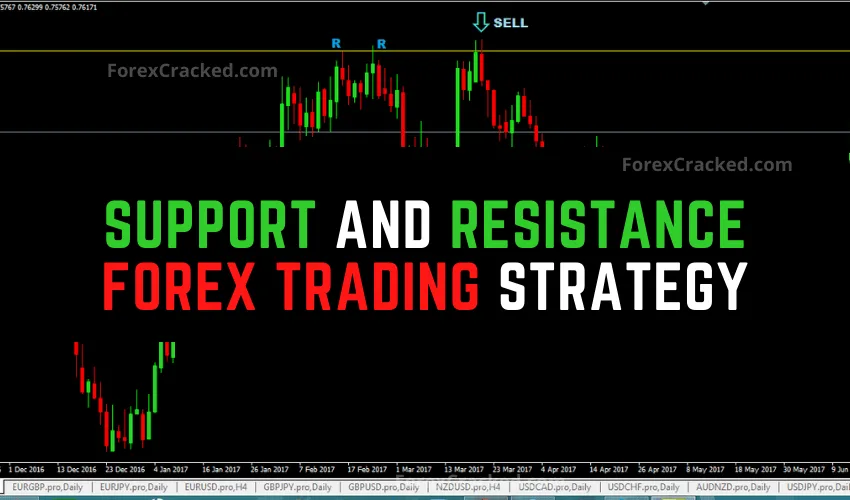
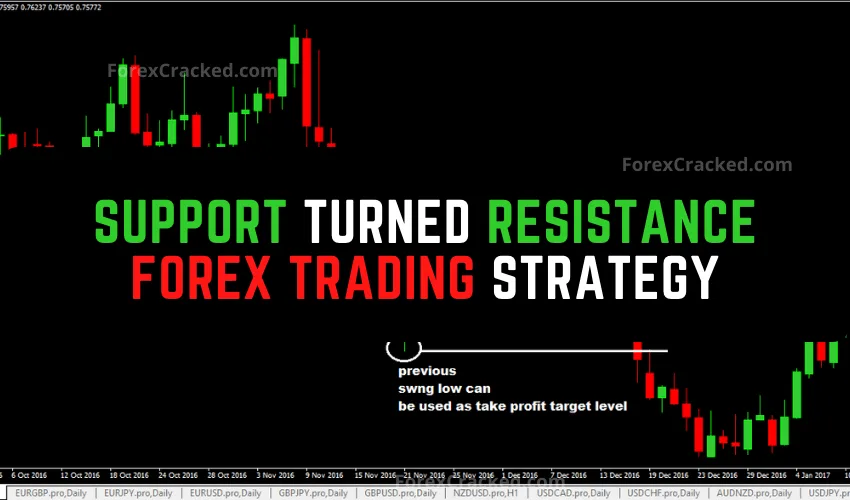
A support and resistance indicator automatically identifies price levels where the market has historically reversed or stalled. Support levels are where price tends to bounce up, while resistance levels are where price tends to reject down. These indicators save time by plotting these zones automatically.
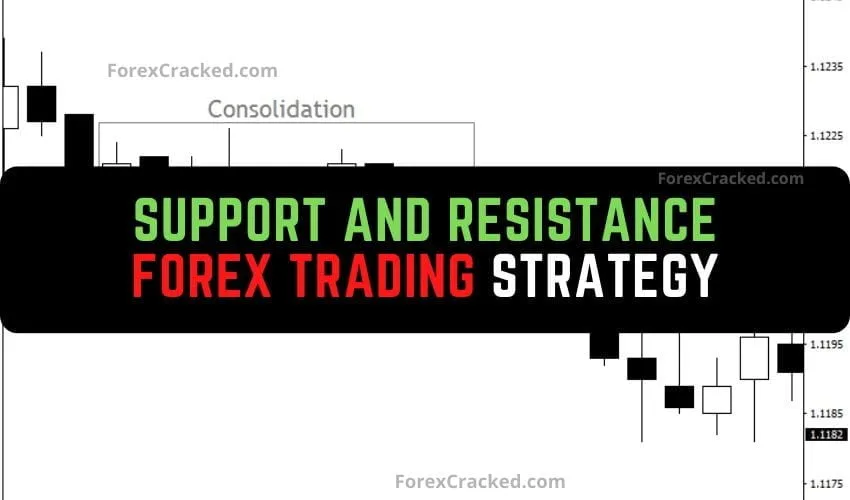
Static support/resistance stays at fixed price levels (like horizontal zones or pivot points). Dynamic support/resistance moves with price (like moving averages or Bollinger Bands). Both types are valuable — static for key levels, dynamic for trending markets.
Fractal-based and multi-timeframe indicators tend to be most accurate because they identify levels where price has reacted multiple times across different timeframes. The KG Multi-Timeframe S&R and Fractal Support & Resistance indicators are top choices.
Yes, but use lower timeframe settings (M5-M15) and focus on dynamic indicators like Bands Sniper. For scalping, look for confluence — where multiple S/R levels overlap creates the strongest zones.
Most quality S/R indicators don't repaint because they're based on historical price data. However, some may adjust zones on the current candle. Always check the indicator description — we test and note repainting behavior in our reviews.