Best Support and Resistance Indicator for MT4 – Trade Smarter with KG’s Multi-Timeframe Zones
If you’ve been trading for a while, you already know one thing: support and resistance levels can make or break...
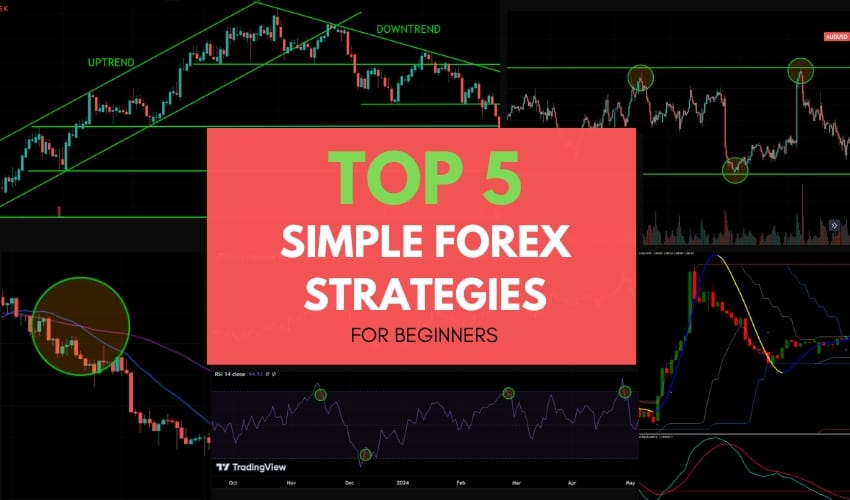
![5 Best Indicators for Your Trading [FREE Downloads]](https://www.forexcracked.com/wp-content/uploads/2024/10/5-Best-Indicators-for-Your-Trading-FREE-Downloads-ForexCracked.com-1.jpg)
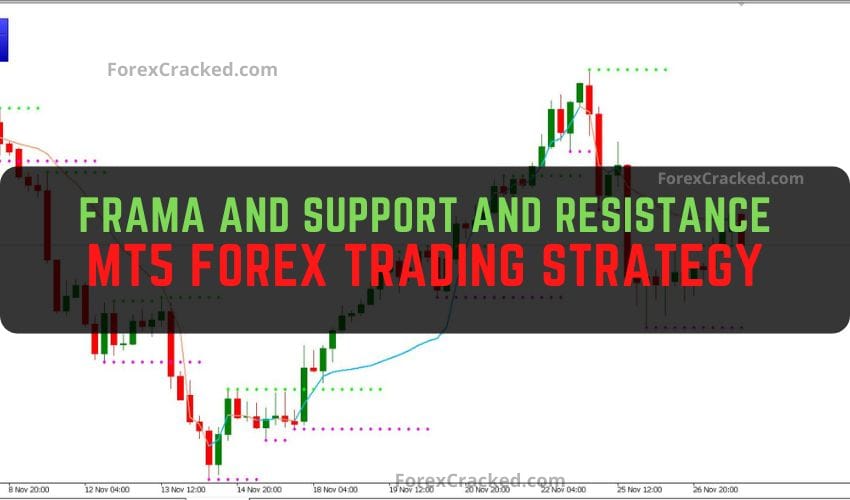
![Market Structure All In One Indicator FREE Download [Update]](https://www.forexcracked.com/wp-content/uploads/2024/03/Market-Structure-All-In-One-Indicator-FREE-Download-ForexCracked.com_.jpg)
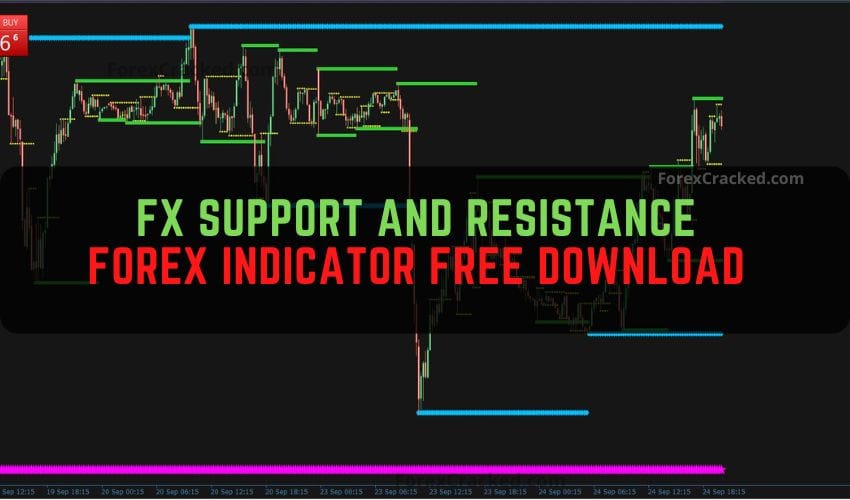
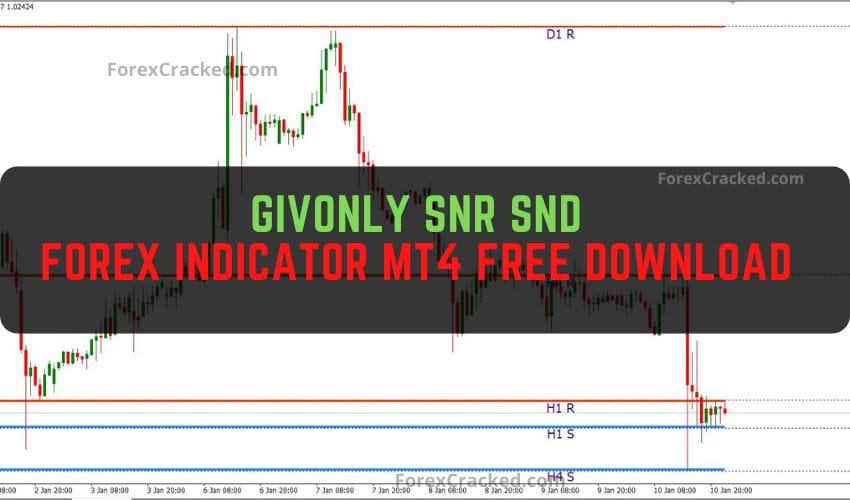
A support and resistance indicator automatically identifies price levels where the market has historically reversed or stalled. Support levels are where price tends to bounce up, while resistance levels are where price tends to reject down. These indicators save time by plotting these zones automatically.
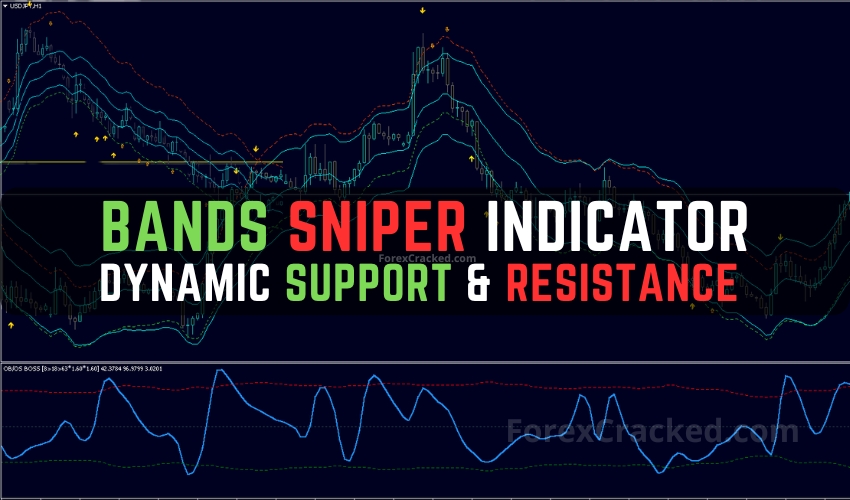
Static support/resistance stays at fixed price levels (like horizontal zones or pivot points). Dynamic support/resistance moves with price (like moving averages or Bollinger Bands). Both types are valuable — static for key levels, dynamic for trending markets.
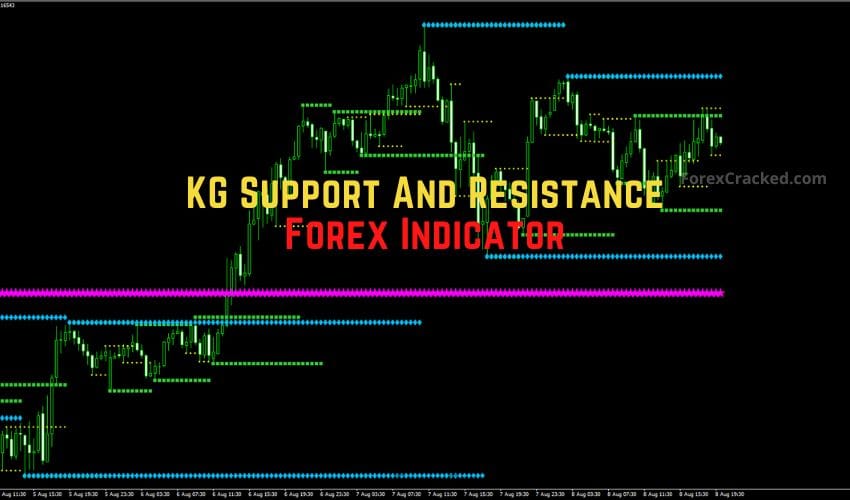
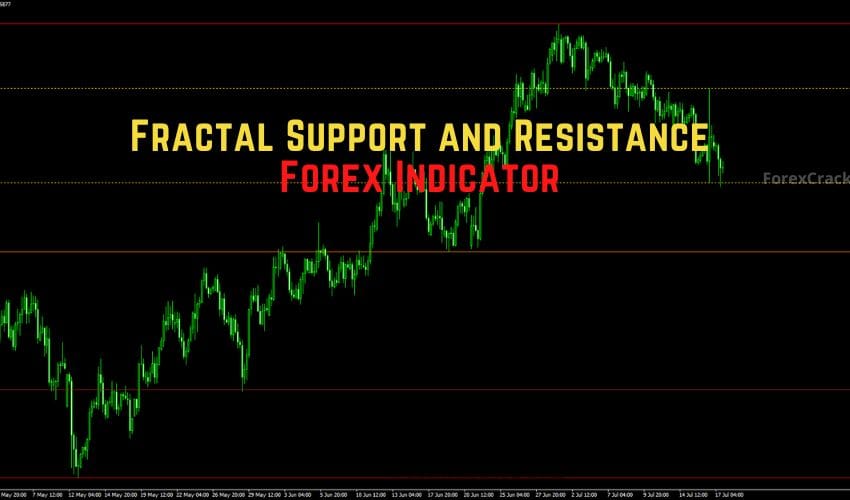
Fractal-based and multi-timeframe indicators tend to be most accurate because they identify levels where price has reacted multiple times across different timeframes. The KG Multi-Timeframe S&R and Fractal Support & Resistance indicators are top choices.
Yes, but use lower timeframe settings (M5-M15) and focus on dynamic indicators like Bands Sniper. For scalping, look for confluence — where multiple S/R levels overlap creates the strongest zones.
Most quality S/R indicators don't repaint because they're based on historical price data. However, some may adjust zones on the current candle. Always check the indicator description — we test and note repainting behavior in our reviews.