
MetaTrader 4 remains the world’s most popular forex trading platform in 2026, and the right indicators can transform your trading results. Whether you’re a scalper looking for quick entries, a swing trader hunting for trend reversals, or a day trader seeking confirmation signals, this comprehensive guide covers the best MT4 indicators available today.
We’ve tested and reviewed hundreds of indicators to bring you the top 10 free mt4 indicators that deliver real results without repainting. Each indicator includes complete trading strategies so you can start using them immediately.
Note: All indicators are available for free download. Links to each tool are provided in their respective sections.
Table of Contents
Quick Comparison: Top 10 Free MT4 Indicators for Forex Trading
Use these tables to quickly identify which indicators match your trading style and needs.
Master Comparison Table
| # | Indicator | Category | Best Timeframe | Difficulty |
| 1 | TDI RT Alerts | All-in-One | H1–H4 | Intermediate |
| 2 | TCL SUPER RSI | Momentum | All | Beginner |
| 3 | Chandelier Exit | Exit/Trailing | H1–D1 | Beginner |
| 4 | SMI Ergodic | Momentum | H1–H4 | Intermediate |
| 5 | TCL BOLL BANDS | Mean Reversion | H1–H4 | Intermediate |
| 6 | Wave Trend | Momentum | H1–H4 | Beginner |
| 7 | Market Structure | Smart Money | H1–D1 | Advanced |
| 8 | Opening Range | Session/Breakout | M15–H1 | Intermediate |
| 9 | Didi Index | Breakout | H1–H4 | Intermediate |
| 10 | Super Signal | Scalping System | M5–M15 | Intermediate |
By Trading Style
| Trading Style | Recommended Indicators | Why |
| Scalping (M1–M15) | Super Signal System, TCL SUPER RSI | Quick signals, visual confluence |
| Day Trading (M30–H4) | TDI RT Alerts, Opening Range, Didi Index | Session-based, breakout focused |
| Swing Trading (H4–D1) | TCL BOLL BANDS, SMI Ergodic, Market Structure | Smooth signals, trend reversals |
| Position Trading (D1+) | Chandelier Exit, Wave Trend | Long-term trailing, less noise |
By Strategy Type
| Strategy | Best Indicators | How They Help |
| Trend Following | TDI RT Alerts + Chandelier Exit | Entry + trailing stop combo |
| Mean Reversion | TCL BOLL BANDS, Wave Trend | Overbought/oversold extremes |
| Breakout Trading | Opening Range, Didi Index, Market Structure | Range breaks, structure shifts |
| Divergence Trading | TDI RT Alerts, SMI Ergodic | Built-in divergence detection |
| Smart Money Concepts | Market Structure + TCL SUPER RSI | BoS/CHoCH + momentum filter |
By Experience Level
| Level | Start With | Why |
| Beginner | TCL SUPER RSI, Wave Trend, Chandelier Exit | Simple visual signals, no manual optimization |
| Intermediate | TDI RT Alerts, TCL BOLL BANDS, Opening Range | Multiple signal types, strategy depth |
| Advanced | Market Structure, Didi Index, Super Signal System | Confluence required, pattern recognition |
Pro Tip: Combine 2-3 complementary indicators (e.g., a trend tool + a momentum oscillator) for the best results. See our recommended combinations in the Best Practices section.
What Makes a Great MT4 Indicator?
Before diving into our top picks, let’s understand what separates exceptional indicators from mediocre ones:
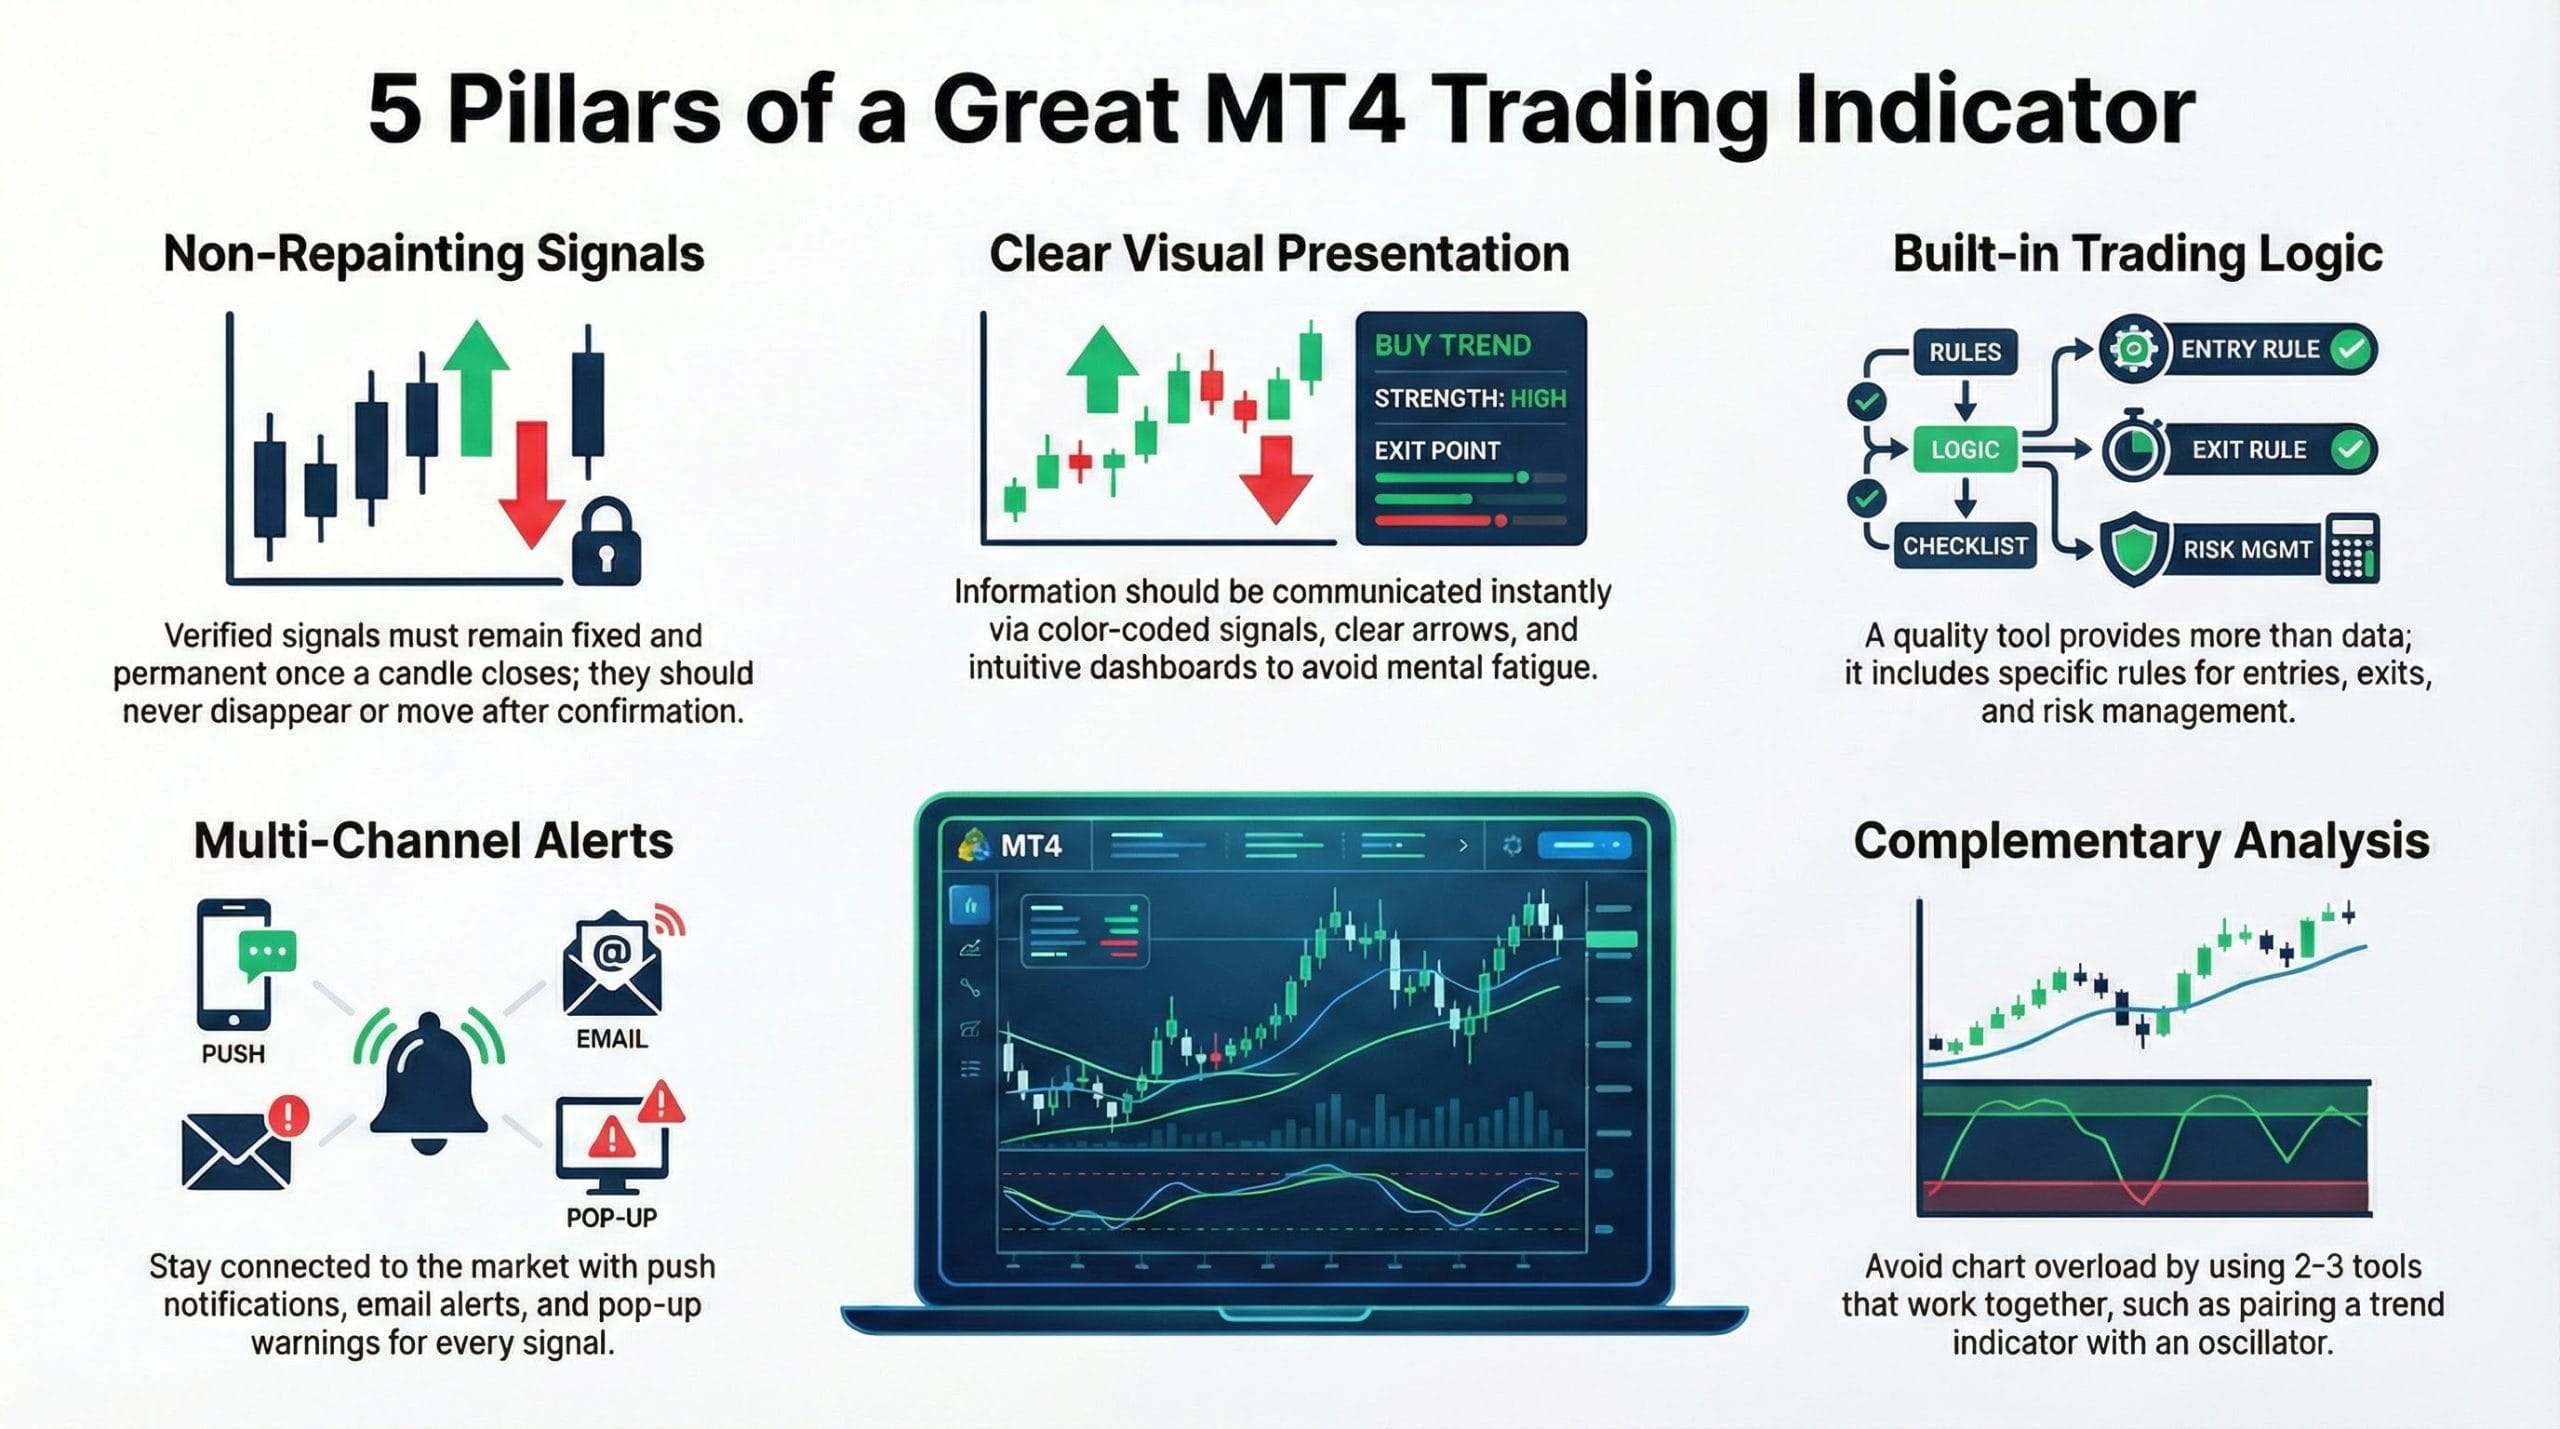
1. Non-Repainting Signals
The most frustrating experience in trading is seeing a “perfect” signal disappear after the candle closes. All indicators in this list have been verified as non-repainting, meaning signals remain fixed after confirmation.
2. Clear Visual Presentation
Great indicators communicate information instantly. You shouldn’t need to squint at your chart or perform mental calculations. Color-coded signals, clear arrows, and intuitive dashboards matter.
3. Built-in Trading Logic
An indicator should tell you not just WHAT is happening, but HOW to trade it. Each tool below includes specific entry, exit, and risk management rules.
4. Alert Functionality
Missing trades while away from your screen costs money. Top indicators include push notifications, email alerts, and pop-up warnings to keep you connected.
5. Complementary Analysis
The best indicators combine well with others. We recommend using 2-3 complementary tools (e.g., a trend indicator + an oscillator) rather than overloading your chart.
1. TDI RT Alerts Divergence – Best All-in-One Indicator
- Best For: Traders who want one indicator to replace multiple tools
- Key Strength: Combines RSI, moving averages, and volatility bands
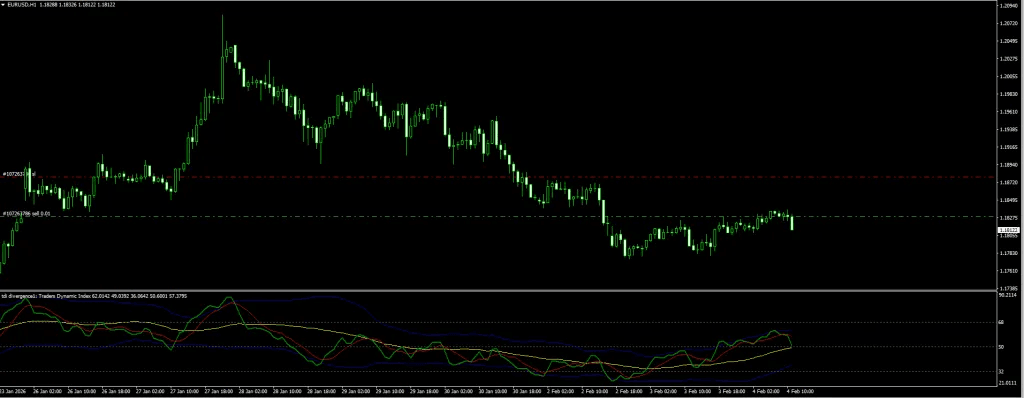
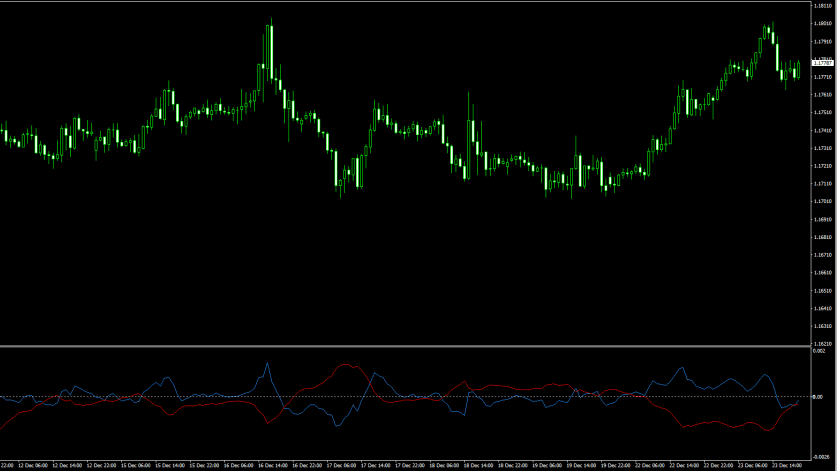
What Is the TDI Indicator?
The Traders Dynamic Index (TDI) was created in 2005 when trader Dean Malone sought to replace an entire dashboard of tools with a single indicator. The TDI RT Alerts Divergence version adds real-time alerts and automatic divergence detection.
Unlike standard RSI that simply oscillates between overbought/oversold levels, the TDI tells you:
- Trend direction (bullish or bearish)
- Trend strength (strong momentum or weak consolidation)
- Market volatility (expanding or contracting)
- Entry/exit signals (crossover-based)
Understanding the 5 TDI Lines
| Line | Color | Purpose |
| RSI Price Line | Green | Primary momentum reading |
| Trade Signal Line | Red | Moving average of RSI for crossovers |
| Market Base Line | Yellow | Longer-term trend filter (50-level equivalent) |
| Upper Volatility Band | Blue | Overbought zone marker |
| Lower Volatility Band | Blue | Oversold zone marker |
How to Trade with TDI: Complete Strategy
Strategy 1: The TDI Crossover Buy
Entry Conditions:
- Green line (RSI Price) crosses ABOVE the Red line (Signal)
- Both lines are above the Yellow line (Market Base)
- Green line is below 68 (not overbought)
Trade Execution:
- Entry: On the next candle open after crossover
- Stop Loss: Below the most recent swing low (or 30-50 pips for majors)
- Take Profit Option 1: When Green line touches upper Blue band
- Take Profit Option 2: When Green line crosses back below Red line
Example: EUR/USD H1 chart shows Green crossing above Red at the 55 level, with both above Yellow. Enter long at 1.0850. Green line reaches upper band at 72 – close for +45 pips.
Strategy 2: The TDI Crossover Sell
Entry Conditions:
- Green line crosses BELOW the Red line
- Both lines are below the Yellow line
- Green line is above 32 (not oversold)
Trade Execution:
- Entry: On the next candle open after crossover
- Stop Loss: Above the most recent swing high
- Take Profit: When Green line touches lower Blue band OR crosses back above Red
Strategy 3: TDI Divergence Trading
This is the most powerful TDI strategy for catching reversals.
Bullish Divergence Setup:
- Price makes a LOWER LOW
- TDI Green line makes a HIGHER LOW
- Wait for Green to cross above Red for confirmation
Bearish Divergence Setup:
- Price makes a HIGHER HIGH
- TDI Green line makes a LOWER HIGH
- Wait for Green to cross below Red for confirmation
Risk Management: Divergence trades carry higher reward potential but require patience. Use 1.5:1 minimum risk-reward ratio.
Recommended Settings
| Setting | Scalping (M5) | Day Trading (H1) | Swing (H4+) |
| RSI Period | 8 | 13 | 21 |
| Signal Period | 2 | 2 | 2 |
| Band Period | 21 | 34 | 55 |
Verdict
TDI RT Alerts Divergence Indicator
A multi-dimensional indicator that combines RSI, Moving Averages, and Volatility Bands into a single sub-window. It replaces the need for multiple separate tools by providing trend direction, momentum strength, market volatility, and crossover-based entry/exit signals — all through 5 color-coded lines.
Pros
- Replaces 3+ indicators with a single tool
- Built-in divergence detection with real-time alerts
- Works across all timeframes with adjustable settings
- Non-repainting — signals stay locked after candle close
- Push notifications, email, and pop-up alerts included
Cons
- Steeper learning curve due to 5 separate lines
- Sub-window only — no on-chart overlay
- Default settings may need tuning for scalping timeframes
- Can feel overwhelming for absolute beginners
Summary
The TDI is essentially three indicators packed into one. It gives you trend direction via the Market Base Line, entry/exit timing through Green-Red crossovers, volatility context from the Bollinger-style bands, and built-in divergence detection for catching reversals. The learning curve is moderate — you need to understand all 5 lines — but once mastered, it eliminates the need for a cluttered chart. Non-repainting and alert-enabled.
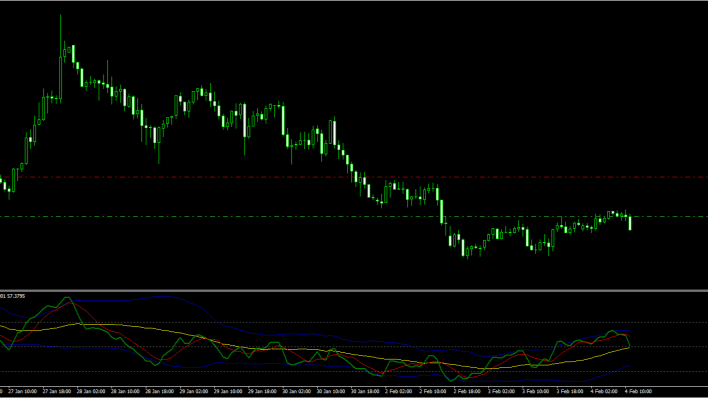
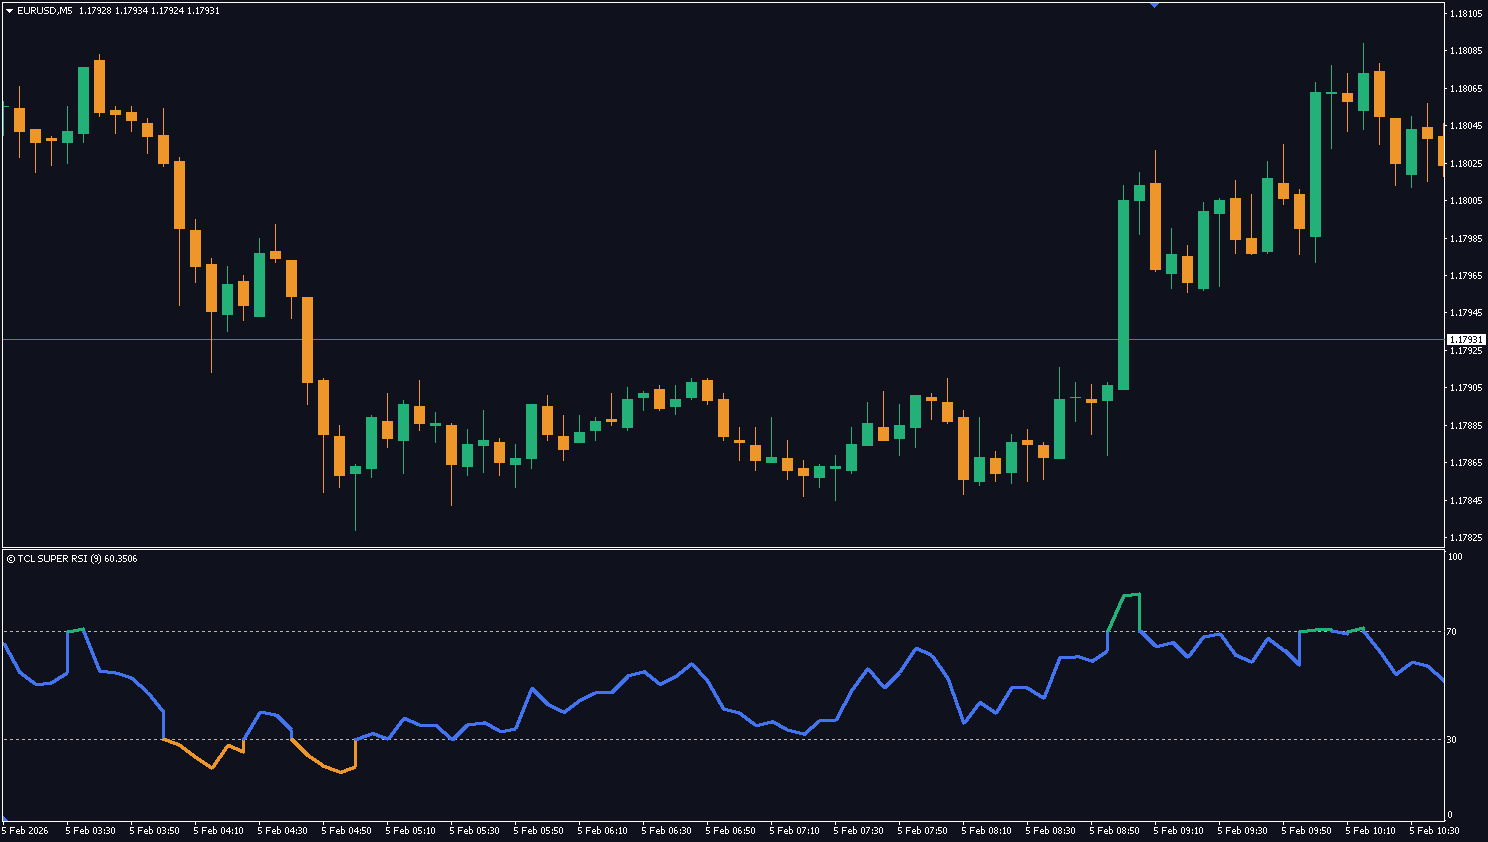
2. TCL SUPER RSI – Best Adaptive Momentum Indicator
- Best For: Traders who use multiple timeframes
- Key Strength: Auto-adjusting RSI that eliminates manual optimization
The Problem with Standard RSI
The Relative Strength Index is arguably the most popular indicator in trading history but 90% of traders use it incorrectly. The standard 14-period setting was designed for Daily charts, yet traders apply it to everything from M1 scalping to Weekly investing.
Here’s the technical reality:
- A 14-period RSI on a 1-Minute chart is mathematically too lagged to catch rapid liquidity sweeps
- On a Weekly chart, the same 14-period RSI is often too noisy, generating false reversal signals
The Solution: Context-Aware Engineering
The TCL SUPER RSI from TradeCodeLabs solves this with automatic timeframe detection. When you switch charts, the indicator adjusts its calculation period to match that specific volatility profile.
How the Adaptive Engine Works
| Timeframe | RSI Period | Trading Style |
| M1–M5 | 7–9 | Scalping – captures micro-exhaustion |
| M15–H1 | 14–21 | Intraday – filters session overlap noise |
| H4–Monthly | 28–50 | Swing – ignores minor pullbacks |
Visual Design: 3-Zone Coloring System
Your brain processes colors faster than numbers. TCL SUPER RSI color-codes the line itself:
| Color | Zone | Action |
| Green | Overbought (>70) | Look for Shorts / Take Profit on Longs |
| Orange | Oversold (<30) | Look for Longs / Take Profit on Shorts |
| Blue | Neutral (30–70) | Hold positions / Wait for extremes |
How to Trade with TCL SUPER RSI: Complete Strategy
Strategy 1: The Pullback Entry (Trend Continuation)
This is the highest probability setup for trend traders.
Buy Setup:
- Identify an uptrend on your chart (higher highs and higher lows)
- Wait for TCL Super RSI to dip into the Blue zone (40-50 level)
- The RSI must NOT touch Orange (oversold) – this would indicate trend break
- Enter long when RSI turns back upward from the Blue zone
Trade Management:
- Stop Loss: Below the pullback swing low
- Take Profit: At previous swing high OR when RSI enters Green zone
Example: GBP/USD is trending up. RSI dips to 45 (Blue) and bounces. Enter long with stop 25 pips below the pullback low. RSI reaches 72 (Green) – exit for +60 pips.
Strategy 2: The Divergence Reversal
Bearish Divergence (Sell Signal):
- Price makes a higher high
- TCL Super RSI (in Green mode) makes a lower high
- This indicates momentum is decaying while price is still rising
- Enter short when price breaks below the most recent swing low
Bullish Divergence (Buy Signal):
- Price makes a lower low
- TCL Super RSI (in Orange mode) makes a higher low
- Enter long when price breaks above the most recent swing high
Risk Management:
- Use 1:2 minimum risk-reward ratio
- Never risk more than 2% per trade
Why It’s Non-Repainting
TCL SUPER RSI uses PRICE_CLOSE logic. Alerts and color changes are only confirmed once the candle officially closes. The signal will never vanish or shift after the fact.
Verdict
TCL SUPER RSI
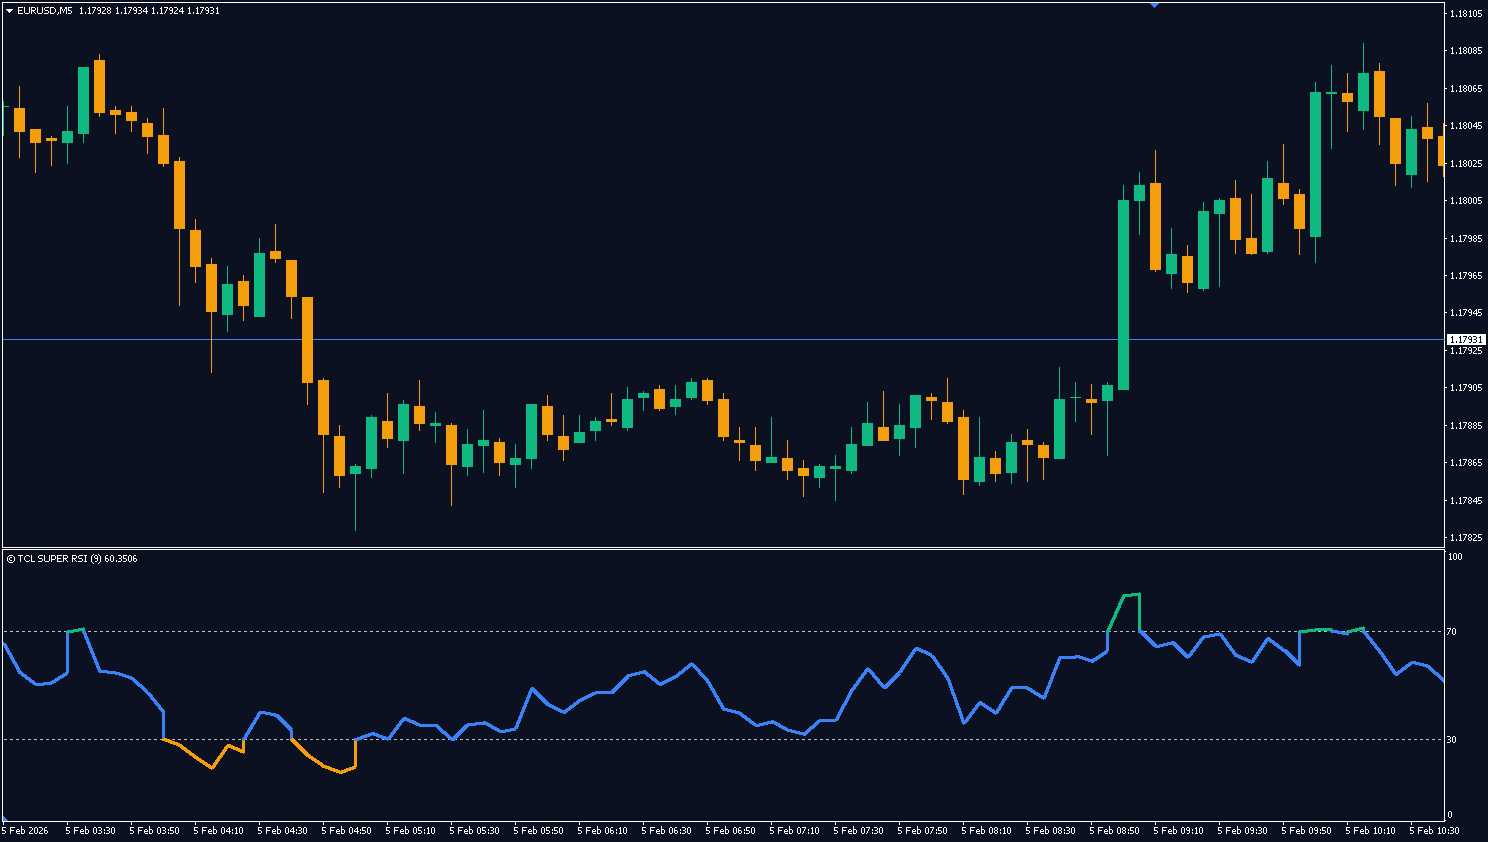
An intelligent RSI that auto-adjusts its calculation period based on the active timeframe. Instead of using a fixed 14-period like standard RSI, it detects whether you're on M1 or Monthly and adapts accordingly — shorter periods for scalping, longer periods for swing trading. Features a 3-zone color-coded line (Green/Orange/Blue) for instant visual reading.
Pros
- Zero configuration needed — auto-adjusts to any timeframe
- Intuitive 3-color zone system for instant reading
- Verified non-repainting (PRICE_CLOSE logic)
- Perfect for multi-timeframe traders
Cons
- No built-in divergence detection
- Sub-window indicator only
Summary
If you've ever been frustrated manually tweaking RSI settings every time you switch timeframes, TCL Super RSI is a game-changer. The adaptive engine uses context-aware period selection — 7-9 for M1-M5 scalping, 14-21 for intraday, 28-50 for swing — so you never have to touch settings. The 3-zone coloring (Green = overbought, Orange = oversold, Blue = neutral) lets you read momentum at a glance. Uses PRICE_CLOSE logic, making it fully non-repainting.
3. Chandelier Exit – Best Volatility-Based Exit Tool
- Best For: Trend followers who exit trades too early
- Key Strength: ATR-based dynamic trailing stop
The “Early Exit” Problem
The biggest enemy of profitable trading isn’t the market—it’s the Fear of Missing Out (FOMO) on profits. You see a gain, panic that the market will reverse, and exit. Five minutes later, price explodes another 100 pips in your direction.
The Chandelier Exit Indicator is the cure for early exit syndrome. Instead of using a static, emotional stop loss, this tool calculates the perfect trailing distance using market volatility.
How It Works: The Volatility Logic
Unlike standard Moving Averages, the Chandelier Exit is based on the ATR (Average True Range):
- Calculates average volatility over a set period (default: 22 candles)
- Multiplies it by a factor (default: 3x)
- Creates a dynamic “Volatility Ceiling” for shorts or “Floor” for longs
The result: Your stop widens automatically during volatile news events and tightens during quiet consolidation.
Visual Signal Interpretation
- Blue/Green dots BELOW price = Uptrend active (hold longs)
- Red dots ABOVE price = Downtrend active (hold shorts)
- Dot color flip = Potential trend reversal signal
How to Trade with Chandelier Exit: Complete Strategy
Strategy 1: Trailing Stop Method (Primary Use)
This is how professionals use the Chandelier Exit.
For Long Trades:
- Enter long based on your preferred entry signal (e.g., TDI crossover)
- Place initial stop loss at the Chandelier Exit line (dots below price)
- As price rises, the Chandelier line rises with it
- Exit the trade ONLY when price closes BELOW the Chandelier line
For Short Trades:
- Enter short based on your entry signal
- Place initial stop at the Chandelier line (dots above price)
- As price falls, the Chandelier line falls with it
- Exit when price closes ABOVE the line
Trade Example:
- Enter long on EUR/USD at 1.0850
- Chandelier shows initial stop at 1.0810 (40 pips risk)
- Price rises to 1.0950 over 3 days
- Chandelier trails to 1.0890
- Price reverses and closes below 1.0890
- Exit for +40 pips profit (instead of -40 pip loss if using static stop)
Strategy 2: Trend Reversal Entry
Use the Chandelier color flip as an entry signal.
Buy Signal:
- Chandelier flips from dots ABOVE price (red) to dots BELOW price (blue)
- This confirms a potential uptrend beginning
- Enter long on the next candle
- Stop loss at the Chandelier line
Sell Signal:
- Chandelier flips from dots BELOW price to dots ABOVE price
- Enter short on the next candle
- Stop loss at the Chandelier line
Best Settings for 2026
| Setting | Value | Notes |
| ATR Period | 22 | Balances responsiveness and stability |
| ATR Multiplier | 3.0 | Standard deviation for trailing stop |
| Use Close | True | More conservative than High/Low |
Comparison: Chandelier Exit vs. Parabolic SAR
| Feature | Chandelier Exit | Parabolic SAR |
| Based on | True volatility (ATR) | Acceleration factor |
| Adapts to market | Yes (widens/tightens) | Partially |
| Whipsaw resistance | Higher | Lower |
| Best for | Multi-day trends | Short-term trades |
Verdict
Chandelier Exit Indicator
A dynamic trailing stop indicator based on Average True Range (ATR). It calculates market volatility and creates an adaptive "floor" for longs or "ceiling" for shorts that automatically widens during volatile events and tightens during consolidation. Displays as colored dots above or below price.
Pros
- ATR-based logic adapts to real market volatility
- Superior whipsaw resistance vs. Parabolic SAR
- Simple visual — dots above or below price
- Works as both trailing stop AND trend reversal entry
- Available on MT4 and MT5
Cons
- Not a standalone entry tool — needs a separate entry signal
- Can lag during sudden V-shaped reversals
- Default 3.0 multiplier may be too wide for scalpers
- Does not provide take-profit levels
Summary
The Chandelier Exit is the cure for "early exit syndrome." Instead of panicking out of a trade when you see a small pullback, this tool gives you a mathematically calculated trailing stop based on real market volatility. Blue/ Green dots below price = uptrend active; Red dots above = downtrend active. It outperforms Parabolic SAR in whipsaw resistance and is vastly superior for multi-day trend trades. Essential companion to any entry-signal indicator.
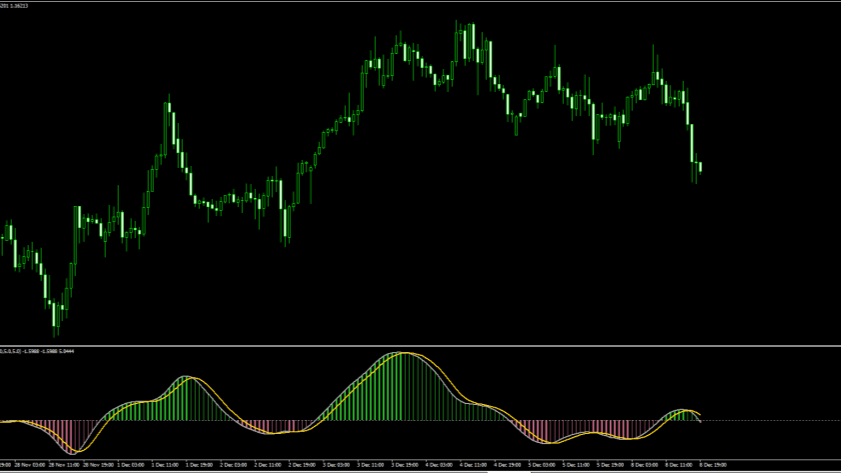
4. SMI Ergodic Oscillator – Best Smooth Reversal Indicator
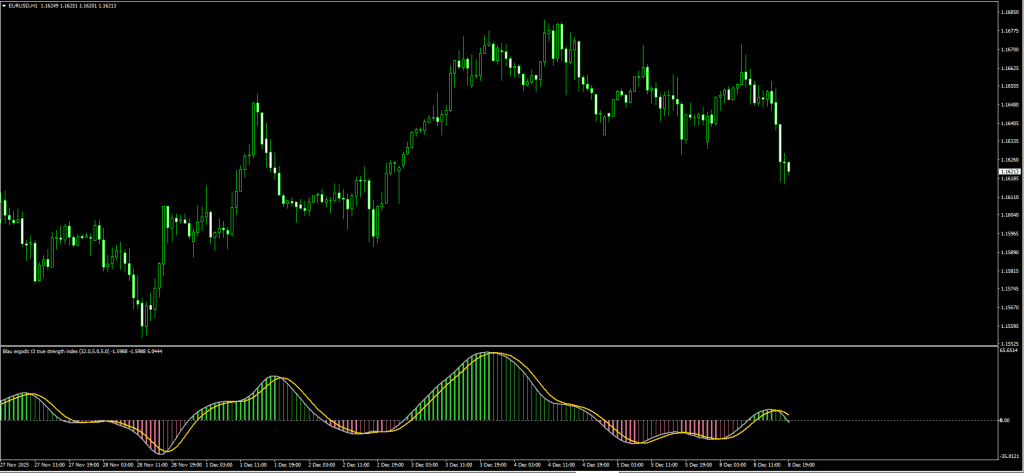
- Best For: Reversal traders tired of noisy oscillators
- Key Strength: Double-smoothed momentum for cleaner signals
Why Standard Stochastic Fails
We all know the struggle with the standard Stochastic Oscillator:
- It hits “Overbought” and stays there for days while the trend keeps going
- It crosses ten times in an hour, chopping your account to pieces
- By the time you get a confirmed signal, the move is half over
The SMI Ergodic Solution
The SMI Ergodic Oscillator is the sophisticated cousin of standard Stochastic. It uses the True Strength Index (TSI) formula to double-smooth the price data.
The result? A cleaner, less noisy signal that helps you catch the meat of the trend while filtering out fakeouts.
Understanding the Visual Components
| Component | Color | What It Shows |
| TSI Line | Gray | Core price momentum |
| Signal Line | Yellow | Smoothed average of TSI |
| Histogram (Thick Green) | Green | Strong bullish momentum |
| Histogram (Thin Green) | Light Green | Bullish but weakening |
| Histogram (Thick Red) | Red | Strong bearish momentum |
| Histogram (Thin Red) | Light Red | Bearish but weakening |
How to Trade the SMI Ergodic: Complete Strategy
The “Ergodic Wave” System
We combine the SMI with a 200 EMA trend filter to eliminate counter-trend losses.
Buy Setup:
- Price is ABOVE the 200 EMA (confirming uptrend)
- SMI Gray line crosses ABOVE Yellow line
- Histogram changes from Red to Green
- Both lines are below the zero line (coming from oversold)
Entry Execution:
- Enter long on the candle close after crossover
- Stop Loss: Below the recent swing low (or 200 EMA if closer)
- Take Profit: When histogram turns from Thick Green to Thin Green
Sell Setup:
- Price is BELOW the 200 EMA (confirming downtrend)
- SMI Gray line crosses BELOW Yellow line
- Histogram changes from Green to Red
- Both lines are above the zero line (coming from overbought)
Entry Execution:
- Enter short on the candle close
- Stop Loss: Above the recent swing high
- Take Profit: When histogram turns from Thick Red to Thin Red
Real Trade Example
- Pair: USD/JPY H4
- Trend Filter: Price below 200 EMA ✓
- SMI Signal: Gray crosses below Yellow at +15 level ✓
- Histogram: Flips from Green to Thick Red ✓
- Entry: 149.50 (short)
- Stop Loss: 150.20 (70 pips)
- Exit: Histogram turns Thin Red at 148.00
- Result: +150 pips profit (2.1:1 reward)
Why It’s Better Than Stochastic
| Metric | Standard Stochastic | SMI Ergodic |
| False signals | High | Low |
| Lag | Low | Moderate |
| Divergence visibility | Poor | Excellent |
| Best for | Scalping | Swing trading |
Verdict
SMI Ergodic Oscillator Indicator
A double-smoothed momentum oscillator based on the True Strength Index (TSI) formula. It produces significantly cleaner signals than standard Stochastic by applying two layers of exponential smoothing. Features a TSI line, Signal line, and a 4-color histogram that shows momentum strength and direction.
Pros
- Far fewer false signals than standard Stochastic
- Excellent divergence visibility for reversal trades
- 4-color histogram makes momentum shifts easy to read
- Double-smoothed formula filters market noise
- Available on MT4 and MT5
Cons
- Slightly more lag than standard Stochastic (trade-off for smoothness)
- Requires a trend filter (e.g., 200 EMA) for best results
- Not ideal for fast scalping on very low timeframes
- The histogram colors can be subtle on some chart themes
Summary
If Stochastic is chopping your account to pieces with constant whipsaws, the SMI Ergodic is a direct upgrade. The double-smoothing dramatically reduces false crossovers while maintaining responsiveness. The 4-stage histogram (Thick Green → Thin Green → Thin Red → Thick Red) gives you a clear visual roadmap of momentum transitions. Best used with a 200 EMA trend filter to eliminate counter-trend losses. Excellent for swing trading on H1-H4.


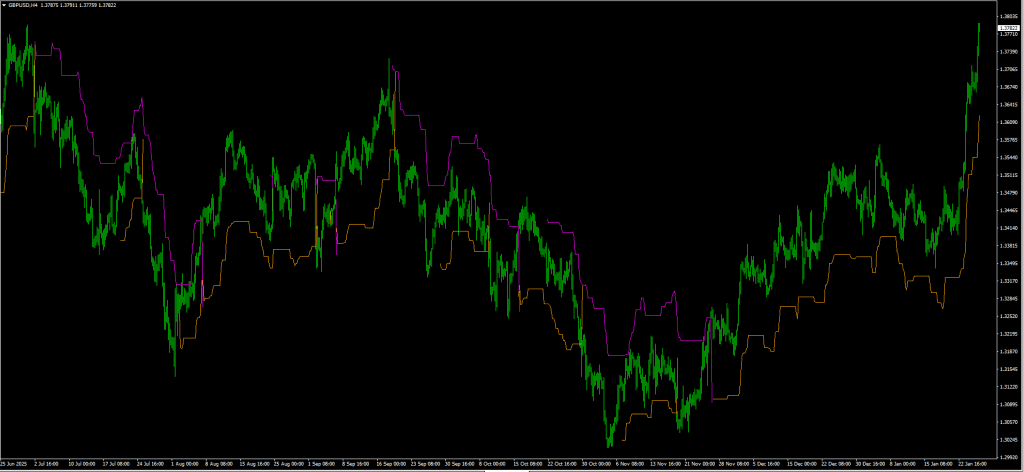
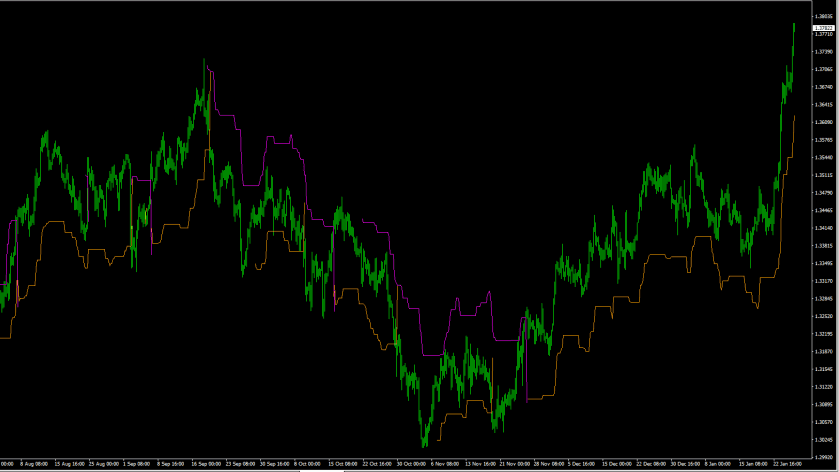
5. TCL BOLL BANDS Trader – Best Mean Reversion System

- Best For: Reversal traders who want protection from “catching falling knives”
- Key Strength: Built-in trend filter prevents counter-trend disasters
The “Falling Knife” Problem
Bollinger Bands are famous for “Mean Reversion” price snaps back to the average after an extreme move. However, novice traders often blow their accounts blindly buying every lower band touch.
In a market crash or strong rally, price can “ride the bands” for days, triggering buy signal after buy signal that all fail. This is the dreaded falling knife scenario.
The TCL Solution: Built-in Trend Filter
The TCL BOLL BANDS forces every signal through a rigorous background check before appearing on your chart.
The Trend Filter checks three metrics:
| Metric | Bullish Condition | Bearish Condition |
| 50 EMA | Price above | Price below |
| RSI (14) | Above 55 | Below 45 |
| MACD | Histogram bullish | Histogram bearish |
If the filter detects a strong trend, it BLOCKS counter-trend signals. This protects you from trading against runaway markets.
Dual-Layer Entry System
Professional traders rarely go “all in” on the first touch. TCL Boll Bands supports tiered entries:
Signal 1 (Standard):
- Triggered at 2.0 Standard Deviation band
- Heavily filtered by trend engine
- Primary entry for normal volatility
Signal 2 (Extreme):
- Triggered at 3.0 Standard Deviation band
- Highlights rare 3-sigma events
- Used for “scaling in” positions
How to Trade TCL Boll Bands: Complete Strategy
The Mean Reversion Buy
Conditions:
- Price touches or pierces the LOWER 2.0 band
- Trend filter confirms: Price above 50 EMA, RSI healthy, MACD bullish
- Buy arrow signal appears
Execution:
- Enter long at the arrow signal
- Stop Loss: 25 pips below entry (or below the 3.0 band)
- Take Profit: Middle band (the 20-period moving average)
Scaling In (Advanced):
- Take 50% position at Signal 1 (2.0 band touch)
- Add remaining 50% if Signal 2 appears (3.0 band touch)
- This averages your entry during extreme moves
The Mean Reversion Sell
Conditions:
- Price touches or pierces the UPPER 2.0 band
- Trend filter confirms: Price below 50 EMA, RSI weak, MACD bearish
- Sell arrow signal appears
Execution:
- Enter short at the arrow
- Stop Loss: 25 pips above entry
- Take Profit: Middle band
Smart Dashboard Features
The on-chart dashboard calculates:
- Stop Loss (fixed pips from entry)
- Dynamic Take Profit (auto-adjusts to Middle Band)
- Signal status (locks after confirmation)
When to Disable the Trend Filter
Set `Enable Trend Filter = false` ONLY for:
- Clear ranging markets (no trend)
- Experienced traders who can identify consolidation
Verdict
TCL Boll Bands Trader

A complete mean-reversion trading system built on Bollinger Bands with a built-in 3-metric trend filter (50 EMA + RSI + MACD). It prevents the classic "catching falling knives" problem by blocking counter-trend signals during strong moves. Features dual-layer entries at 2.0σ and 3.0σ bands, plus an on-chart dashboard showing SL, TP, and signal status.
Pros
- Built-in 3-metric trend filter prevents "falling knife" disasters
- Dual-layer entry system for professional position scaling
- On-chart dashboard with auto SL/TP calculation
- Non-repainting signals locked after confirmation
Cons
- Trend filter can occasionally block valid signals in choppy markets
- Requires understanding of mean reversion concepts
- Not ideal for pure trend-following strategies
- Dashboard may crowd smaller chart windows
Summary
This is not your grandfather's Bollinger Band indicator. The built-in trend filter checks 3 independent metrics (50 EMA position, RSI level, MACD histogram) before allowing any signal through — effectively preventing the catastrophic counter-trend trades that destroy most mean-reversion accounts. The dual-layer system (2.0σ standard + 3.0σ extreme) allows professional scaling-in during volatile moves. The on-chart dashboard auto-calculates SL and dynamic TP. Non-repainting and fully adaptive.
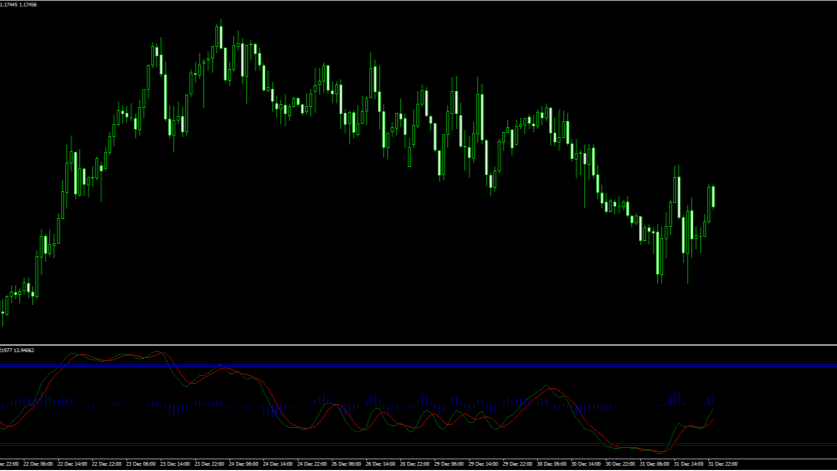
6. Wave Trend Oscillator – Best Momentum Oscillator
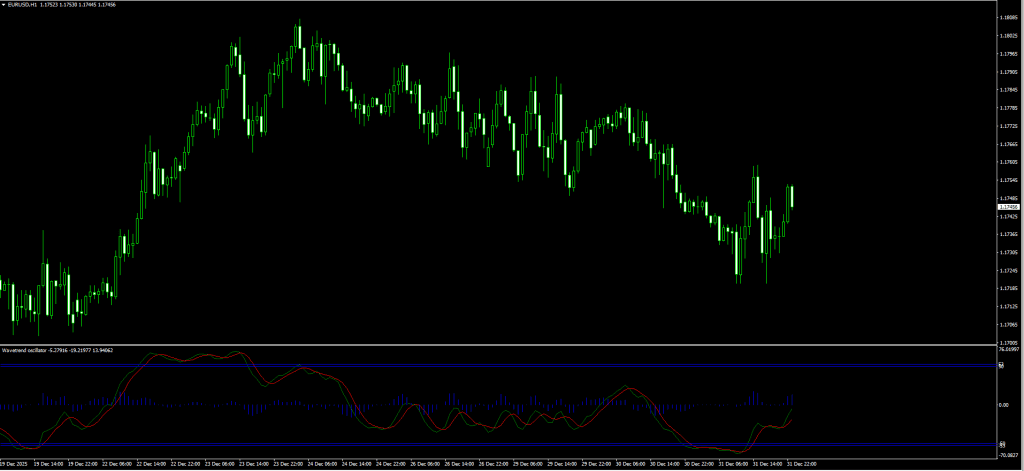
- Best For: Reversal traders seeking smooth momentum readings
- Key Strength: Significantly less noise than standard RSI
What Is the Wave Trend Oscillator?
The Wave Trend Oscillator sits below your main chart and tracks momentum relative to a “Channel” and “Average.” Originally popularized on TradingView, this MT4 version brings the same smooth momentum readings to MetaTrader.
Why It’s Superior to RSI
Standard RSI is often “jagged” and generates multiple false signals during choppy markets. The Wave Trend uses additional smoothing calculations that filter noise while maintaining responsiveness.
Visual Components
- Two oscillating lines: Wave Trend (fast) and Trigger (slow)
- Overbought zone: Above +60
- Oversold zone: Below -60
- Zero line: Trend direction reference
How to Trade Wave Trend: Complete Strategy
The “Wave Rider” System
Setup Requirements:
- Timeframe: H1 or H4 (best results)
- Wave Trend must reach extreme levels
Deep Value Buy Setup
Conditions:
- Wave Trend drops below -60 (oversold zone)
- Wave Trend line crosses ABOVE the Trigger line
- Both lines are turning upward
Execution:
- Entry: On the candle close after crossover
- Stop Loss: Below the most recent swing low (typically 30-50 pips)
- Take Profit Option 1: When Wave Trend reaches zero line (+60 point move)
- Take Profit Option 2: When Wave Trend reaches +60 (overbought)
Peak Reversal Sell Setup
Conditions:
- Wave Trend rises above +60 (overbought zone)
- Wave Trend line crosses BELOW the Trigger line
- Both lines are turning downward
Execution:
- Entry: On the candle close after crossover
- Stop Loss: Above the most recent swing high
- Take Profit: When Wave Trend reaches zero line OR -60
Settings Optimization
| Market Condition | Channel Length | Average Length |
| High Volatility (Gold, JPY) | 12 | 21 |
| Normal (Major pairs) | 10 | 21 |
| Low Volatility (Ranging) | 8 | 15 |
Real Trade Example
- Pair: EUR/USD H4
- Wave Trend: Drops to -72, then crosses above Trigger
- Entry: 1.0780 (long)
- Stop Loss: 1.0740 (40 pips below swing low)
- Wave Trend reaches zero: Price at 1.0850
- Profit: +70 pips (1.75:1 reward)
Verdict
Wave Trend Oscillator
A smoother alternative to standard RSI that tracks momentum using "Channel" and "Average" calculations. Originally popularized on TradingView, this MT4 version features two oscillating lines with clearly defined overbought (+60) and oversold (-60) zones. Significantly less noisy than standard momentum oscillators.
Pros
- Significantly smoother than standard RSI or Stochastic
- Clear overbought/oversold zones at ±60
- Simple crossover logic — easy for beginners
- Adjustable Channel/Average settings for different volatility
- Free and lightweight on chart resources
Cons
- MT4 only — no MT5 version
- Lacks built-in alert functionality in some versions
- Can lag in fast-moving, news-driven markets
- No built-in divergence detection
Summary
Wave Trend is the "anti-RSI" — where standard RSI gives you jagged, twitchy readings that generate multiple false signals in choppy markets, Wave Trend's additional smoothing calculations produce clean, actionable extremes. The crossover of the Wave Trend and Trigger lines at extreme zones (+60 / -60) is a high-probability reversal signal. Settings are adjustable for different volatility environments. An excellent first oscillator for beginners.
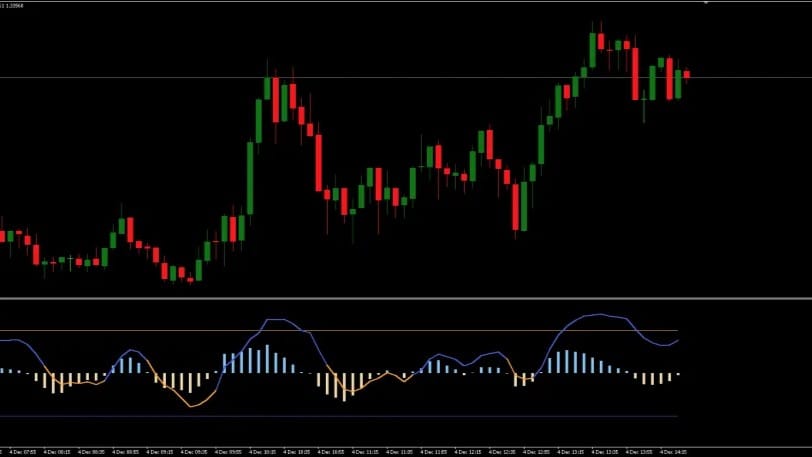
7. Market Structure Oscillator – Best Smart Money Indicator
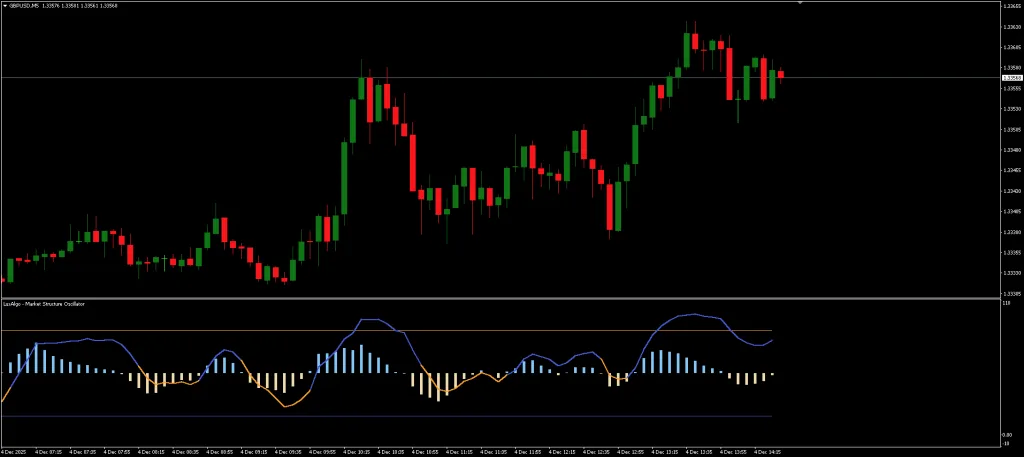
- Best For: Traders who follow Smart Money Concepts
- Key Strength: Detects structure breaks (BoS) and change of character (CHoCH)
What Is Market Structure?
Market structure refers to the swing highs and swing lows that form the backbone of price movement. Understanding structure is essential for:
- Identifying trend direction
- Spotting potential reversals
- Finding optimal entry points
The Market Structure Oscillator automates this analysis.
How It Works: Technical Functionality
The oscillator performs three core functions:
- Swing Point Detection: Identifies short-term swing highs and lows
- Multi-Timeframe Analysis: Derives intermediate and long-term swings
- Structure Event Detection:
- MSS (Market Structure Shift) / CHoCH: Potential trend change
- BoS (Break of Structure): Trend continuation confirmed
How to Trade Market Structure: Complete Strategy
Strategy 1: Trading the Break of Structure (BoS)
Bullish BoS Buy Setup:
- Identify a swing high in an uptrend
- Wait for price to break ABOVE this swing high
- Oscillator confirms BoS (displays bullish signal)
- Enter long on pullback to the broken level
Execution:
- Entry: On pullback to the broken swing high (now support)
- Stop Loss: Below the most recent swing low
- Take Profit: Project the previous swing range upward
Strategy 2: Trading Change of Character (CHoCH)
Bearish CHoCH Sell Setup:
- Market has been making higher highs and higher lows (uptrend)
- Price breaks BELOW a significant swing low
- Oscillator signals CHoCH (structure shift)
- This indicates uptrend may be ending
Execution:
- Entry: On pullback after the CHoCH break
- Stop Loss: Above the CHoCH swing high
- Take Profit: Previous major support level
Configuration Options
| Setting | Description |
| Short-term Length | Sensitivity for quick swings |
| Intermediate Length | Balance between noise and signal |
| Long-term Length | Major structure identification |
Real Trade Example
- Pair: GBP/USD H1
- Setup: Price breaks above swing high at 1.2650.
- Oscillator: Shows Bullish BoS
- Entry: Pullback to 1.2650 (previous resistance now support)
- Stop Loss: 1.2620 (30 pips)
- Target: 1.2720 (previous swing projection)
- Result: +70 pips (2.3:1 reward)
Verdict
Market Structure Oscillator
Automates the detection of market structure events — Break of Structure (BoS) and Change of Character (CHoCH) — that form the foundation of Smart Money Concepts trading. Uses multi-timeframe swing point analysis with configurable short-term, intermediate, and long-term length settings.
Pros
- Automates tedious structure marking (BoS/CHoCH)
- Multi-timeframe swing analysis in one indicator
- Available on both MT4 and MT5
- Essential for Smart Money / ICT traders
- Configurable sensitivity for different trading styles
Cons
- Requires solid understanding of market structure concepts
- Not beginner-friendly — Advanced level indicator
- Not a standalone system — needs momentum confirmation
- Can generate excessive signals on very low timeframes
Summary
If you trade Smart Money Concepts (ICT, SMC), this indicator removes hours of manual chart markup. It automatically identifies swing highs/lows, detects BoS (trend continuation) and CHoCH (potential reversal) events, and displays them cleanly in a sub-window. The multi-timeframe engine derives intermediate and long-term swings from short-term data, giving you a layered view of structure. Best paired with a momentum confirmation tool like TCL Super RSI.
8. Opening Range with Breakouts & Targets – Best Session Trading Indicator
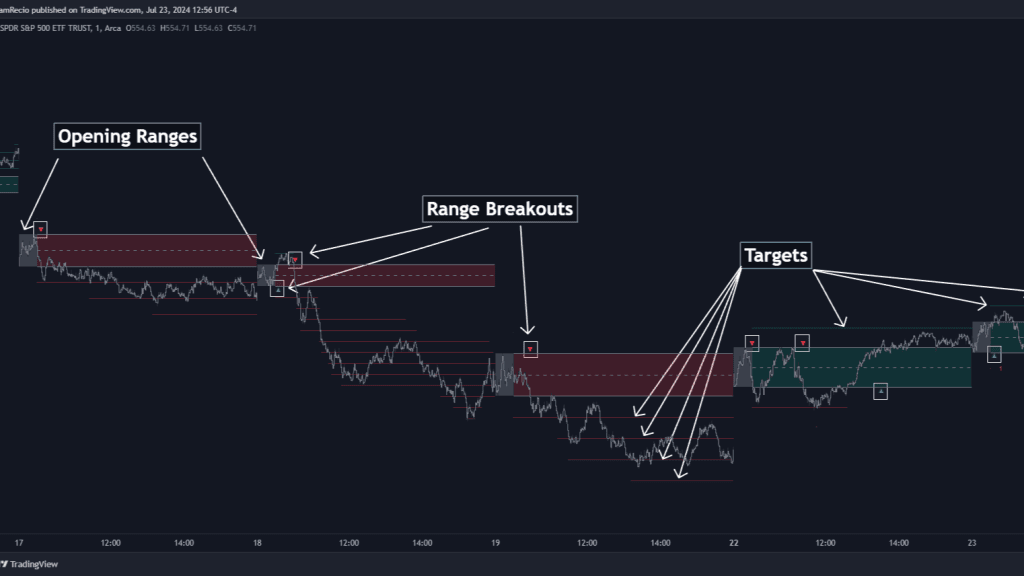
- Best For: Day traders using Opening Range Breakout (ORB) strategy
- Key Strength: Automatic range detection with projected profit targets
The Time-Tested ORB Strategy
The Opening Range Breakout strategy has been used by legendary traders like Toby Crabel and Mark Fisher for decades. The Opening Range with Breakouts & Targets indicator from LuxAlgo automates this approach.
How the Opening Range Works
The Opening Range (OR) establishes the high and low of a trading session’s first 30-60 minutes:
- Opening Range High (ORH): Maximum price in the opening period
- Opening Range Low (ORL): Minimum price in the opening period
- Opening Range Mean (ORM): Midpoint for stop loss placement
The Core Insight: Price behavior relative to this range predicts whether it will be a Range Day (oscillation) or Trend Day (breakout continuation).
How to Trade with Opening Range: Complete Strategy
Breakout Buy Setup
Conditions:
- Wait for the Opening Range period to complete (e.g., first 30 minutes)
- Note the ORH and ORL levels on the chart
- Price breaks ABOVE the ORH with strong momentum
- Green breakout arrow appears
Execution:
- Entry: On the breakout candle close above ORH
- Stop Loss Option 1: At ORM (middle of range)
- Stop Loss Option 2: At ORL (opposite edge of range)
- Take Profit: Use the indicator’s projected targets (based on range width)
Breakout Sell Setup
Conditions:
- Opening Range period completes
- Price breaks BELOW the ORL
- Red breakout arrow appears
Execution:
- Entry: On the breakout candle close below ORL
- Stop Loss: At ORM or ORH
- Take Profit: Projected targets below ORL
Bias Filter for Better Signals
The indicator includes a directional filter:
- Green Zone: Today’s OR is ABOVE yesterday’s OR (bullish bias)
- Red Zone: Today’s OR is BELOW yesterday’s OR (bearish bias)
When enabled, this filter reduces false breakout signals by aligning with the higher timeframe direction.
Target Projection Modes
| Mode | Description | Best For |
| Extended | Shows all surpassed targets | Post-trade analysis |
| Adaptive | Shows nearest 2 targets | Live trading (cleaner view) |
Real Trade Example: EUR/USD London Open
- 8:00-8:30 AM GMT: ORH = 1.0850, ORL = 1.0830
- 9:15 AM: Price breaks above 1.0850 with volume
- Entry: 1.0855 (long)
- Stop Loss: 1.0840 (ORM) = 15 pips risk
- Target 1: 1.0870 (100% of range width) = +15 pips
- Target 2: 1.0890 (200% of range) = +35 pips
- Result: Target 2 hit for +35 pips (2.3:1 reward)
Verdict
Opening Range with Breakouts & Targets

Automates the classic Opening Range Breakout (ORB) strategy used by legendary traders like Toby Crabel and Mark Fisher. It identifies the high/low of a session's first 30-60 minutes, plots breakout levels, and projects profit targets based on the range width. Includes a directional bias filter comparing today's range to yesterday's.
Pros
- Automates a proven, decades-old institutional strategy
- Built-in profit target projection saves calculation time
- Directional bias filter reduces false breakout signals
- Adaptive display mode keeps charts clean during live trading
- Available on MT4 and MT5
Cons
- Only useful during specific session opens (London, NY)
- Ineffective in low-volatility, ranging sessions
- Requires understanding of session timing and time zones
- Not suitable for swing trading or position trading
Summary
This is a professional-grade implementation of a time-tested strategy. The automatic Opening Range detection eliminates manual calculation, while the projected targets (based on range width multiples) give you clear TP levels. The built-in bias filter (green = bullish bias, red = bearish bias) adds a higher-timeframe directional edge. Two display modes — Extended (all targets) and Adaptive (nearest 2 targets) — keep the chart clean during live trading. Ideal for London and New York session opens.
9. Didi Index – Best Breakout Prediction Indicator
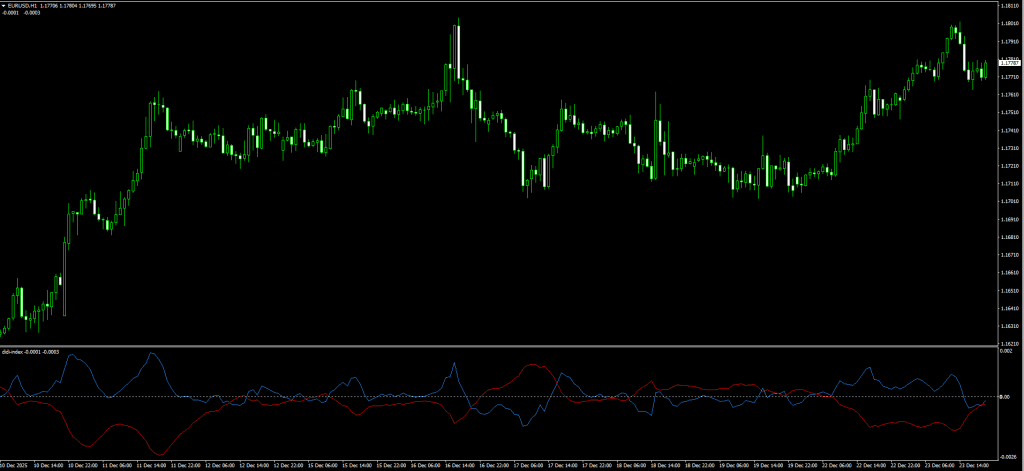
- Best For: Traders who want early warning of explosive moves
- Key Strength: The famous “Agulhada” (Needle) pattern predicts breakouts
The Brazilian Secret
Most Moving Average crossovers are boring by the time the Golden Cross happens, the trend is half over. But in Brazil, legendary analyst Odir “Didi” Aguiar discovered a specific pattern that predicts not just a trend, but a market explosion.
He called it the “Agulhada” (The Needle).
The Didi Index Indicator is the digital version of this setup.
How the Didi Index Works
The indicator displays the relationship between three Simple Moving Averages:
- Fast (White Line): 3-Period SMA
- Medium (Zero Line): 8-Period SMA (acts as the axis)
- Slow (Yellow Line): 20-Period SMA
The Agulhada Pattern: When all three lines converge at a single point and then explode apart, the market is about to make a major directional move.
How to Trade Didi Index: Complete Strategy
The “Bullish Needle” Buy Setup
Pattern Recognition:
- White (fast) and Yellow (slow) lines are converging toward the zero line
- Both lines meet at approximately the same point (the “needle point”)
- White line crosses ABOVE the zero line
- Yellow line is crossing BELOW the zero line (going opposite direction)
Execution:
- Entry: On the candle close when the needle cross completes
- Stop Loss: Below the most recent swing low (typically 20-40 pips)
- Take Profit: When lines start converging again (momentum exhaustion)
The “Bearish Needle” Sell Setup
Pattern Recognition:
- White and Yellow lines are converging toward zero
- Both lines meet at the needle point
- White line crosses BELOW the zero line
- Yellow line is crossing ABOVE the zero line
Execution:
- Entry: On the candle close after needle cross
- Stop Loss: Above the most recent swing high
- Take Profit: When lines start converging again
The Magic Numbers (Settings)
| Parameter | Value | Purpose |
| Short MA | 3 | Captures immediate momentum |
| Medium MA | 8 | The neutral baseline |
| Long MA | 20 | Confirms sustained trend |
These specific values (3-8-20) are not arbitrary they represent the mathematically optimal ratios for detecting explosive moves.
Trade Filter Tips
- Best timeframes: H1 and H4 for optimal signal quality
- Avoid trading when: Lines are parallel (no convergence)
- Strongest signals: When convergence happens near significant price levels
Verdict
Didi Index Indicator
A Brazilian-origin indicator that visualizes the relationship between three Simple Moving Averages (3, 8, 20). Its signature feature is the "Agulhada" (Needle) pattern — a convergence point where all three MA lines meet before exploding apart, predicting an upcoming explosive directional move.
Pros
- Predicts breakouts BEFORE they happen (not after)
- Unique "Agulhada" pattern unlike any other indicator
- Mathematically optimized 3-8-20 SMA ratios
- Simple visual — watch for line convergence then explosion
Cons
- MT4 only — no MT5 version available
- False needles can occur in ranging/choppy markets
- Does not indicate direction — only that a move is coming
- Requires confirmation from price action or another indicator
- Lines being parallel (no convergence) means no signal
Summary
Most MA crossover systems are painfully late — by the time the "Golden Cross" fires, the trend is half over. The Didi Index flips this on its head by identifying the CONVERGENCE phase before the breakout happens. The "Agulhada" needle pattern is visually distinctive and easy to spot. The specific 3-8-20 SMA values are mathematically optimized for detecting explosive moves. Best on H1 and H4 timeframes. A unique tool that does something no other indicator in this list offers.
10. Super Signal Scalping System – Best Multi-Indicator System
- Best For: Scalpers who want visual confluence of multiple indicators
- Key Strength: Combines arrows, Parabolic SAR, and momentum confirmation
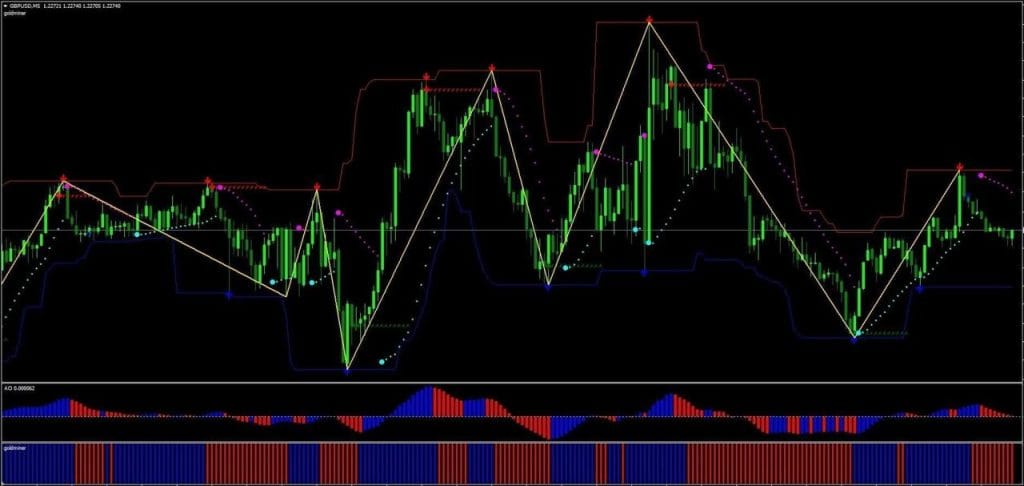
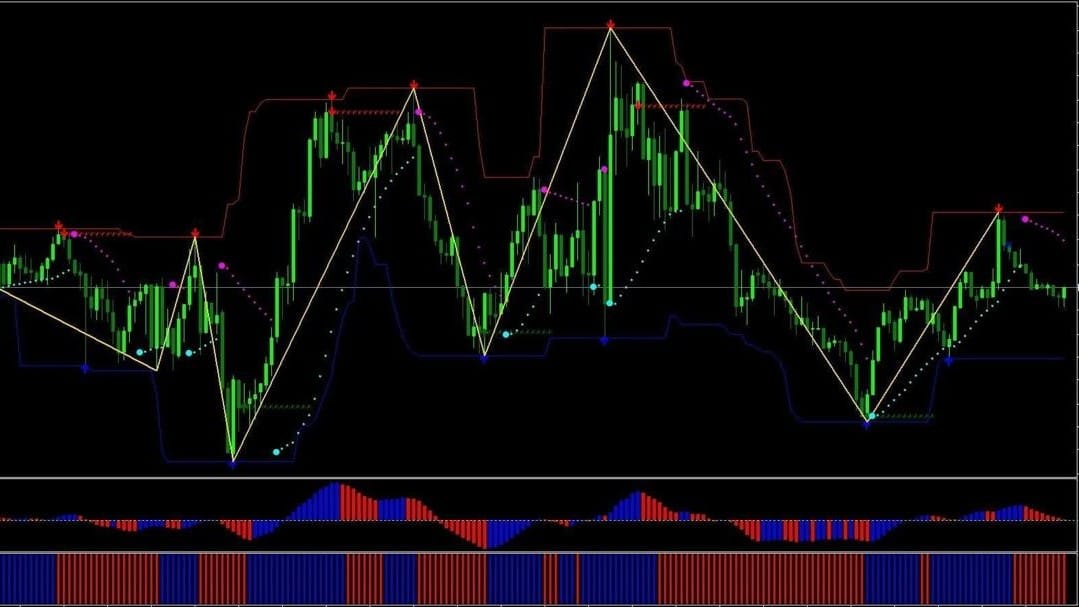
What Is the Super Signal System?
Unlike single-purpose indicators, the Super Signal Scalping System is a complete trading strategy combining multiple visual elements:
- Main Chart Reversals (The “Suns”): Star-shaped icons at potential reversal zones
- Trend Channel: Dynamic red/blue channel showing overextension
- Parabolic SAR: Dotted line as trend direction filter
- Awesome Oscillator: Histogram for momentum confirmation
- Goldminer 2: Additional trend strength histogram
The Multi-Confluence Approach
Critical Rule: Do NOT take every “Sun” or “Star” icon you see. Only trade when ALL conditions line up vertically.
How to Trade Super Signal: Complete Strategy
Long Entry (Buy Signal)
All conditions must be true:
- ☀️ Sun/Star icon appears BELOW price (potential reversal from low)
- Price is ABOVE the trend channel OR touching lower channel limit
- Parabolic SAR dots are BELOW price (uptrend filter)
- Awesome Oscillator bars are BLUE/GREEN (bullish momentum)
- Goldminer 2 histogram is GREEN (bullish confirmation)
Execution:
- Entry: On the candle close when all 5 conditions align
- Stop Loss: Below the Sun/Star icon (the reversal point)
- Take Profit: When any condition breaks (SAR flips, histogram changes)
Short Entry (Sell Signal)
All conditions must be true:
- ☀️ Sun/Star icon appears ABOVE price
- Price is BELOW the trend channel OR touching upper channel limit
- Parabolic SAR dots are ABOVE price (downtrend filter)
- Awesome Oscillator bars are RED (bearish momentum)
- Goldminer 2 histogram is RED (bearish confirmation)
Execution:
- Entry: On the candle close with confluence
- Stop Loss: Above the Sun/Star icon
- Take Profit: When any condition breaks
Handling “Repainting” Signals
Some arrow indicators repaint (the arrows disappear after the candle closes). To avoid this:
- Wait for the candle to close completely before entering
- Confirm with the momentum histograms (they don’t repaint)
- Use pending orders instead of market orders
Best Settings
| Timeframe | Recommended For |
| M5 | Aggressive scalping during high volume |
| M15 | Standard scalping with reduced noise |
| M30 | Conservative scalping for beginners |
Verdict
Super Signal Scalping System
A complete visual trading system that combines 5 separate confluence elements: Main Chart Reversal Icons ("Suns"), a Dynamic Trend Channel, Parabolic SAR, Awesome Oscillator, and Goldminer 2 histogram. All 5 elements must align vertically before entering a trade, providing a high-confluence scalping setup.
Pros
- Complete 5-point confluence system — no extra indicators needed
- Visual layout makes confluence easy to spot at a glance
- High-probability entries when all 5 conditions align
- Multiple timeframe suitability (M5, M15, M30)
Cons
- Some arrow signals may repaint — must wait for candle close
- Requires strict discipline to wait for full confluence
- Multiple sub-windows can crowd smaller screens
- MT4 only — no MT5 version
- Fewer trading opportunities due to strict confluence requirement
Summary
This is a "system in a box" — instead of building your own indicator stack, the Super Signal gives you a pre-configured 5-point confluence setup. The critical rule is discipline: NEVER take a signal unless ALL 5 elements agree. When they do align, the probability is significantly higher than any single indicator. The visual layout makes it easy to see confluence at a glance. Best on M5 and M15 for scalping. Some arrow components may repaint, so always wait for candle close confirmation and verify with the momentum histograms.
How to Install MT4 Indicators
Installing indicators on MetaTrader 4 is straightforward:
Step-by-Step Installation
- Step 1: Download the ‘.ex4’ or ‘.mq4’ file from the source
- Step 2: In MT4, navigate to: File → Open Data Folder
- Step 3: Navigate to: MQL4 → Indicators
- Step 4: Paste the downloaded file into this folder
- Step 5: Close and reopen MetaTrader 4 completely
- Step 6: In the Navigator panel (Ctrl+N), find your indicator under Indicators
- Step 7: Drag and drop it onto your chart
- Step 8: Adjust settings in the dialog window, then click OK
Tip: For detailed help with specific indicators, visit our Forex Indicator Installation Guide.
Best Practices for Using Multiple Indicators
The 3-Indicator Rule
Professional traders rarely use more than 2-3 indicators simultaneously. Overloading your chart creates analysis paralysis and conflicting signals.
Recommended Combinations
For Trend Following:
- TDI RT Alerts (trend direction + entry)
- Chandelier Exit (trailing stop)
For Reversal Trading:
- Wave Trend Oscillator (overbought/oversold)
- TCL BOLL BANDS Trader (mean reversion levels)
For Smart Money Concepts:
- Market Structure Oscillator (BoS/CHoCH)
- TCL SUPER RSI (momentum confirmation)
For Session Trading:
- Opening Range (London/NY opens)
- Didi Index (explosion warning)
Avoid Indicator Redundancy
Don’t use multiple indicators that measure the same thing:
- ❌ RSI + Stochastic + Wave Trend (all momentum oscillators)
- ✅ TDI + Chandelier Exit + Market Structure (different analysis types)
Frequently Asked Questions
Scalping: M1, M5, M15
Day Trading: M30, H1, H4
Swing Trading: H4, D1
Conclusion
Finding the right MT4 indicators is often the deciding factor between consistent profits and frustrating losses. The ten tools we have covered from the all-in-one TDI RT Alerts and the adaptive TCL Super RSI to the Chandelier Exit and Market Structure Oscillator represent the best free, non-repainting options for 2026.
Each indicator here has been tested for accuracy and is designed to fit your specific style, whether you are a scalper hunting for quick M5 entries or a swing trader waiting for high-probability reversals.
Success comes from mastery, not clutter. Start by downloading the ones that match your approach best and combining just two or three strategically. Practice on a demo account until you understand their signals intuitively, and you will be ready to take your trading to the next level.
Related Resources
Browse Indicators by Type
- Trend Indicators – 85+ tools for identifying market direction
- Support & Resistance Indicators – Auto-draw key levels and zones
- Non-Repaint Indicators – 190+ verified non-repainting tools
- Smart Money / ICT Indicators – Order blocks, FVG, BOS & CHoCH
- Pattern Recognition Indicators – Auto-detect chart patterns
- Scalping Indicators – Fast M1–M5 signal tools
- Breakout Indicators – Catch breakouts before they happen
Trading Strategies & Guides
- Scalping Strategies – Complete scalping systems for MT4
- Forex Trading Strategies – Browse all strategy types
- Swing Trading Strategies – H4 & daily timeframe systems
Platform & Setup
- All Free Forex Indicators – Browse the full 660+ indicator library
- MT5 Indicators – All MetaTrader 5 compatible tools
- How to Install Indicators on MT4/MT5 – Step-by-step guide
More Trading Tools
- Gold Trading Indicators & EAs – Tools for XAUUSD trading
- Expert Advisors (EAs) – Automated trading robots
- Binary Options Indicators – Tools for binary trading
- Forex Education Hub – Learn trading from the ground up