
The Supply and Demand Oscillator is a free indicator developed by Trade Code Labs for MetaTrader 4 (MT4) and MetaTrader 5 (MT5) that takes a fundamentally different approach to S&D trading. Instead of drawing the typical rectangular zone boxes on your chart, it runs an ATR-based algorithm in the background to detect institutional buying and selling levels, then converts them into a clean, separate-window oscillator with a simple value between 0 and 100. Readings below 20 indicate price is testing a Demand (support) zone, while readings above 80 signal a Supply (resistance) zone.
This article covers the indicator’s detection logic, smart zone filtering, how to read the oscillator, and where to download it for free.
How It Works – ATR Based Zone Detection
Unlike traditional Auto Supply and Demand indicators that draw rectangular boxes on your chart, this indicator operates entirely in a separate oscillator window. The algorithm works in three stages:
- Stage 1: Scanning Historical Price Action – The indicator scans up to 300 bars back (configurable via the Lookback History input) to identify impulsive price moves, large candles that typically signify institutional buying or selling activity.
- Stage 2: ATR Based Significance Filter – Not every large candle qualifies as a zone. The indicator uses the Average True Range (ATR) to determine if a move is statistically significant relative to current volatility. This is the same volatility measurement used by tools like the Ferru MTF ATR Indicator, but applied here as a zone qualification filter rather than a standalone volatility display.
- Stage 3: Zone to Oscillator Conversion – Once valid Supply and Demand levels are identified, the indicator calculates price’s position relative to these levels and outputs a value between 0 and 100.
Smart “Unbroken” Zone Logic
This is the indicator’s most distinctive feature. If price has already broken through a previous Supply or Demand level, the algorithm ignores that invalidated zone and automatically searches further back in history for the next valid level. This ensures the oscillator always references fresh, untested market structure, similar to how experienced traders manually discard broken support and resistance levels and look for the next relevant zone.
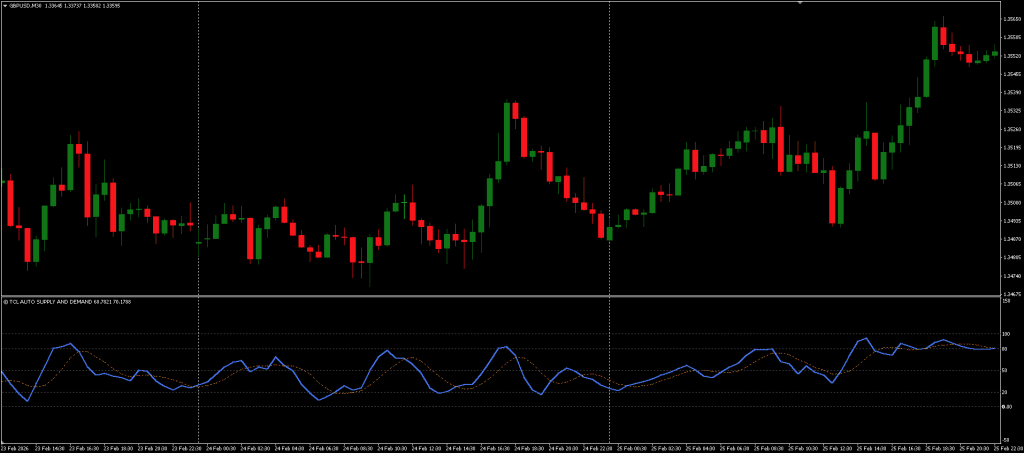
The Supply and Demand Oscillator can be used on any Forex currency pair and other assets such as stocks, commodities, cryptos, precious metals, oil, and gas. It can also be used on any time frame that suits you best, from the 1-minute to the 1-month charts. While traders of all experience levels can use this system, practicing trading on a demo account is recommended until you become consistent and confident enough to go live.
Key Features
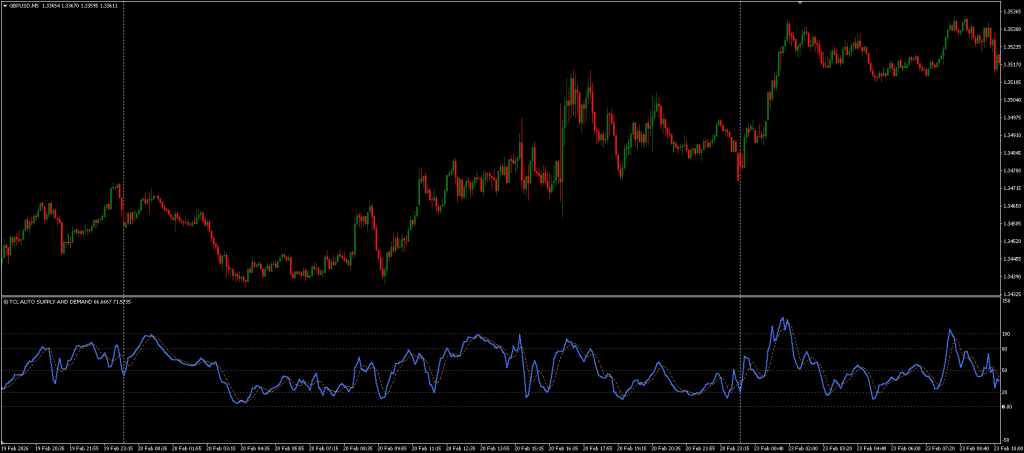
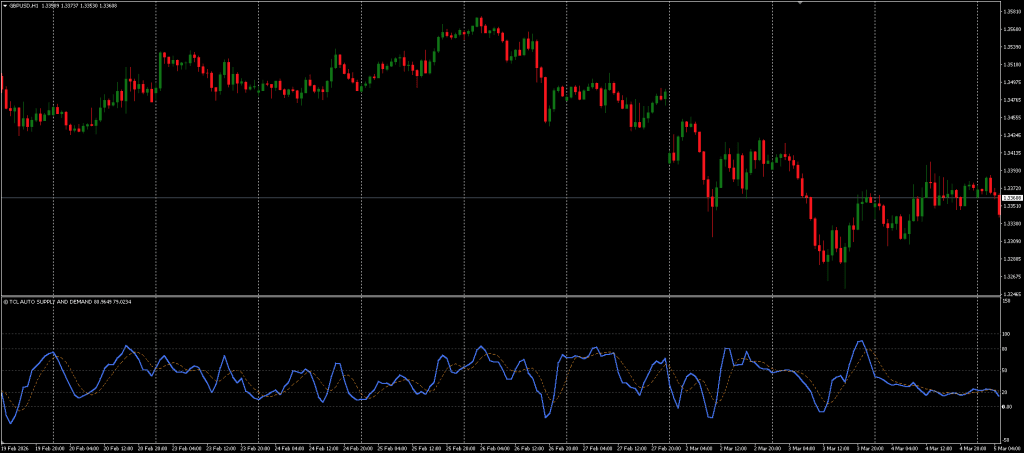
- Oscillator Format – Displays Supply and Demand levels as a clean 0–100 oscillator in a separate window, keeping the main chart uncluttered.
- ATR-Based Detection – Uses Average True Range to identify statistically significant impulsive moves that form institutional zones.
- Smart Unbroken Filtering – Automatically discards broken zones and references only fresh, untested levels.
- Adjustable Sensitivity – The Zone Sensitivity (Multiplier) input lets you filter for major zones only (higher values) or include minor zones (lower values).
- Configurable Lookback – Scan up to 1000 bars back to find valid levels, adjustable via the Lookback History input.
- Non-Repainting – Once a zone is established, it remains fixed. The oscillator measures distance to these fixed points and does not repaint.
- Full Alert System – Receive notifications via pop-up, email, and mobile push when price enters a Supply or Demand zone.
For traders who want to confirm the overall trend direction before trading S&D reversals, the TCL Trend Radar provides multi-timeframe trend alignment, helping you avoid counter-trend trades at Supply or Demand zones.


How to Read the Oscillator
The oscillator operates on a 0–100 scale with three key zones:
- Below 20 (Demand Zone) – Price is testing a valid historical Demand level where institutional buyers previously entered. This is a potential Buy area.
- Above 80 (Supply Zone) – Price is testing a valid historical Supply level where institutional sellers previously entered. This is a potential Sell area.
- Around 50 (Equilibrium) – Price is comfortably between Supply and Demand zones. No immediate reversal signal.
Trading Strategy
- Step 1: Wait for Extreme Readings – Monitor the oscillator for readings below 20 or above 80. These indicate price is physically touching a historical zone where institutional activity previously occurred.
- Step 2: Look for Confirmation – Do not trade the oscillator reading alone. When the value drops below 20, look for a reversal candlestick pattern (pin bar, engulfing candle) on the main chart to confirm the bounce.
- Step 3: Enter the Trade – Once confirmation appears at the zone, enter in the direction of the expected reversal. For position sizing, use a Lot Size Calculator to manage risk properly.
- Step 4: Set Stop Loss Beyond the Zone – Place your Stop Loss slightly beyond the Supply or Demand level. Since the oscillator tells you price is at the zone boundary, your SL should be tight.
- Step 5: Target the Opposite Zone – Use the equilibrium level (50) as a conservative target, or hold for a move toward the opposite zone for a higher reward-to-risk ratio.
As a standalone indicator, its effectiveness often depends on how it’s combined with other tools or strategies. The indicator pairs well with the Bollinger Bands Trader Indicator — when a Demand zone reading coincides with a lower Bollinger Band touch, the probability of a reversal increases significantly.
Supply and Demand Oscillator
A free oscillator based supply and demand indicator for MT4/MT5 that detects institutional zones using ATR and displays them as clean buy/sell levels instead of chart boxes.
Pros
- Oscillator format keeps the main chart completely clean
- Smart "unbroken" logic automatically filters out broken/invalidated zones
- ATR-based detection adapts to volatility, no static thresholds
- Adjustable sensitivity and lookback range
- Non-repainting, zones are fixed once established
Cons
- Oscillator-only display, no zone boxes drawn on the main chart
- Should not be traded alone, requires confirmation from price action or other tools
Summary
This indicator takes a unique approach by transforming complex zone analysis into a simple oscillator reading. The smart "unbroken" zone filtering ensures only fresh, relevant levels are tracked, and the ATR based detection adapts to market volatility. The oscillator format eliminates chart clutter entirely, a significant advantage over traditional box drawing S&D indicators
If you find this indicator useful, consider visiting the indicator’s page on Trade Code Labs to leave a review and show some support for this free tool. You can also submit feature requests and vote for updates directly from that page, the developers actively take user feedback into account for future versions.
FAQ: Frequently Asked Questions
Conclusion
The Supply and Demand Oscillator offers a fresh perspective on zone-based trading by converting traditional support and resistance analysis into a clean oscillator format. The ATR-based detection and smart unbroken zone filtering ensure that only relevant, institutional-grade levels are tracked. However, while the oscillator simplifies the reading, combining it with confirmation tools, such as candlestick patterns, trend filters, or Bollinger Bands, is recommended for more consistent entry timing.