

Most traders react after the move.
You want to be early entering right as momentum flips and exiting before it dies.
The RSI Trend Catcher Signal takes the classic RSI and turns it into a trend direction, momentum strength, and divergence warning system all in a single color-changing line.
Perfect for:
- Scalpers
- Intraday traders
- Swing traders
- Anyone who hates chart clutter
This guide gives you a proven, mechanical approach to get consistent results with it.
Table of Contents
What This Indicator Shows You
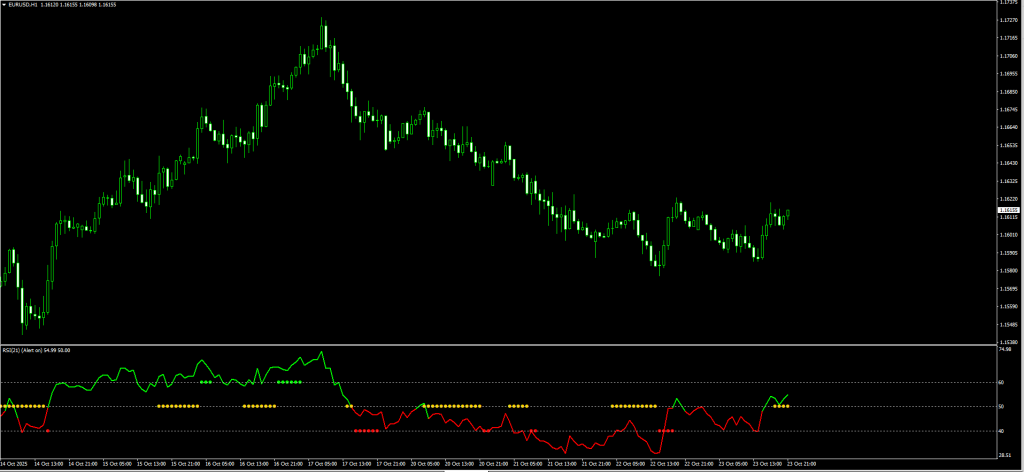
One look at the RSI Trend Catcher Signal and you already know who’s in control buyers, sellers, or nobody. The indicator turns price behavior into a simple traffic-light system you can trust on any timeframe.
Trend Color Guide
| Indicator Color | Meaning | What You Should Do |
|---|---|---|
| Green | Bullish momentum building | Focus on buy setups only |
| Red | Bearish momentum dominating | Look for sell setups only |
| Yellow | Sideways / indecision | Stay patient – no trades |
No hesitation. No over-analysis.
The market tells you when to trade and when to stop.
Bonus Features That Give You Confidence
Along with the trend-color system, you get:
- Overbought & oversold signals – spot exhaustion areas fast
- Bullish & bearish divergence alerts – detect early trend shifts
- Multi market versatility – Forex, Crypto, Stocks & Indices
- No repainting after candle close – reliable trade signals
- Super lightweight – works even on slow PCs & VPS servers
These extras remove guessing and keep your trades simple + objective.
What You Instantly Know Before Entering
With just one glance, you can answer the 3 most important trading questions:
- Is the trend bullish or bearish?
- Is momentum strong or weakening?
- Is this a safe area to enter or avoid?
If all three line up → You take the trade
If not → You stay out and protect your capital
RSI Trend Catcher Forex Strategy

This strategy converts the indicator’s color-based signals into simple, repeatable trading decisions. Follow these three steps for every trade to keep your execution consistent.
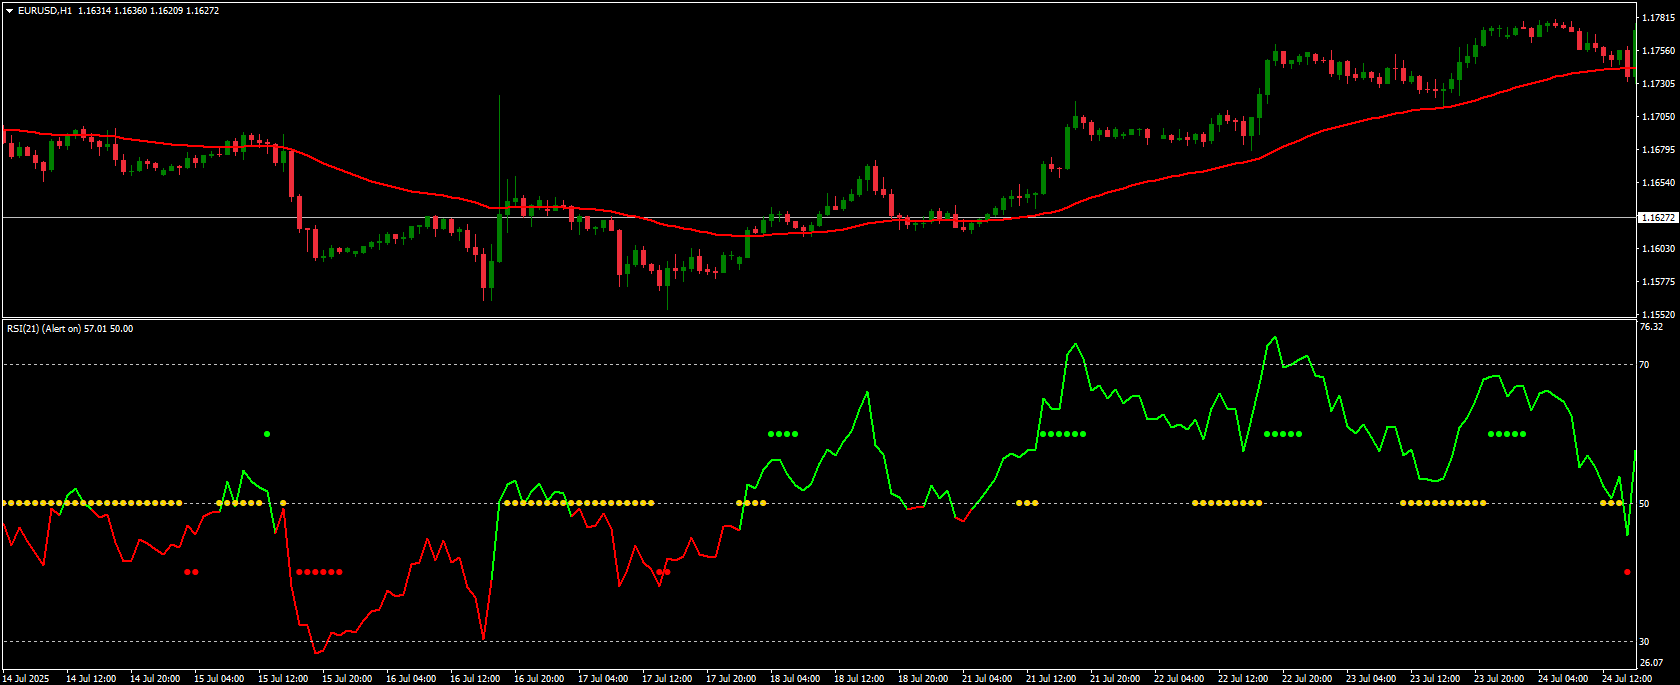
Step 1: Identify the Trend (50 EMA Filter)
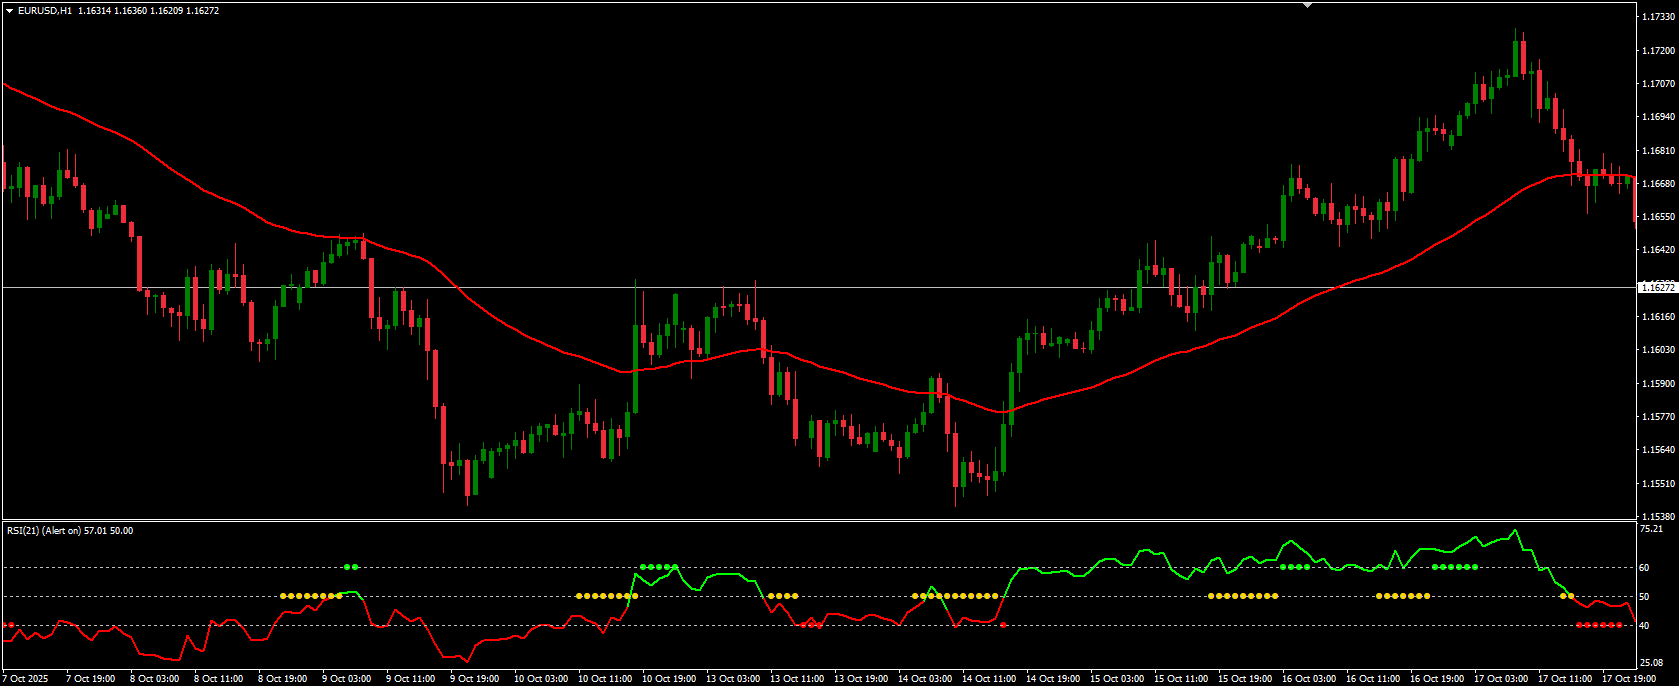
Add a 50 EMA to your chart.
Rules:
- Price above the EMA → Only take buy setups
- Price below the EMA → Only take sell setups
- Price constantly crossing the EMA → Market is choppy → Stand aside
Why it matters:
The EMA filter prevents you from trading against the main trend, which is one of the leading causes of beginner losses. This single rule filters out most low-quality trades and keeps you aligned with true market direction.
Step 2: Select Your Entry Style
Choose the approach that fits the chart conditions. You can specialize in one or combine all three over time.
A) Momentum Continuation Entry
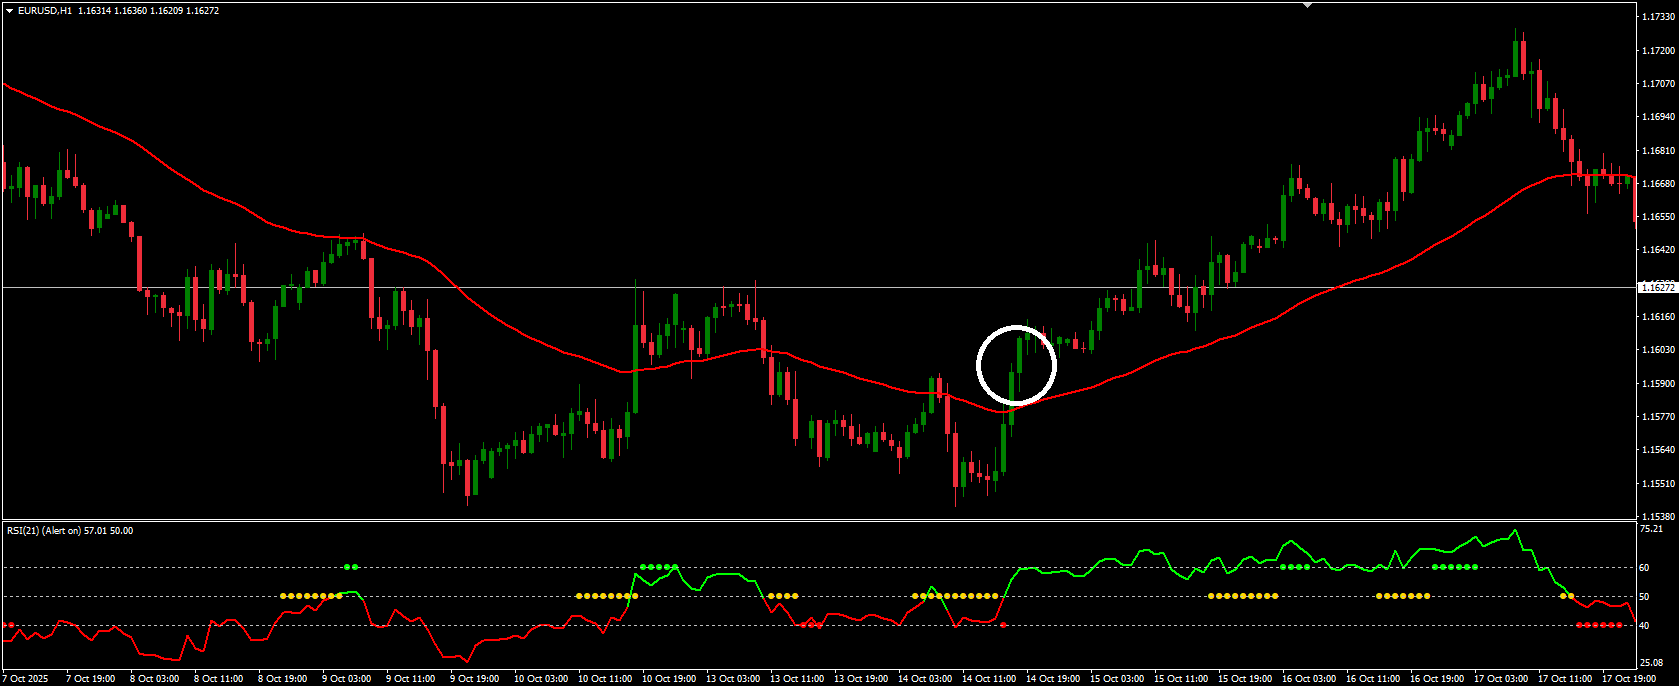
For strong trending markets and higher win rate
Buy Rules:
- Price above 50 EMA
- RSI Trend Catcher line is Green
- A small pullback that does not change the line to Yellow
- Enter when a bullish candle closes in the trend direction
Sell Rules:
- Price below 50 EMA
- RSI Trend Catcher line is Red
- A pullback without turning Yellow
- Enter on a bearish close confirming continuation
Recommended timeframes: M5 to H1
B) Trend Reversal Entry
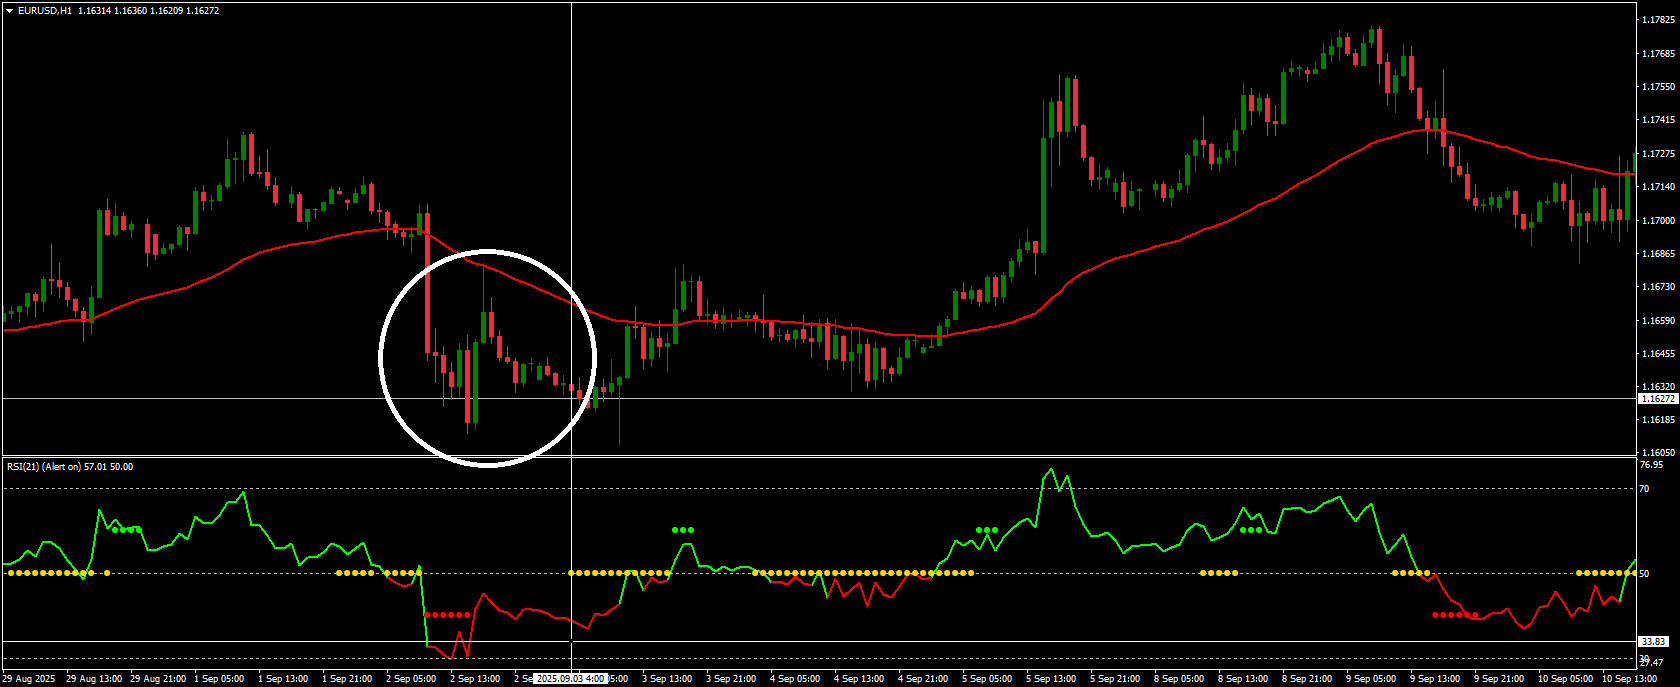
For catching new trends as they begin
Buy Rules:
- RSI dipped below 30 ( oversold condition )
- Line transitions Red → Yellow → Green
- Enter on the first Green candle close
Sell Rules:
- RSI above 70 (overbought condition)
- Line transitions Green → Yellow → Red
- Enter on the first Red candle close
Recommended timeframes: H1 to D1


Download a Collection of Indicators, Courses, and EA for FREE
C) Divergence Confirmation Entry
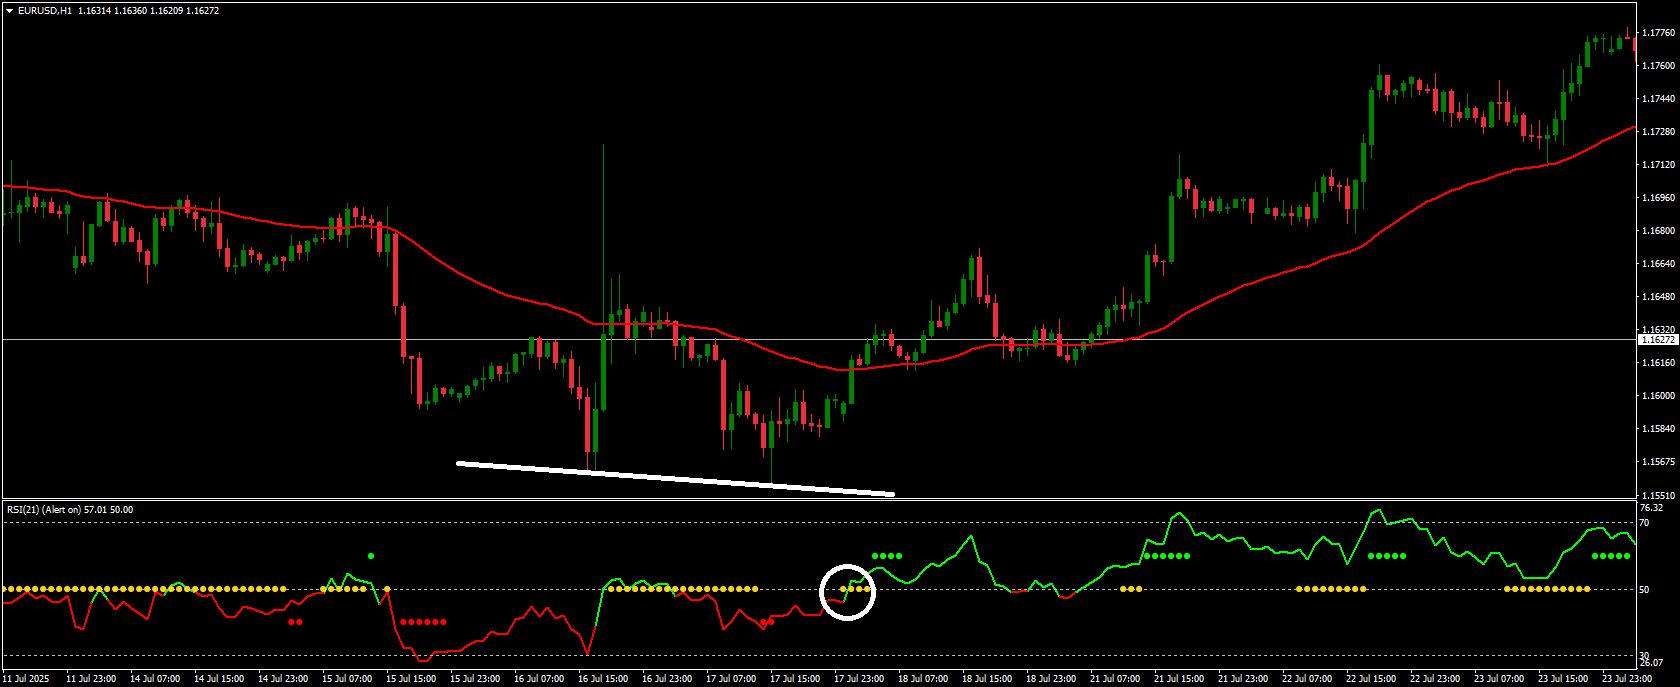
For highest-probability setups
- Bullish divergence followed by a Green flip → Strong long setup
- Bearish divergence followed by a Red flip → Strong short setup
Fewer signals, but higher quality and stronger reward potential.
Step 3: Manage the Trade and Exit Smart
Professional exits are what turn good entries into profitable outcomes.
Stop Loss Placement:
- Beyond the last market structure point (longs below swing low, shorts above swing high)
Take Profit and Trailing Rules:
- TP1: 1R to reduce risk and secure partial profits
- TP2: 2R for solid, planned gains
- Trail stop using ATR(14) x 1.5 once move progresses
- Full exit if the RSI Trend Catcher color flips in the opposite direction
- Partial exit if the line turns Yellow, signaling momentum loss
Well-defined money management removes emotional errors and protects you from giving back wins.
Best Timeframes and Markets for RSI Trend Catcher
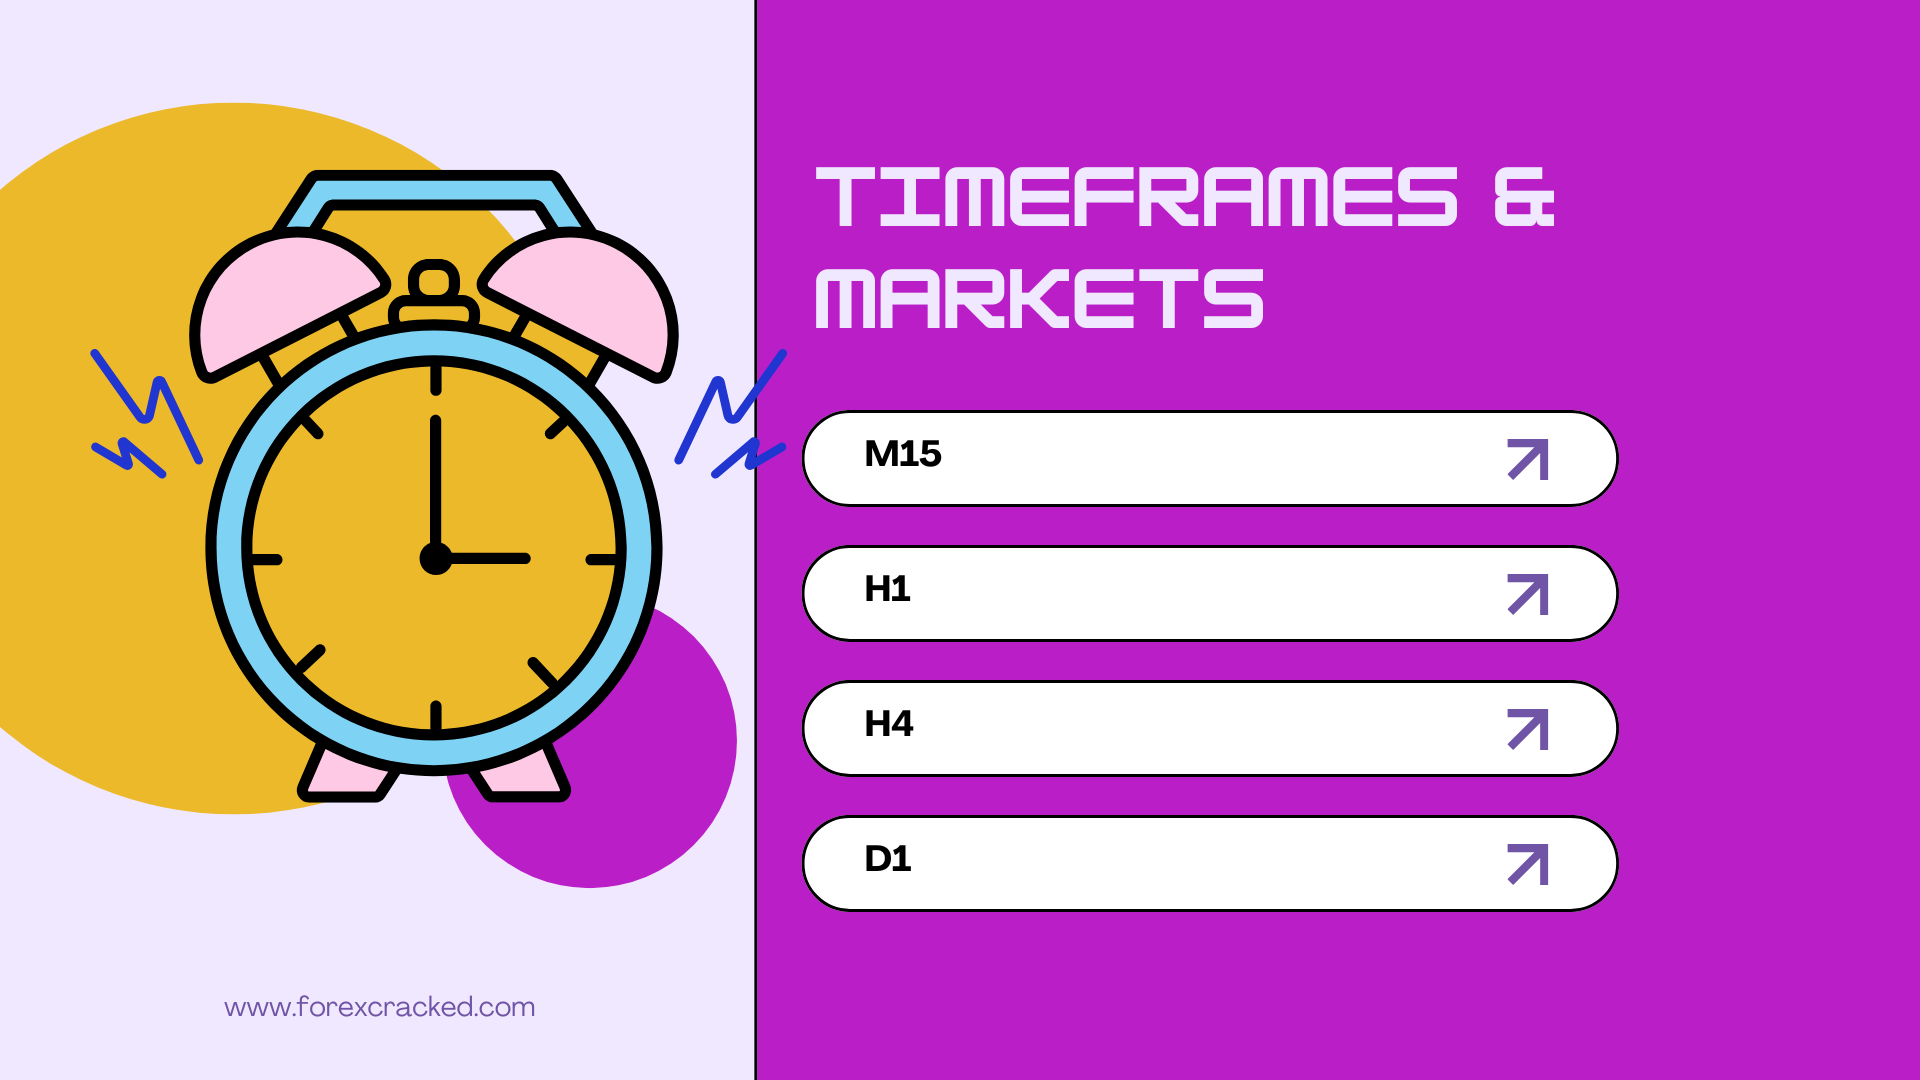
You can use this strategy across multiple markets and chart speeds, but choosing the right timeframe for your style improves both accuracy and consistency. Here’s a straightforward breakdown to help you trade the indicator at its strongest.
Timeframe Selection Based on Trading Style
| Trading Style | Suggested Timeframes | Characteristics |
|---|---|---|
| Scalping | M5, M15 | Faster entries, smaller but frequent profit targets |
| Day Trading | M15, H1 | Ideal mix of clean signals and manageable trade duration |
| Swing Trading | H4, D1 | Larger movements, fewer trades, higher per-trade reward |
How to choose:
- If you like quick decisions → use lower timeframes
- If you prefer less screen time and bigger moves → go higher
The indicator adapts well to volatility, but signals on higher timeframes tend to be more reliable due to reduced market noise.
Market Types Where the Indicator Performs Well
The RSI Trend Catcher Signal is designed to work on any asset that trends or ranges with structure. It is most commonly used on:
- Major and minor Forex pairs
- Cryptocurrency pairs such as BTC, ETH
- Metals like Gold (XAUUSD) and Silver
- Indices including NASDAQ, S&P 500, DAX
- Some stocks and synthetic assets on MT4 brokers
Why it works across markets:
The strategy depends on momentum shifts and trend behavior, which are universal price dynamics not limited to a single asset class.
Practical Tip: When trading markets with higher volatility (e.g., crypto or gold), apply slightly wider stops or use ATR-based trailing to avoid premature exits.
Common Mistakes to Avoid When Using RSI Trend Catcher
Even the best strategy can fail if applied incorrectly. These are the most frequent errors traders make when using the RSI Trend Catcher Signal, and avoiding them will instantly improve performance.
1. Taking Trades During Yellow Zones
Yellow signals indicate a range or indecision phase.
Price is unclear, liquidity is low, and signals often fail.
If you trade here, expect choppy movement and unnecessary losses.
Simple rule:
If the line is Yellow, do nothing.
2. Entering Reversal Trades Without Divergence
Reversal setups require evidence of exhaustion before taking the other side of the trend.
Without divergence, a market can stay overbought or oversold far longer than expected.
Only enter reversals when:
- RSI flips color from an extreme zone
- Divergence confirms momentum weakening
3. Ignoring the EMA Trend Direction
Skipping the 50 EMA filter puts you directly against the main trend.
This usually results in chasing tops or bottoms and losing trades quickly.
EMA rule:
Trade only in the direction the EMA is pointing.
4. Moving Stop Loss Too Early
Stops protect the strategy.
If you drag them up too quickly, normal pullbacks will kick you out before the move continues.
Let structure and ATR-based trailing guide your exits.
5. Forcing Trades Just Because RSI Looks High or Low
RSI alone does not mean the trend will reverse.
In strong momentum phases, price can remain “overbought” or “oversold” while continuing further.
Follow the color + EMA + structure checklist instead of trying to predict tops.
Bottom Line
Your job is to trade high-probability conditions, not every flicker on the chart.
Follow the system rules, stay patient, and the indicator will provide clear opportunities without forcing trades.
Frequently Asked Questions (FAQ)

u003cstrongu003eDoes this indicator repaint?u003c/strongu003e
No. Once a candle closes, the signal and color state remain fixed. This gives you reliable entries without worrying about shifting or disappearing signals.
u003cstrongu003eIs the RSI Trend Catcher suitable for beginners?u003c/strongu003e
Yes. The color-based logic simplifies trend reading. Even traders with limited experience can quickly understand when to buy, sell, or wait. The indicator is also lightweight and does not crowd your chart.
u003cstrongu003eWhat are the best settings to use?u003c/strongu003e
Default settings work very well. The only recommended addition is a u003cstrongu003e50 EMAu003c/strongu003e trend filter to ensure entries align with the dominant market direction.
u003cstrongu003eWhich timeframe should I choose to start with?u003c/strongu003e
If you are a beginner, start with u003cstrongu003eM15 or H1u003c/strongu003e timeframes. They provide cleaner signals and reduce noise compared to very low timeframes like M1 or M5.
u003cstrongu003eDoes it work on all markets?u003c/strongu003e
Yes. The strategy performs across Forex pairs, gold, indices, and even crypto. Just adjust trade management slightly for higher-volatility assets like BTC or XAUUSD.
Conclusion
Combined with the 50 EMA trend filter and the entry rules, it becomes a complete trading framework you can rely on across different markets and timeframes.
Like any strategy, consistency comes from repetition. Use this playbook, review your results weekly, and refine your approach as you gain real chart experience. Over time, the system helps you build discipline, take fewer low-quality trades, and stay focused on the setups that truly matter.
Put it on your chart.
Follow the rules.
Review weekly, scale confidence.
Thanks admin looking good!