The Cumulative Delta Forex Indicator for MT4/MT5 is one of the most powerful tools for traders who rely on volume analysis to anticipate market direction. It helps traders see the balance between buying and selling pressure in real time, revealing what’s really happening behind price movements.
Unlike standard volume bars, which show total trading activity, the Cumulative Delta indicator breaks that volume down into buy (demand) and sell (supply) components. This gives traders an edge in identifying when smart money is entering or exiting the market, often before the price reacts.
It’s a favorite among professional forex and stock traders who want to track momentum shifts, confirm trend strength, and time their entries in relation to institutional activity.

What Is the Cumulative Delta Indicator?
The Cumulative Delta MT4/MT5 Indicator measures the difference between buy volume (market orders executed at the ask price) and sell volume (orders executed at the bid price).
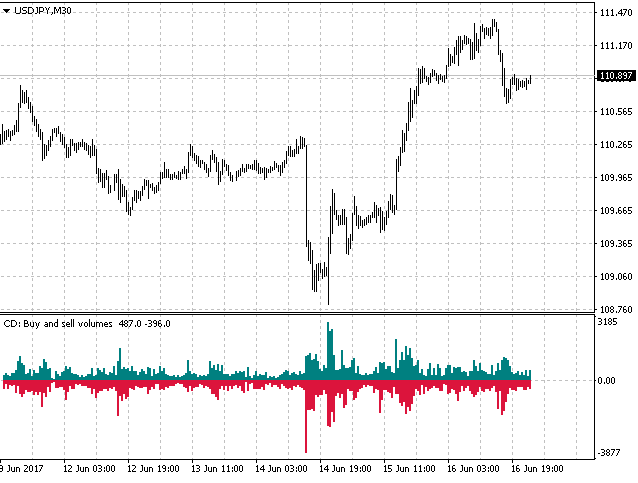
This cumulative difference is then plotted as volume bars above or below a zero line:
- Gray bars above zero represent increasing demand or bullish pressure.
- Blue bars below zero indicate rising supply or bearish pressure.
By tracking these shifts, the indicator helps traders visualize where buying or selling is dominating, which often precedes significant price reversals or breakouts.
It’s an ideal tool for day traders, intraday scalpers, and swing traders who want to analyze market depth and volume imbalance in real-time.
How the Cumulative Delta Works
The indicator automatically accumulates the difference between buying and selling volumes and displays them in histogram form.
- When the bars rise above zero, it means buyers are in control, and demand outweighs supply.
- When the bars drop below zero, it signals that sellers are dominating, and supply exceeds demand.
This simple visual helps traders confirm whether the market’s momentum aligns with price action.
You can also customize the indicator to display cumulative delta data across different timeframes, such as daily, weekly, or monthly, to gain a broader perspective on the overall trend.
Cumulative Delta Buy Signal
A buy signal is generated when:
- The indicator starts printing gray bars above the zero line, showing a rise in demand.
- Price action confirms the momentum shift with bullish candles or breakout formations.
- The increase in positive delta volume continues across multiple timeframes (MTF confirmation).
Pro Tip: Combine this setup with a support bounce or bullish candlestick pattern to strengthen your entry.
Cumulative Delta Sell Signal
A sell signal appears when:
- The indicator shows blue bars below the zero line, indicating growing selling pressure.
- Price action confirms a bearish trend with bearish candles, lower highs, or a breakdown of support.
- The negative delta volume expands consistently, confirming a shift in momentum to the downside.
Pro Tip: When you see a bearish pin bar followed by strong blue bars below zero, it’s a high-probability sell setup often signaling the start of a strong downtrend.
Download a Collection of Indicators, Courses, and EA for FREE
Trading Example

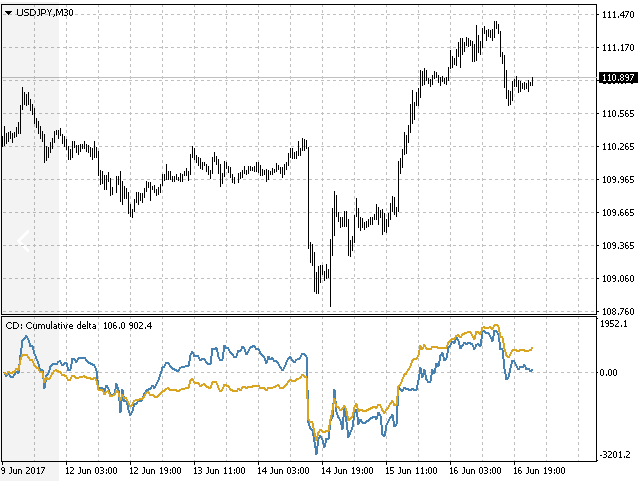
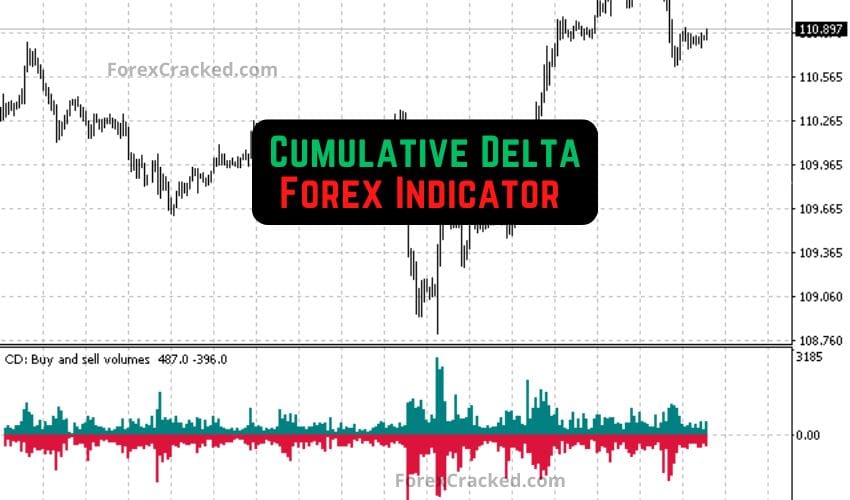
In the USD/JPY 30M chart example, the market printed a large bearish pin bar while the Cumulative Delta indicator showed a sharp increase in negative volume (blue bars below zero). This confirmed selling dominance, and the price followed with a strong downward move.
Later, as the price found support, the indicator began showing rising gray bars above zero, confirming that demand exceeded supply. The price reversed upward, starting a sustained bullish trend.
This example shows how effectively the Cumulative Delta Indicator can anticipate trend reversals and momentum shifts before they become apparent on the chart.
Why Traders Love the Cumulative Delta
The beauty of this indicator lies in its simplicity and depth. It allows you to see real-time market sentiment and confirm whether price action is truly supported by volume.
Key Benefits:
- Tracks buy vs. sell volume in real time.
- Highlights supply and demand imbalances clearly.
- Works on forex, stocks, indices, metals, and commodities.
- Excellent for intraday, scalping, and swing trading.
- Multi-timeframe (MTF) support analyzes daily, weekly, and monthly volume trends.
- Helps identify fake breakouts and confirm real trend continuation.
Tips for Better Accuracy
- Combine Cumulative Delta with price action or candlestick signals for confirmation.
- Watch for divergence between price and delta volume; it often signals early reversals.
- Use higher timeframe confirmation to avoid false short-term signals.
- Pair it with indicators like the ADX or Volume Profile for a deeper understanding of the market context.
Free Download Cumulative Delta Forex Indicator
Read More AO Divergence Forex Indicator – Awesome Oscillator Divergence Trading Tool
Conclusion
The Cumulative Delta Forex Indicator for MT4/MT5 is a must-have tool for traders serious about understanding market behavior through volume dynamics.
By highlighting where demand overtakes supply (and vice versa), it gives traders the insight to anticipate trend changes and trade in alignment with professional money flow.
Whether you trade intraday or hold swing positions, this indicator helps you make smarter, volume-backed trading decisions.
Download the Cumulative Delta Forex Indicator for MT4/MT5 today and start seeing the market through the lens of true supply and demand power.
Frequently Asked Questions (FAQ)
1. What does the Cumulative Delta measure?
It measures the difference between buy and sell volume to identify whether buyers or sellers are dominating.
2. Does it work for all markets?
Yes, it’s compatible with forex, stocks, indices, and metals.
3. Is it beginner-friendly?
Absolutely. The visual histogram makes it easy to interpret, even for new traders.
4. Can I use it with price action?
Yes, in fact, combining it with price structure or candlestick patterns enhances accuracy.
5. What timeframe works best?
It works on all timeframes, but most traders prefer H1, H4, and daily charts for clear volume trends.


Google DR cant download.can u change up adress?