

If you’re serious about support and resistance trading, the Pulse Fibonacci Pivot Forex Indicator for MT4 is a tool you’ll want in your arsenal. I’ve used dozens of pivot indicators over the years, but this one stands out because of its Fibonacci-based approach. It’s simple, smart, and built with precision in mind—exactly what we need in volatile market conditions.
Unlike standard pivot tools that spit out the same levels daily, this one uses Fibonacci ratios to calculate pivots, support and resistance. That gives it an edge in identifying high-probability reaction zones on the chart.
How the Pulse Fibonacci Pivot Forex Indicator Works
The indicator calculates levels based on the previous day’s high, low, and close, but what sets it apart is the Fibonacci logic behind each level.
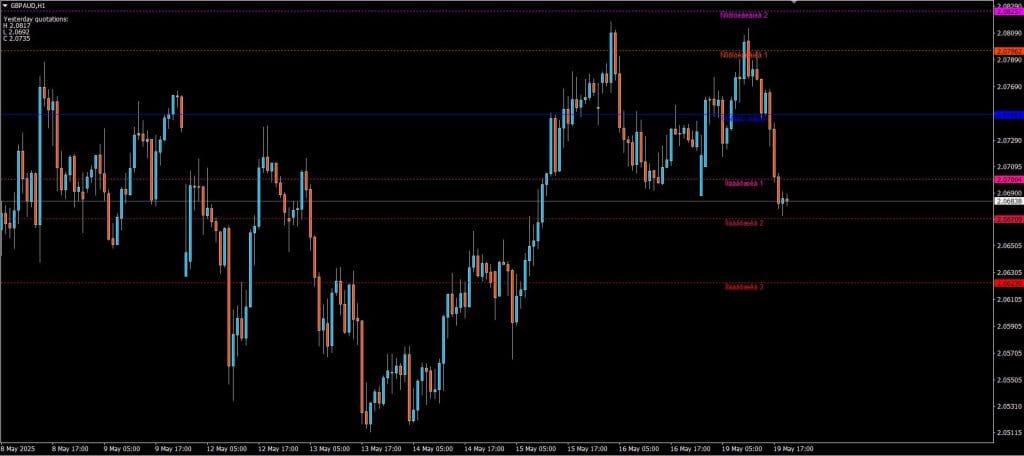
Once applied to your MT4 chart, you’ll see:
- A blue central pivot line – Consider this the day’s equilibrium. If the price is trading above it, market sentiment leans bullish. If it’s below, we’re looking at bearish pressure.
- Three pink support levels (S1, S2, S3) – These are calculated using Fibonacci ratios and act as potential bounce zones.
- Three orange resistance levels (R1, R2, R3) – Price often reacts here with pullbacks or reversals, especially during extended runs.
These plotted lines are dynamic and update daily based on recent price action. That’s why this indicator fits perfectly for intraday and swing traders alike.


Download a Collection of Indicators, Courses, and EA for FREE
How I Use It in My Trading
Here’s how I typically use this indicator in my day-to-day setups:
Buy Setup
- Check if price is above the central pivot – This suggests bullish momentum.
- Look for entries near S1 or S2 – Especially if the price has retraced after a breakout and shows bullish rejection patterns like pin bars or bullish engulfing candles.
- Stop-loss goes just below the support level.
- Take-profit can be set at R1 or higher, depending on momentum.
Sell Setup
- Price trades below the pivot – That’s your bearish signal.
- Watch for pullbacks to R1 or R2, especially if followed by bearish reversal candles.
- Stop-loss goes above the resistance level.
- Take-profit targets the next Fibonacci support zone.
This strategy gives me clear entry zones and eliminates much guesswork.
Pro Tip
The best trades happen when these levels align with other signals, like trendline breaks, moving average crossovers, or even candlestick patterns. I always look for confluence. If, for example, the price bounces from S1 and forms a hammer near a 200 EMA, that’s a long setup with high probability in my book.
Free Download Pulse Fibonacci Pivot Forex Indicator
Read More Vigorous MT4 Forex Robot FREE Download
Final Thoughts
The Pulse Fibonacci Pivot Forex Indicator has become one of my go-to tools when prepping for the London or New York sessions. It’s not flashy, and that’s exactly why I love it. It gives you levels that matter, drawn from Fibonacci math, which has stood the test of time in trading.
If you thrive on structure and want to anchor your trades around logical price zones, this indicator will fit right into your workflow.
Whether you’re a seasoned trader or just starting, try it. Install it, test it out during live sessions or on a demo, and you’ll quickly see how effective these pivot levels can be.
Key Benefits
- Fibonacci-based pivots for greater accuracy
- Automatically plots daily S/R levels
- Ideal for intraday, swing, and breakout traders
- No repainting – levels remain stable once plotted
- Easy to read and clutter-free on the chart