

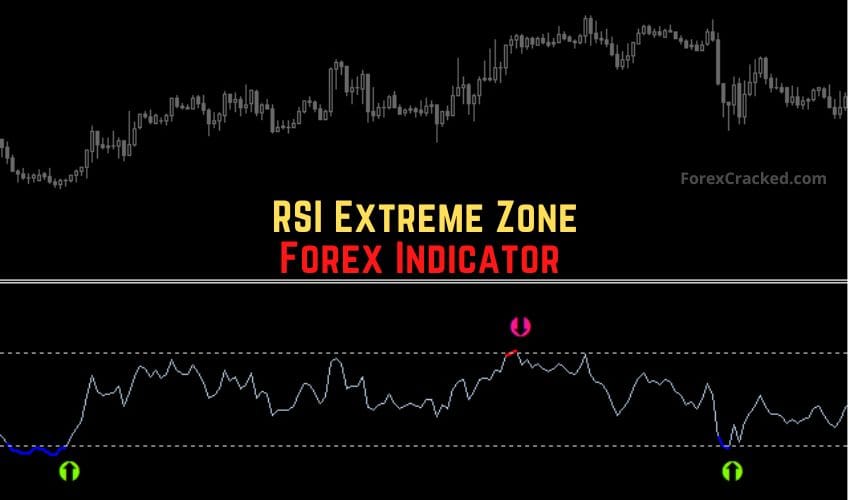
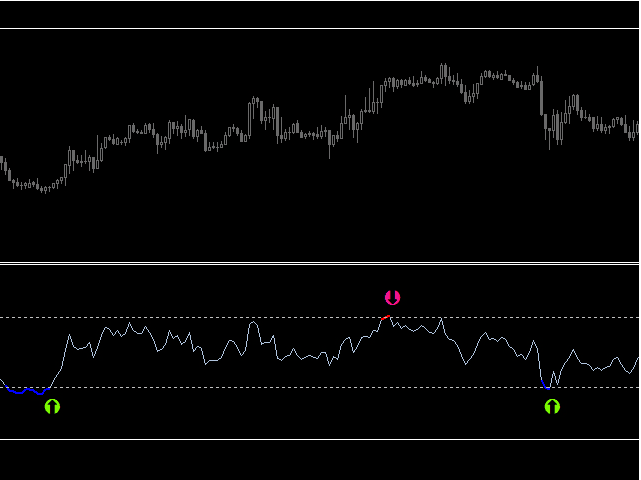
The RSI Extreme Zone Indicator for MT4 takes the classic Relative Strength Index (RSI) concept and enhances it with visual alerts and real-time reversal signals. Instead of just showing when the market is overbought or oversold, this version goes a step further it highlights extreme price zones, color-codes the RSI line, and even plots BUY and SELL arrows to help traders catch reversals early.
Whether you’re trading short-term swings or long-term reversals, this indicator gives you a clear view of trend strength, exhaustion zones, and entry timing all in one simple visual display.
What Is the RSI Extreme Zone Indicator?
At its core, the RSI Extreme Zone Indicator works just like the traditional RSI it measures price momentum and identifies when the market is overbought or oversold.
However, this upgraded version adds:
- Dynamic color changes for easy trend interpretation.
- BUY/SELL arrows marking confirmed reversal points.
- Improved visual zones for spotting extremes with accuracy.
When the RSI line rises above the centerline (50), it suggests bullish momentum and a likely continuation of the uptrend. Conversely, when the line falls below 50, it signals bearish strength and a continuing downtrend.
But the real power of this tool lies in its extreme zones:
- When RSI moves into the overbought zone (typically above 70) → expect a potential downward reversal.
- When RSI drops into the oversold zone (below 30) → prepare for a bullish turnaround.
How to Trade Using the RSI Extreme Zone Indicator
Trading with this indicator is straightforward it gives trend direction and reversal entry signals at a glance.
Buy Signal (Bullish Reversal)
- Wait for the RSI line to enter the oversold area (below 30).
- When the indicator changes color to blue and a green upward arrow appears, prepare to buy.
- Enter a long trade at the candle close and place your stop loss just below the recent swing low.
Pro Tip: Confirm your entry with bullish candlestick patterns such as a hammer or engulfing bar for higher accuracy.
Sell Signal (Bearish Reversal)
- Wait for the RSI line to enter the overbought area (above 70).
- When the line turns red and a yellow downward arrow appears, prepare to sell.
- Enter a short position at candle close with a stop loss above the recent high.
Pro Tip: Combine with trendline resistance or Fibonacci retracements to filter out weak reversal setups.


Download a Collection of Indicators, Courses, and EA for FREE
Example: USD/JPY Reversal Setup
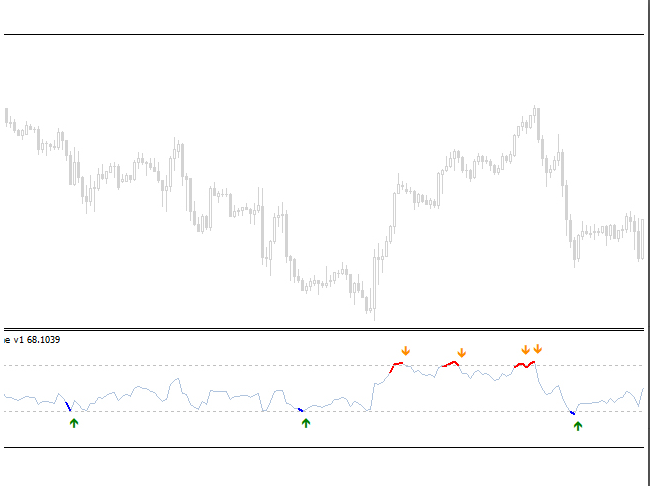
In the example of USD/JPY, the RSI Extreme Zone Indicator posted a BUY signal after the RSI dipped into the oversold region during a sharp downtrend. The indicator line turned blue and printed a green arrow signaling a bullish reversal.
Within hours, the price rallied over 250 pips, showing how effective this setup can be when the market transitions from exhaustion to strength.
Later, a SELL signal appeared when the RSI reached the overbought level. The line switched to red and displayed yellow arrows predicting the following bearish retracement perfectly.
Exit Strategy & Risk Management
Like any trading system, using proper exit rules and risk control is key:
- Close long trades when the RSI reaches the overbought zone or a SELL arrow appears.
- Close short trades when RSI enters the oversold zone or a BUY arrow forms.
- Always maintain at least a 1:2 risk-to-reward ratio.
The RSI Extreme Zone is best used on H1, H4, and D1 charts, but intraday traders can also benefit from it on lower timeframes like M15 or M30.
Advantages of the RSI Extreme Zone Indicator
- Highlights overbought and oversold zones automatically.
- Plots visual BUY/SELL arrows at key reversal points.
- Easy-to-read color-coded RSI line for trend strength.
- Suitable for all trading styles scalping, swing, or position trading.
- Works on all MT4-supported assets: Forex, Crypto, Indices, and Metals.
Limitations
- Can produce false reversals in choppy or sideways markets.
- Works best when combined with confluence tools like support/resistance, Fibonacci levels, or volume indicators.
Free Download RSI Extreme Zone Forex Indicator
Read More Double Stochastic RSI Forex Indicator FREE Download
Conclusion
The RSI Extreme Zone Indicator for MT4 is an enhanced version of one of the most reliable momentum tools ever created. It gives traders visual clarity, automatic reversal alerts, and clear directional bias all in real-time.
By color-coding RSI levels and adding arrow-based entry points, it makes spotting reversals easier, faster, and more precise.
If you rely on RSI for trading momentum, this version is a must-have upgrade.
Download the RSI Extreme Zone Forex Indicator for MT4 today and start identifying profitable reversal zones with confidence.
Frequently Asked Questions (FAQ)
1. Does the RSI Extreme Zone repaint?
No, once a signal candle closes, arrows and color changes remain fixed.
2. Can I use it for scalping?
Yes, it works well on M5 and M15 when paired with trend filters.
3. What assets does it support?
All Forex, Crypto, Indices, Commodities, and Stocks.
4. Is it beginner-friendly?
Absolutely. The visual design makes it simple to interpret even for new traders.
5. Can I combine it with other indicators?
Yes, it works well with tools like MACD, Moving Average, and Bollinger Bands.