

Finding the perfect balance between trend identification, momentum analysis, and volatility measurement typically requires juggling multiple indicators on your chart. But what if one powerful tool could deliver all three perspectives simultaneously? Enter the TDI RT Alerts Divergence Indicator – a comprehensive trading system that combines the best elements of RSI, moving averages, and Bollinger Bands into one elegant package.
In this in-depth review, we’ll explore how the TDI indicator works, break down each component line, and show you exactly how to build profitable trading strategies using this versatile tool.
This indicator was featured in our Top 10 Best Free MT4 Indicators for 2026 — read the full comparison with expert reviews and trading strategies.
What is the TDI RT Alerts Divergence Indicator?
The Traders Dynamic Index (TDI) first emerged in 2005 when trader Dean Malone sought to create a single indicator that could replace an entire dashboard of trading tools. His solution was brilliant: combine the trusted RSI oscillator with moving average smoothing and Bollinger Band volatility measurement.
The result? A hybrid indicator that tells you:
- Trend direction (bullish or bearish)
- Trend strength (strong momentum or weak consolidation)
- Market volatility (expanding or contracting)
- Entry and exit signals (crossover-based)
Unlike standard RSI indicators that simply oscillate between overbought and oversold levels, the TDI RT Alerts Divergence version adds real-time alerts and divergence detection, making it significantly more actionable for active traders.For those seeking non-repaint indicators, this tool delivers reliable signals that remain fixed after candle close.
Understanding the TDI Lines: Complete Breakdown
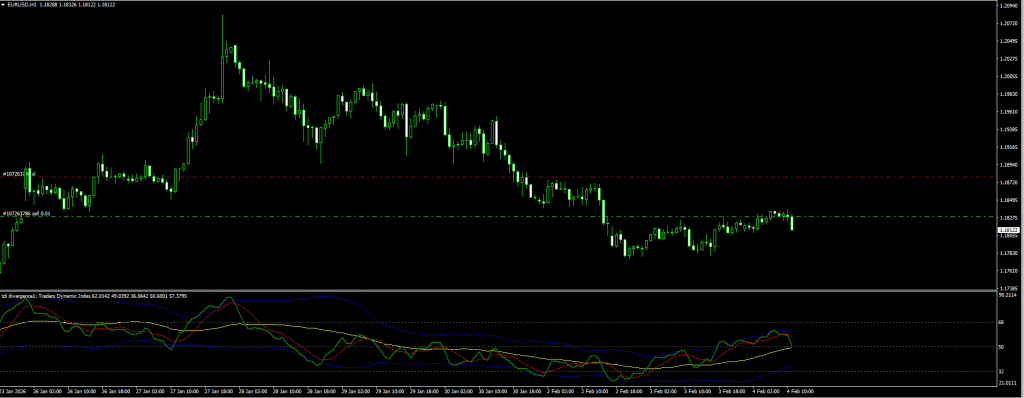
The TDI indicator displays five distinct lines, each serving a specific analytical purpose:
🟢 Green Line (RSI Price Line)
This is the heart of the indicator – a smoothed RSI that reflects current market sentiment. When the green line rises, buyers are in control. When it falls, sellers dominate. Think of it as a real-time pulse of price momentum.
🔴 Red Line (Trade Signal Line)
The red line is a moving average of the green line, creating crossover opportunities. When green crosses above red, it signals potential bullish momentum. When green crosses below red, bearish pressure is building.
🟡 Yellow Line (Market Base Line)
This is the anchor line representing overall market direction. The yellow line moves slowly and indicates the dominant long-term trend. Price consistently above the yellow line suggests a bullish environment; below suggests bearish.
🔵 Upper & Lower Blue Lines (Volatility Bands)
Similar to Bollinger Bands, these blue lines expand during high volatility and contract during consolidation. When the bands squeeze tight, expect a breakout. When they’re wide apart, the market is already moving aggressively.For more precise volatility measurement, you can also use the Volatility Ratio Indicator alongside TDI.
How to Read TDI Signals
Identifying Trend Direction
Bullish Trend Conditions:
- Green line positioned above both yellow and red lines
- All lines sloping upward
- Price action making higher highs
Bearish Trend Conditions:
- Green line positioned below both yellow and red lines
- All lines sloping downward
- Price action making lower lows
Measuring Trend Strength
The slope of the green line reveals momentum intensity:
- Steep slope = Strong momentum, high conviction moves
- Flat slope = Weak momentum, choppy conditions
- Curving slope = Potential reversal forming
Reading Volatility
Watch the blue Bollinger-style bands:
- Expanding bands = Increasing volatility, trend continuation likely
- Contracting bands = Decreasing volatility, breakout imminent
- Extremely tight bands = Major news event approaching, consider staying flat
TDI RT Alerts Trading Strategies
Strategy 1: TDI Crossover Buy Setup
Entry Conditions:
- Green line crosses above the red line
- Both green and red lines are above the yellow line (confirms uptrend)
- Wait for a bullish candlestick to confirm entry
- Volatility bands should be expanding (not contracting)
Stop Loss: Place below the most recent swing low
Take Profit: Exit when green line crosses back below the red line, or when green reaches the upper volatility band
Strategy 2: TDI Crossover Sell Setup
Entry Conditions:
- Green line crosses below the red line
- Both green and red lines are below the yellow line (confirms downtrend)
- Wait for a bearish candlestick to confirm entry
- Volatility bands should be expanding
Stop Loss: Place above the most recent swing high
Take Profit: Exit when green line crosses back above the red line, or when green reaches the lower volatility band
Strategy 3: TDI Divergence Trading
The “RT Alerts Divergence” feature is particularly powerful for catching reversals:
Bullish Divergence:
- Price makes a lower low
- TDI green line makes a higher low
- Signal: Potential bullish reversal
Bearish Divergence:
- Price makes a higher high
- TDI green line makes a lower high
- Signal: Potential bearish reversal
Pro Tip: Combine divergence signals with support/resistance levels for higher probability setups.
Recommended Settings
| Parameter | Default | Aggressive | Conservative |
|---|---|---|---|
| RSI Period | 13 | 8 | 21 |
| RSI Price | Close | Close | Close |
| Volatility Band Period | 34 | 20 | 50 |
| Signal Line Period | 2 | 2 | 3 |
| Trade Line Period | 7 | 5 | 9 |
Best Timeframes: H1, H4, Daily (avoid lower timeframes due to noise)
Best Pairs: Major pairs with stable volatility (EURUSD, GBPUSD, USDJPY, AUDUSD). Use our Currency Correlation Indicator to avoid trading correlated pairs simultaneously.
TDI Indicator Pros & Cons
✅ Pros
- All-in-one solution – Replaces multiple indicators
- Clear visual signals – Easy to interpret crossovers
- Divergence alerts – Catches reversals early
- Non-repainting – Signals remain fixed after candle close
- Works on all timeframes – Versatile application
- Free download – No cost to test
❌ Cons
- Lagging in fast markets – Moving average smoothing causes delay
- Can be overwhelming – Five lines may confuse beginners
- Requires confirmation – Best used with price action or support/resistance
- Not ideal for scalping – Works better on H1 and above
Frequently Asked Questions
Does the TDI indicator repaint?
No, the TDI RT Alerts Divergence indicator does not repaint. Once a signal appears and the candle closes, it remains fixed on the chart.
What is the best timeframe for TDI?
The indicator works best on H1, H4, and Daily timeframes. Lower timeframes like M5 or M15 tend to generate more false signals due to market noise.
Can I use TDI for gold (XAUUSD) trading?
Yes, the TDI indicator works on any instrument including gold, indices, and cryptocurrencies. However, you may need to adjust the RSI period for higher volatility assets.
How do I trade TDI divergence?
Look for discrepancies between price action and the green TDI line. If price makes a lower low but TDI makes a higher low, it’s bullish divergence. If price makes a higher high but TDI makes a lower high, it’s bearish divergence.
Is TDI better than standard RSI?
The TDI provides more information than standard RSI by adding trend direction (yellow line), trade signals (red line crossovers), and volatility measurement (blue bands). It’s essentially RSI with multiple enhancements built-in.
Download TDI RT Alerts Divergence Indicator
Ready to add this powerful multi-function indicator to your MT4 platform? Download the TDI RT Alerts Divergence Indicator free below.
Platform: MetaTrader 4 (MT4) Version: Latest 2026 File Type: .ex4 / .mq4
[Mirror Download TDI RT Alerts Divergence]
Final Verdict
The TDI RT Alerts Divergence Indicator stands out as one of the most comprehensive trading tools available for MT4. By combining RSI momentum, moving average trends, and Bollinger Band volatility into a single indicator, it eliminates chart clutter while providing actionable signals.
For swing traders and position traders working on H1 timeframes and above, this indicator offers excellent value. The divergence alert feature adds an extra layer of analysis that can help you catch major reversals before they happen.
While no indicator is perfect, the TDI is as close to an “all-in-one” solution as you’ll find. Download it today and see how it fits into your trading strategy.
Related Indicators You May Like
- Wave Trend Oscillator – Another powerful oscillator for trend confirmation
- Super Signal Scalping Indicator – For faster scalping setups
- Entry Point Forex Trend Indicator – Clear trend entry signals
- Browse All Free Forex Indicators – 660+ trading tools