

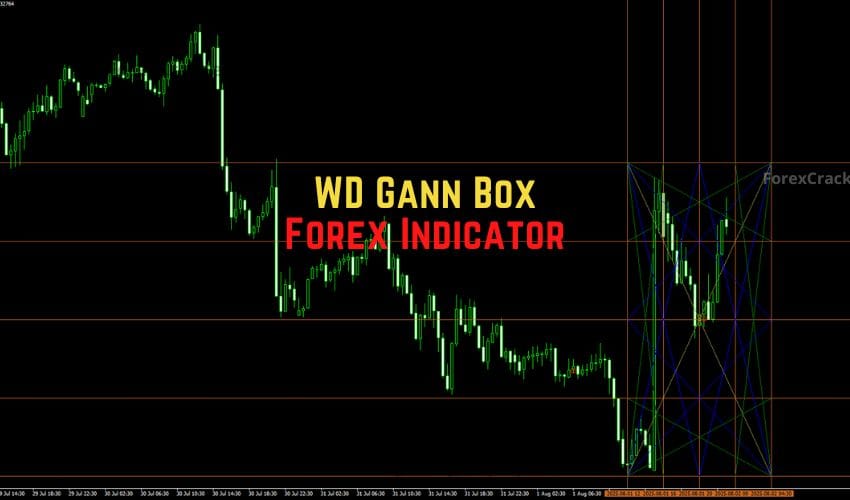
It’s hard to identify trend shifts or reversal zones on your MT4 chart, the WD Gann Box Indicator could be the tool you didn’t know you needed. I’ve been testing this out over the past few weeks, and let me tell you, it’s not just another flashy tool with confusing lines. It’s very practical once you understand what it’s showing you.
This indicator takes WD Gann’s classic geometric approach to the markets. It overlays a structure of angled lines and levels to help spot trend direction, potential reversals, and key support/resistance zones.
What Is the WD Gann Box Indicator?
The WD Gann Box Indicator for MetaTrader 4 is built on the principles of legendary trader W.D. Gann, who believed that price moved in geometric patterns and could be forecasted using angles and time cycles.
Here’s what the indicator does for you:
- Scans your chart and automatically draws vertical, horizontal, and diagonal trend lines.
- Highlights trend direction using 45-degree lines (Gann’s key angle).
- Marks support and resistance zones where the price is likely to react.
- Works on all timeframes from intraday to weekly and monthly.
- Provides structure for both trend-following and reversal strategies.
How I Use the WD Gann Box in My Trading
When I drop this on a chart, let’s say GBP/USD on H4, the first thing I focus on is the 45-degree Blue diagonal line. This is your trend-defining tool.
- If the price is above the 45° uptrend line, I’m only looking for buy setups.
- If the price is below the 45° downtrend line, I’m hunting for sell opportunities.
From there, I treat the other Gann levels as support/resistance zones. And here’s where it gets so good: when price breaks or respects these levels, it gives me all the confirmation I need.
Example Strategy:
- Buy when the price holds above the 45° uptrend line
- Stop loss below the last swing low
- Exit if the price closes below the trendline or reaches the next major resistance
And the same logic flips for sell trades. What I love is that it works whether you’re a trend trader, swing trader, or even a short-term scalper (though I’d recommend using this on H1 or higher for more reliable signals).


Download a Collection of Indicators, Courses, and EA for FREE
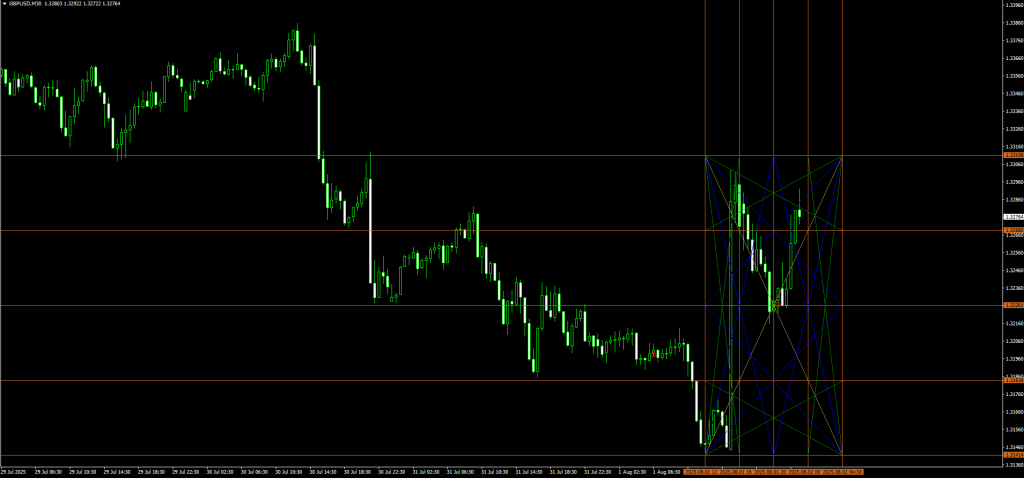
What Do the Lines Mean?
Let me break down the Gann Box layout real quick:
- Red Lines = Vertical and horizontal grid structure
- Blue Lines = Level 1 diagonal lines (most important – especially the 45°)
- Green Lines = Level 2 diagonal angles (secondary S/R zones)
- Gray Lines = Level 3 angles (minor levels – still helpful in managing trades)
These angled lines act like invisible walls that respect them more than you’d expect. They guide the rhythm of the market, which is especially useful when you’re caught in choppy conditions.
Why It’s Great for New and Experienced Traders
- New traders: It gives you a visual map, so you don’t have to guess where to place your stop loss or take profit.
- Experienced traders: You can combine it with price action or indicators like RSI and MACD for powerful confluence.
- Works like a charm with breakout strategies or trend continuation setups.
Just remember: while this tool gives good signals, always confirm reversals with candlestick patterns, divergence, or volume where possible.
Free Download WD Gann Box Forex Indicator
Read More Ultimatum Breakout EA for FREE Download
Final Thoughts
The WD Gann Box Indicator for MT4 is not just another set of random lines; it’s a tried-and-true geometric framework that can truly help you understand where the price is heading. I’ve used it to pinpoint entries with clearer conviction, set more confident stop-losses, and manage trades with greater precision.
Best of all? It’s free to download, easy to install, and you can start using it in your trading routine today.
So if you’re tired of vague support/resistance zones and want something more mathematical and structured, this might be exactly what you’re looking for.