
Introduction: Catching the “Big Move” Without Getting Burned
Trading reversals is the most dangerous game in Forex. It is widely known as “trying to catch a falling knife.” If you time it wrong, you get cut. But if you time it right, you catch the absolute bottom of a new trend and ride it for hundreds of pips while other traders are still scared to enter.
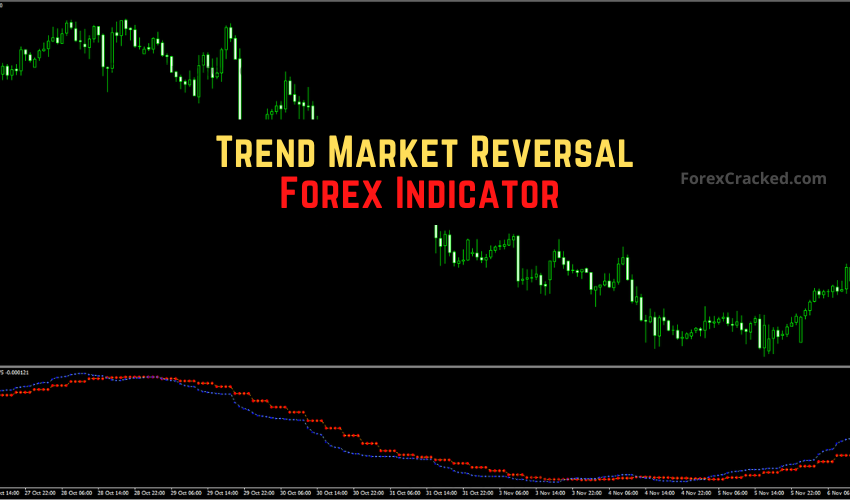
The Trend Market Reversal Indicator for MetaTrader 4 (MT4) is designed to solve this specific timing problem.
Instead of guessing where the market might turn based on gut feeling, this tool plots two specific Exponential Moving Averages (EMAs) that serve as dynamic triggers. It ignores the small noise of intraday volatility and only alerts you when the momentum has actually shifted.
If you are tired of staring at confusing charts and getting stopped out by fake reversals, this comprehensive review and guide will show you how to strip away the noise, filter out the “fakeouts,” and trade pure trends.
What is the Trend Market Reversal Indicator?
The Trend Market Reversal indicator is a trend-following technical tool that simplifies complex price action data into two easy-to-read lines. It belongs to the “Crossover” family of indicators.
At its core, it is an optimized Moving Average system. It calculates the relationship between short-term momentum and long-term trend direction to spot the exact moment control shifts from buyers to sellers (and vice versa).
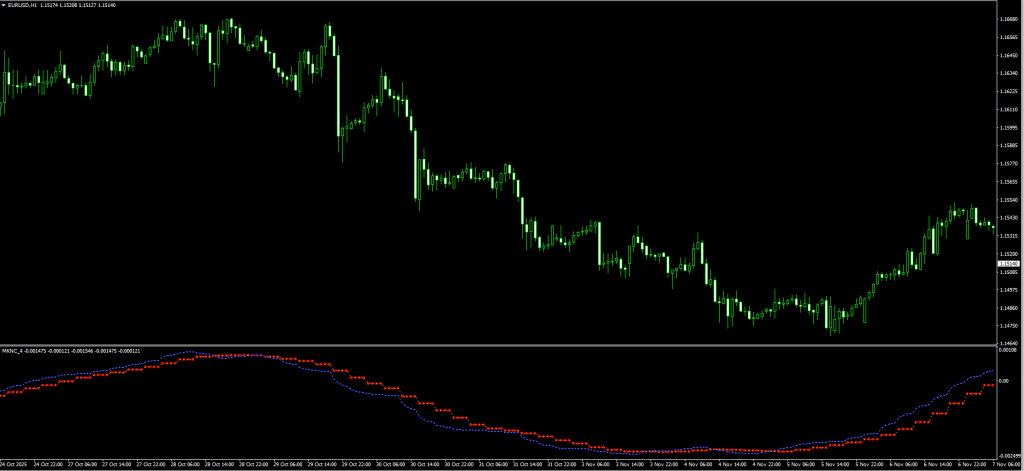
The Two Key Lines:
- Signal-Up Line (Fast EMA): This line reacts quickly to recent price changes. When the price spikes up, this line moves up instantly.
- Signal-Down Line (Slow EMA): This line is heavier and slower. It represents the “mean” or the average price over a longer period.
The Logic:
- Bullish Trend: When the Fast Line crosses above the Slow Line, it means recent buying pressure is stronger than the long-term average. (Buyers are winning).
- Bearish Trend: When the Fast Line crosses below the Slow Line, it means recent selling pressure is dominating. (Sellers are winning).
Unlike standard Moving Averages, which can clutter your chart, this custom indicator is designed to be visually clean, often changing colors to help you spot the crossover instantly.
Trend Market Reversal vs. Standard Moving Averages
You might be asking, “Why should I download this custom indicator when I can just put two Moving Averages on my chart?”
That is a valid question. However, this custom tool offers distinct advantages for active traders:
| Feature | Standard Moving Averages (MA) | Trend Market Reversal Indicator |
| Visuals | Can be messy, lines often overlap ambiguously | Optimized for clear visual separation |
| Responsiveness | Lag is often fixed based on period | Lag is often fixed based on the period |
| Noise Filtering | Low (reacts to every candle) | Medium (filters out small wicks) |
| Best For | General Market Analysis | Entry Triggers & Signals |
Verdict: If you want to analyze the chart, use standard MAs. If you want a clear Trigger to pull the trigger on a trade, use the Trend Market Reversal Indicator.
Review: Pros and Cons of the Trend Market Reversal Indicator
Before you download, it is important to understand this tool’s limitations. Here is our honest breakdown based on backtesting:
PROS (The Good)
- Visual Clarity: Removes the confusion of having multiple raw Moving Average lines on your chart.
- Objective Signals: The crossover is clear; there is no guessing “is it touching or crossing?”
- Filters Noise: The smoothing algorithm ignores small candle wicks better than standard EMAs.
- Free: It is a powerful tool at zero cost.
CONS (The Bad)
- Lag: Like all Moving Averages, it is a “lagging indicator.” You will not catch the exact top or bottom (that is why we use the RSI filter below).
- Fails in Ranging Markets: If the price is moving sideways, this indicator will give false signals.
- No Magic Bullet: It requires a secondary filter (e.g., Support/Resistance) to be profitable in the long term.


Indicator Settings: Optimizing for Your Style
One size does not fit all in trading. Depending on whether you are a scalper or a swing trader, you may need to adjust the indicator’s internal settings.
When you attach the indicator to your MT4 chart, check the “Inputs” tab:
- Faster_EMA_Period (Default: Often 9 or 12):
- Adjustment: Decrease this number (e.g., to 5 or 7) to get faster signals for scalping. However, be warned: faster signals mean more false alarms.
- Slower_EMA_Period (Default: Often 26 or 50):
- Adjustment: Increase this number (e.g., to 50 or 100) to filter out more noise. A higher number means you will enter the trend later, but the trend is more likely to be real.
- Signal_Alerts (True/False):
- Adjustment: Set to True to get a pop-up sound when the crossover occurs. This prevents you from staring at the screen all day.
The Strategy: How to Filter “Fakeouts” (The False Check)
Here is the truth that most other sites won’t tell you: In a ranging (sideways) market, this indicator will fail.
If the market is flat, the lines will cross back and forth constantly (the “Whipsaw Effect”). You will buy, get stopped out, sell, and get stopped out again. To fix this, we need a “False Check” Filter.
We will add the Relative Strength Index (RSI) to confirm that the reversal is genuine.
Required Tools:
- Trend Market Reversal Indicator (Default Settings).
- RSI (Relative Strength Index): Period 14, Levels 50 (Crucial), 30, 70.
- Timeframe: H1 or H4 (Best results).
1. The Buy Strategy (Bullish Reversal)
We are looking for a downtrend to end and a new uptrend to explode upwards.
- The Setup: Watch for the price to stabilize after a drop.
- The Signal: Wait for the Fast Line (Signal-Up) to cross ABOVE the Slow Line.
- The False Check (Crucial): Look at the RSI. The RSI line must be crossing ABOVE the 50 level.
- Why? The 50 level on RSI separates bullish territory from bearish territory. If the lines cross but RSI is still at 40, the momentum is too weak. Wait for the RSI break.
- The Trigger: Enter at the Close of the candle where both conditions are met.
- Stop Loss: Place it just below the recent “Swing Low.”
- Take Profit: Hold the trade until the lines cross back in the opposite direction OR price hits a major resistance level.
2. The Sell Strategy (Bearish Reversal)
We are looking to short the top of a rally.
- The Setup: Watch for the price to struggle at a high.
- The Signal: Wait for the Fast Line to cross BELOW the Slow Line.
- The False Check: Look at the RSI. The RSI line must be crossing BELOW the 50 level.
- Why? An RSI below 50 confirms that the bears are driving the price down.
- The Trigger: Enter at the Close of the candle.
- Stop Loss: Place it just above the recent “Swing High.”
- Take Profit: Exit when the trend changes path (lines cross back up).
Why Traders Fail with This Indicator (Psychology)
The math of this indicator works. The problem is usually the trader. Here are the two biggest mistakes to avoid:
- Trading the “Chop”: When the lines look like spaghetti (twisted together and flat), the market is deciding what to do. Do not trade. Wait for the lines to “fan out” or separate.
- Revenge Trading: If you get a false signal and lose 10 pips, do not immediately re-enter. Wait for the setup to reset. The “False Check” (RSI Filter) helps prevent this.
Mastering the Moving Average Crossover: Why adding a filter changes everything.”
How to Install the Trend Market Reversal Indicator
For beginners, here is a quick step-by-step to get this running on your MT4:
- Download the file from the link below.
- Open MetaTrader 4.
- Click File > Open Data Folder.
- Go to MQL4 > Indicators.
- Paste the file there.
- Right-click on “Navigator” in MT4 and hit Refresh.
- Drag the indicator onto your chart.
FAQ: Frequently Asked Questions
Does this indicator repaint?
Most EMA-based indicators do not repaint after the candle closes. However, while the current candle is forming, the lines may move. Always wait for the candle to close before entering a trade to ensure the signal is locked in.
Can I use this on the M1 or M5 timeframe?
You can, but it is risky. The lower timeframes are full of u0022noise.u0022 A crossover on M1 might be a 2-pip move before it reverses again. H1 and H4 are the u0022Goldilocksu0022 zones for this tool.
What is the best pair to trade?
Trending pairs work best. Stick to GBP/USD, GBP/JPY, or EUR/USD. Avoid pairs known for choppy trading, like EUR/CHF.
Final Verdict: Is it Worth Using?
u003cstrongu003eTrend Market Reversal Indicatoru003c/strongu003e
Summary
If you are a trend trader who struggles with Analysis Paralysis, the u003cstrongu003eTrend Market Reversal Indicatoru003c/strongu003e is a must-have. It forces you to be disciplined and only trade when momentum is clearly on your side.u003cbru003eWhile it is not perfect (no indicator is), combining it with the u003cstrongu003eRSI 50-Level Filteru003c/strongu003e creates a strategy that can compete with paid EAs.