
Introduction: Stop Counting Waves Manually – Let the Oscillator Do It
Elliott Wave Theory is one of the most powerful frameworks in technical analysis, but manually counting waves on a chart is tedious, subjective, and prone to error. Most traders either give up on Elliott Waves entirely or miscount the structure and enter at the worst possible time.
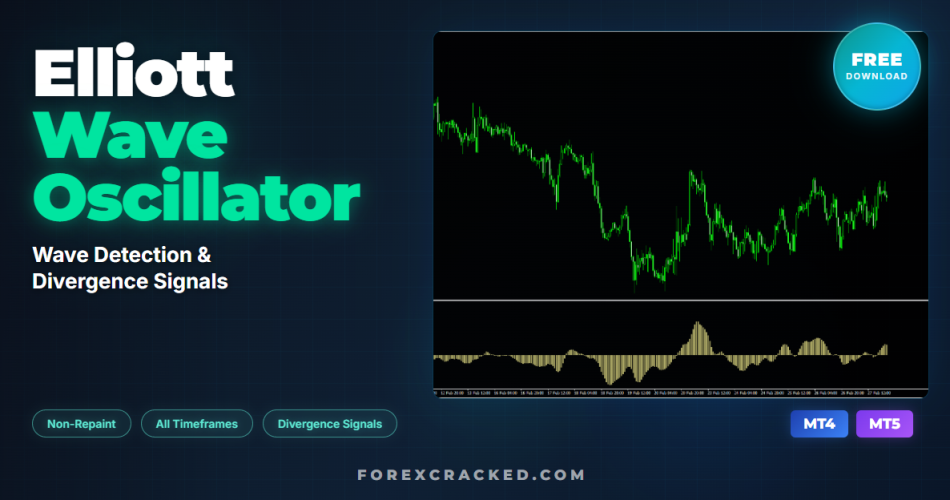
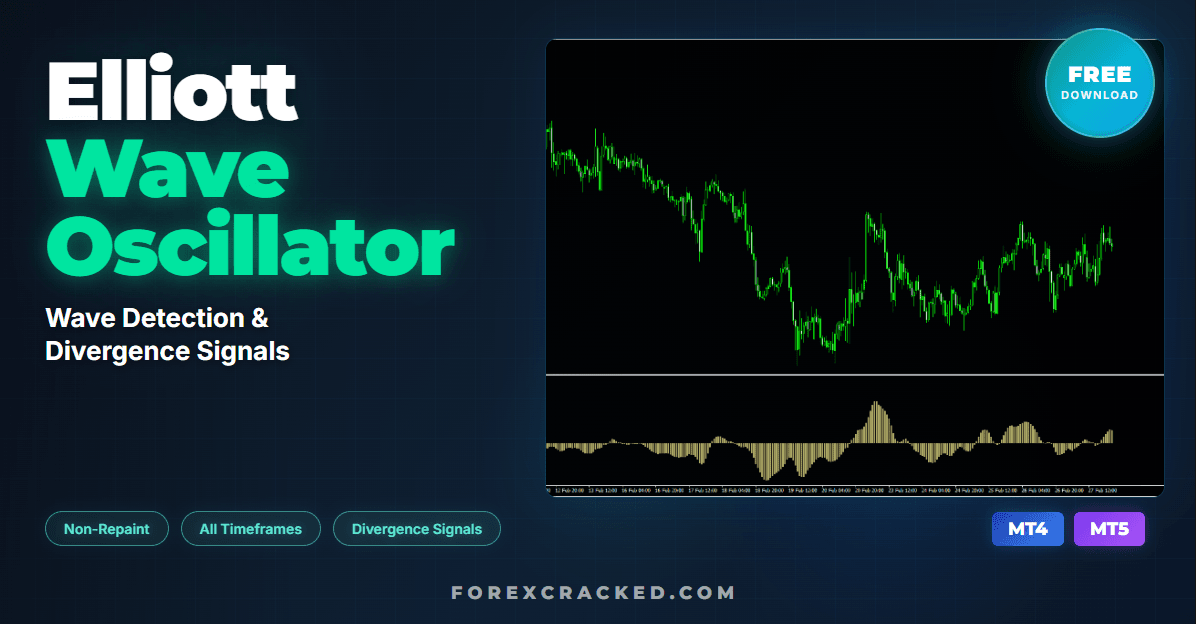
The Elliott Wave Oscillator (EWO) indicator for MT4 and MT5 fixes that problem. It applies momentum-based calculations to automatically highlight wave phases, identify the strongest Wave 3, and most critically — detect the Wave 5 divergence that signals trend reversals before they happen.
If you trade reversals, trend continuations, or use Elliott Wave analysis in any form, this indicator simplifies the entire process into a clean histogram below your chart. Available for both MetaTrader 4 and MetaTrader 5, we tested it across multiple pairs and timeframes. Here is our full review, a complete trading strategy, and free download links.
Table of Contents
What Is Elliott Wave Theory?
Before understanding the indicator, it helps to understand the theory behind it. Elliott Wave Theory, developed by Ralph Nelson Elliott in the 1930s, proposes that market prices move in repetitive, predictable wave patterns driven by collective trader psychology.
The core structure consists of:
- 5-Wave Impulse Pattern – Three motive waves (Waves 1, 3, and 5) that move in the direction of the main trend, separated by two corrective waves (Waves 2 and 4) that move against it.
- 3-Wave Corrective Pattern – After the 5-wave impulse completes, the market corrects in a 3-wave structure (A, B, C) before the next impulse begins.
The key principle: Wave 3 is typically the strongest and longest wave in the impulse sequence, and Wave 5 often ends with a divergence signal — where price makes a new extreme but momentum weakens.
This is exactly what the Elliott Wave Oscillator is designed to detect.
How the Elliott Wave Oscillator Works
The EWO measures the difference between a short-period and a long-period moving average (typically a 5-period and 35-period simple moving average), displayed as a histogram below the price chart. This approach is similar to how the MACD indicator measures momentum, but the EWO is specifically calibrated to align with Elliott Wave structures.
Here’s how the oscillator relates to each wave:
- Wave 1 – The oscillator begins rising from a baseline area, showing the initial momentum shift. The reading is typically modest as the new trend is just starting.
- Wave 2 – A corrective pullback causes the oscillator to dip back toward the zero line. This pullback should not exceed the Wave 1 starting point.
- Wave 3 (Strongest Reading) – The oscillator produces its highest peak (in an uptrend) or deepest trough (in a downtrend). This is the most powerful wave, and the EWO confirms it by showing the strongest momentum reading of the entire sequence.
- Wave 4 – Another correction pulls the oscillator back, but not as far as the Wave 2 correction.
- Wave 5 (Divergence Signal) – Price pushes to a new high (or new low in a downtrend), but the oscillator makes a lower peak (or higher trough). This divergence between price and the oscillator signals that the impulse pattern is exhausting, and a trend reversal is likely.
The divergence at Wave 5 is the primary trading signal — it marks the end of the impulse pattern and the beginning of the corrective phase.
Key Features
- Elliott Wave Identification – Automatically highlights wave momentum phases through histogram readings, making manual wave counting easier.
- Wave 3 Detection – The oscillator’s strongest reading naturally coincides with Wave 3, helping traders identify the most profitable wave.
- Divergence Signals – Spots the critical Wave 5 divergence that signals trend exhaustion and potential reversal.
- Histogram Display – Clean, below-chart histogram that doesn’t clutter the price chart. Positive values indicate bullish momentum, negative values indicate bearish momentum.
- All Instruments – Works on all Forex currency pairs, commodities (including gold), indices, stocks, and cryptocurrencies.
- All Timeframes – Compatible with M1 through MN1, though it performs best on medium to long-term timeframes (H1, H4, D1).
- Both MT4 and MT5 – Available for download on both MetaTrader platforms.
The Elliott Wave Oscillator can be used on any Forex currency pair and other assets such as stocks, commodities, cryptos, precious metals, oil, and gas. It can also be used on any time frame that suits you best, from the 1-minute to the 1-month charts. While it works on short-term timeframes, it is most effective on H1 and above where wave structures are more defined. Practicing on an MT4 demo account is recommended until you become consistent and confident enough to go live.


How to Use the Elliott Wave Oscillator
- Step 1: Apply the Indicator – Load the Elliott Wave Oscillator on your MT4 or MT5 chart. The histogram will appear in a separate window below the price chart. Positive bars indicate bullish momentum, negative bars indicate bearish momentum.
- Step 2: Identify Wave 3 – Look for the point where the oscillator makes its strongest reading — the tallest bar in the current sequence. This corresponds to Wave 3, the most powerful impulse wave. In an uptrend, this is the highest positive peak. In a downtrend, this is the deepest negative trough.
- Step 3: Watch for Wave 5 Divergence – After Wave 3’s peak, the oscillator pulls back during Wave 4. When price resumes the trend and pushes to a new high (uptrend) or new low (downtrend), check the oscillator. If the oscillator makes a lower peak (uptrend) or higher trough (downtrend) while price makes a new extreme — this is the divergence signal. It marks the end of the 5-wave impulse and signals an incoming reversal.
- Step 4: Enter the Reversal Trade – Once the Wave 5 divergence is confirmed, prepare for a reversal entry. For additional confirmation, consider pairing with a trend reversal indicator or waiting for a candlestick reversal pattern at the Wave 5 extreme.
- Step 5: Set Risk Management – Place your Stop Loss beyond the Wave 5 extreme. For Take Profit targets, consider using the Wave 4 correction level as TP1 and the Wave 3 start as TP2. For precise position sizing, use a Lot Size Calculator to manage risk.
Trading Example
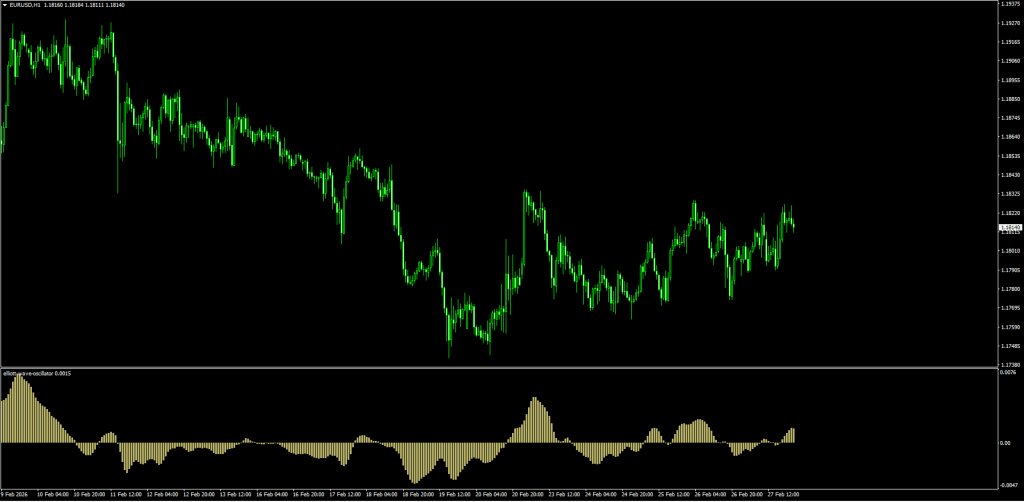
In the chart example below, the EURUSD H1 chart shows a clear downtrend forming an Elliott Wave structure. The oscillator produces its deepest trough during Wave 3, confirming the strongest bearish momentum. When Wave 5 pushes price to a new low, the oscillator makes a higher low — a clear bullish divergence. This divergence signals that the 5-wave bearish impulse is complete and the price is poised for a reversal to the upside.
Best Practices
As a momentum oscillator, the EWO is most effective when combined with other analysis tools. Consider cross-referencing with:
- Support and Resistance indicators to identify key price levels at Wave 5 extremes
- Fibonacci retracement tools to measure wave proportions and project targets
- RSI or Stochastic for additional divergence confirmation
- Higher timeframe analysis to confirm the broader trend context
Free Download Elliott Wave Oscillator
Elliott Wave Oscillator
A momentum-based oscillator built on Elliott Wave Theory that identifies wave formations and detects trend reversals through divergence analysis for MT4 and MT5.
Pros
- Simplifies Elliott Wave analysis — no manual wave counting required
- Clearly identifies Wave 3 (strongest momentum) through peak histogram readings
- Divergence at Wave 5 provides reliable trend reversal signals
- Works on all instruments and all timeframes
- Clean histogram display — doesn't clutter the price chart
- Available for both MT4 and MT5
Cons
- Best suited for medium to long-term trading — less reliable on very short timeframes (M1)
- Requires understanding of basic Elliott Wave Theory for proper interpretation
- Standalone use has limitations — should be combined with other confirmation tools for best results
- Does not auto-generate entry/exit signals — requires manual divergence identification
Summary
The Elliott Wave Oscillator provides a practical, visual approach to Elliott Wave analysis by highlighting wave momentum phases and critically, the Wave 5 divergence that signals trend reversals. It is best suited for traders who already understand or want to learn Elliott Wave Theory, and it works most effectively on H1 to Daily timeframes. Combining the EWO with additional tools such as Fibonacci levels, support/resistance, and trend filters will significantly improve accuracy.
Mirror Download Elliott Wave Oscillator
Frequently Asked Questions
Conclusion
The Elliott Wave Oscillator simplifies one of the most respected but often challenging methodologies in technical analysis. By converting wave momentum into a clear histogram, it helps traders identify the critical Wave 3 peak and the Wave 5 divergence without manual counting, similar to the FXC Elliott Wave indicator. The divergence signal at Wave 5 — where price makes a new extreme but the oscillator does not — is the primary setup, pointing to trend exhaustion and an impending reversal.
This indicator appeals best to traders who follow or want to incorporate Elliott Wave analysis into their strategy. While it works on all timeframes and instruments, medium to long-term charts (H1 to D1) produce the most reliable wave structures. As with any momentum oscillator, combining the EWO with additional confirmation — such as Fibonacci retracement levels, support and resistance, or candlestick pattern indicators — is recommended for more consistent results.
This indicator pairs well with indicators from our Top 10 Best Free MT4 Indicators — read the full comparison with expert reviews and trading strategies.