
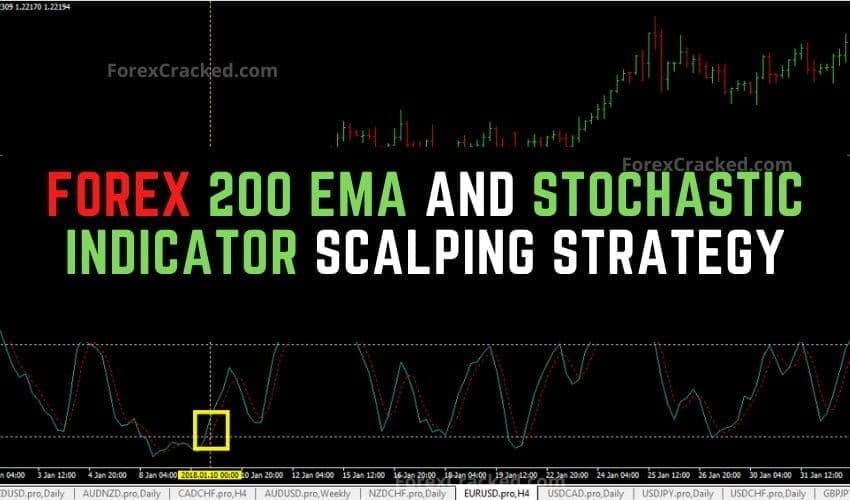
Forex 200 EMA And Stochastic Indicator Scalping Strategy
As the name says, the 200EMA And Stochastic Indicator Forex Scalping Strategy are based on the 200 exponential moving(EMA) and the stochastic...
Looking for powerful forex analysis indicators? Browse our collection of 100+ verified technical analysis tools for MetaTrader 4 and MT5. From oscillators to volatility detectors, these indicators help you analyze market conditions and identify trading opportunities.
Popular Analysis Indicator Types:
| Indicator | Type | Platform | Best For |
|---|---|---|---|
| ZeroLag MACD | Momentum | MT4/MT5 | Trend Reversals |
| SMI Ergodic Oscillator | Oscillator | MT4/MT5 | Momentum Analysis |
| SuperTrend Oscillator | Trend | MT4/MT5 | Trend Direction |
| Volatility Ratio V2 | Volatility | MT4 | Market Volatility |
| Market Structure Oscillator | Structure | MT4/MT5 | Market Structure |
💡 Pro Tip: Combine multiple analysis indicators for confirmation—use a trend indicator with an oscillator for best results.
320 posts found
A forex analysis indicator is a technical tool that processes price data to help traders identify trends, momentum, volatility, and potential reversals. Examples include MACD, RSI, Bollinger Bands, and custom oscillators.
Trend indicators (like Moving Averages, SuperTrend) identify market direction and work best in trending markets. Oscillators (like RSI, Stochastic) measure momentum and identify overbought/oversold conditions, better for ranging markets.
Yes, combining 2-3 complementary indicators provides better confirmation. For example, use a trend indicator (SuperTrend) with an oscillator (RSI) and a volatility tool (ATR). Avoid using too many indicators that show the same thing.
Many analysis indicators in this category are non-repainting, meaning signals don't change after they appear. Check each indicator's description—we note repainting status in our reviews.
Start with classic indicators like MACD, RSI, or Moving Averages. These are well-documented, easy to understand, and form the foundation of technical analysis. Add more complex tools as you gain experience.