
If you’ve ever wondered whether RSI or Stochastic provides better reversal signals, the Double Stochastic RSI Forex Indicator for MT4 solves that dilemma by combining both. This hybrid oscillator merges the sensitivity of Stochastic with the stability of RSI, automatically analyzing price dynamics to reveal overbought and oversold zones with remarkable precision.
Traders love this setup because it captures market turning points without flooding the chart with false arrows. Whether you’re scalping or trading higher timeframes, the Double Stochastic RSI helps you find where momentum is truly exhausted before price reverses.

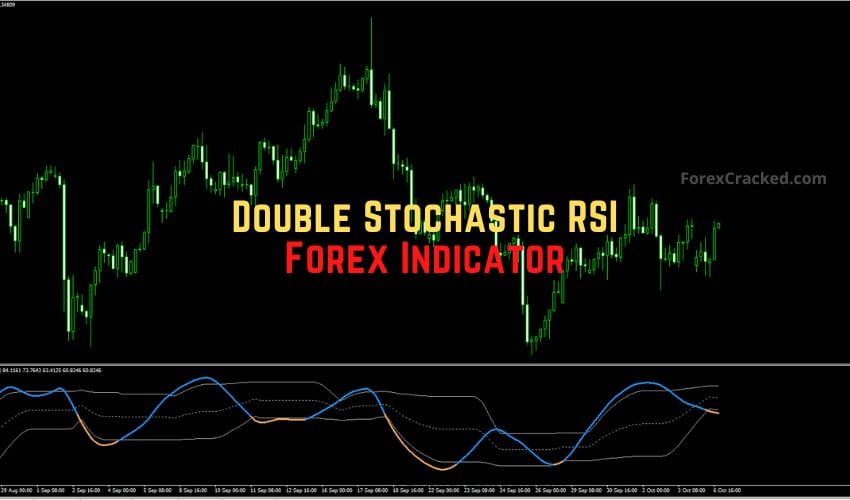
How the Double Stochastic RSI Works
The indicator consists of:
- A main line oscillating between 0 and 100.
- Two dynamic levels showing overbought and oversold zones.
When the main line rises above the upper band, the indicator turns blue, signaling an overbought market or a period of extended bullish momentum. Conversely, when it drops below the lower band, the line turns orange, signaling an oversold condition or sustained bearish pressure.
It’s one of the cleanest ways to visualize where the market may have gone too far, too fast.
Double Stochastic RSI Buy Signal Example
A buy signal forms when:
- The main line moves out of the oversold zone (turns blue).
- The price confirms the setup near a support level or previous resistance-turned-support.
For instance, after a breakout above 121.30 on USD/JPY, volume spikes confirmed institutional interest. When the price retraced to test that same level, the Double Stochastic RSI line emerged from the oversold region, confirming a long entry.
Entry: On the breakout retest
Stop-loss: Below the previous swing low
Take profit: At the next resistance or counter signal
This method gives confidence in joining a trend at optimal retracement levels rather than chasing tops or bottoms.
Double Stochastic RSI Sell Signal Example
A sell signal occurs when:
- The main line exits the overbought zone (turns gray).
- The market aligns with a bearish moving average trend (e.g., below the 200 SMA).
For example, when the indicator’s line dropped out of the overbought zone while price traded below the 200 SMA, it confirmed a trend continuation sell setup.
Entry: On candle close below confirmation level
Stop-loss: Above recent swing high
Exit: On counter signal or major support zone


Best Settings and Tips
- Works on all forex pairs, crypto, and indices.
- Timeframes: H1 to D1 yield the cleanest signals.
- Combine with candlestick confirmation or volume analysis to reduce false signals.
- No repainting.
Pros and Cons
Pros:
- Combines RSI and Stochastic logic for better accuracy.
- Helps identify true overbought/oversold reversals.
- Customizable and easy to interpret.
- Works for forex, crypto, and stocks.
Cons:
- No built-in alerts.
- It may produce false signals in ranging conditions.
- Performs best when combined with support/resistance or price action.
Pro Tip
Pair the Double Stochastic RSI with a volume-based confirmation indicator or trend filter (like EMA 100 or SuperTrend). This eliminates whipsaws and helps you capture reversals that align with the dominant trend.
Free Download Double Stochastic RSI Forex Indicator
Read More THE RSI DIVERGENCE STRATEGY
Conclusion
The Double Stochastic RSI Indicator for MT4 is a simple yet effective tool that merges two of the most powerful oscillators in trading. By combining Stochastic’s sensitivity with RSI’s stability, traders can find cleaner entries around market reversals and trend continuations.
It’s free to download, easy to use, and suitable for any market condition. Just remember, no indicator is perfect on its own. For optimal results, confirm each signal with price structure, candlestick patterns, or volume analysis before placing a trade.
Frequently Asked Questions (FAQ)
1. Does the Double Stochastic RSI repaint?
No, it does not repaint once the candle closes.
2. Can I use it for scalping?
Yes, especially on M15 and M30 charts when combined with moving averages or support/resistance.
3. What works best with it?
Volume analysis, trend filters, and Fibonacci retracements.
4. Does it work on crypto or indices?
Absolutely. It performs equally well across all markets.