
LUNA FX Indicator is a Complete Trading software for MT4 that gives NON-Repaint buy/sell signals. It’s designed to provide an easy-to-use trading platform for both beginner and experienced traders. This software is designed to help users make informed decisions when trading in the forex market. It comes with ON-SCREEN dashboards that show you various helpful information.
MT4 Trading Indicator is a powerful combination of cutting-edge technologies and ease of use. This software is designed to help users make informed decisions in the forex market by providing precise analysis and accurate trading signals. The smart trend analysis calculation mechanism can detect trending markets and allow users to open trades in line with the big traders. Additionally, LUNA FX Software can inform users when it is time to take a break from trading, allowing them to avoid flat markets and stay ahead of the game.
It has four various templates adapted to different trading styles and market conditions.
This Forex MT4 Trading Indicator is entirely manual. The indicators produce the signals, but any decisions to enter the market and to set protection stops or profitable exit stops will depend on the trader. Therefore, the trader must be familiar with the principles of risk and reward and use initial support and resistance areas to set entries and exits.
MT4 LunaFX can give you trading signals you can take as they are or add your additional chart analysis to filter the signals further, which is recommended. While traders of all experience levels can use this system, it can be beneficial to practice trading on an MT4 demo account until you become consistent and confident enough to go live.
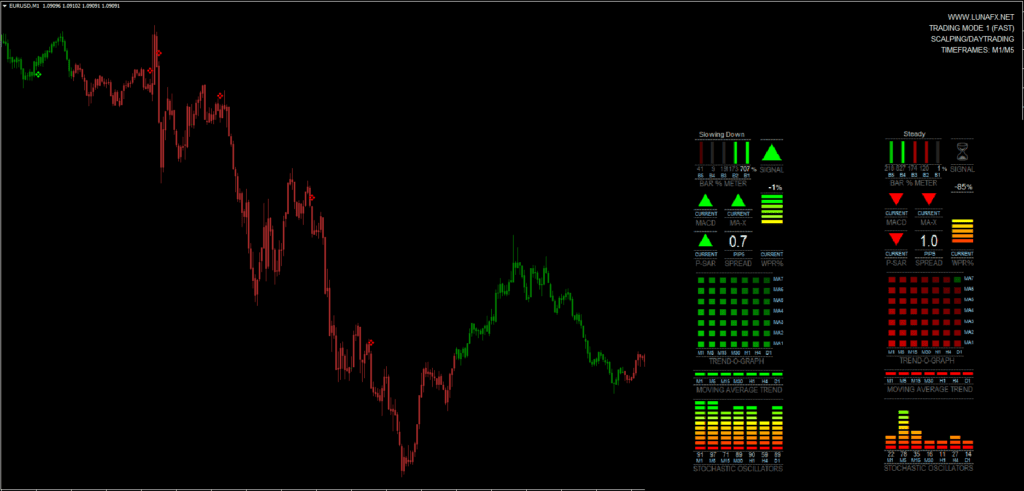
Features of the Luna FX Indicator Dashboard
An all-in-one indicator that provides at a glance a lot of information that would normally require many charts and indicators and general screen clutter.
- A graph of Stochastic Oscillators on timeframes M1 up to D1.
- An indication of the market trend using Moving Averages on timeframes M1 to D1.
- The direction of the MACD on the current chart and crossing of the signal line and zero line.
- The direction of a fast 3-period LWMA crossing a 5-period SMA (periods customizable).
- The direction of the Parabolic SAR on the current chart for giving the exit signal and also confirmation for entry.
- An oscillating graph of William’s % Range indicator. This was used because of its fast movement and unique predictive quality. Also, it’s very good for identifying Overbought/Oversold conditions.
- A Bar % Increase/Decrease meter was developed to give a direct visual representation of the percentage rise or fall of the current price compared to the last 4 bars. It’s simple but effective. The gist of it is that the previous 4 bar movements (close to close) are averaged and percentage, so if the current bar rises above 100%, it is speeding up above the recent average. Conversely, if it drops below 100%, it slows down and takes on a more steady movement. Strong price movements are displayed in bright red
or green, with varying shades according to the strength of the movement. - The overall recommended signal to trade is based on the various indicator signals.
- And last but not least, the spread of the currency, in big easy-to-see numbers.
- A History viewer in the form of a vertical line that can be dragged over previous bars to bring up the history.
- A multi-timeframe Trend Graph showing the direction of 7 customizable Moving Averages on seven timeframes.
- An OB/OS Signal Map, showing the Overbought or Oversold signals from 7 different oscillators/indicators on seven timeframes.
- Customizable Overall Signal using a combination of current and multi-timeframe indicator signals.
- Price/Chart/Currency display that can be switched on or off.
- Switch between Default and Compact modes.
Dashboard Input Parameters Explanations
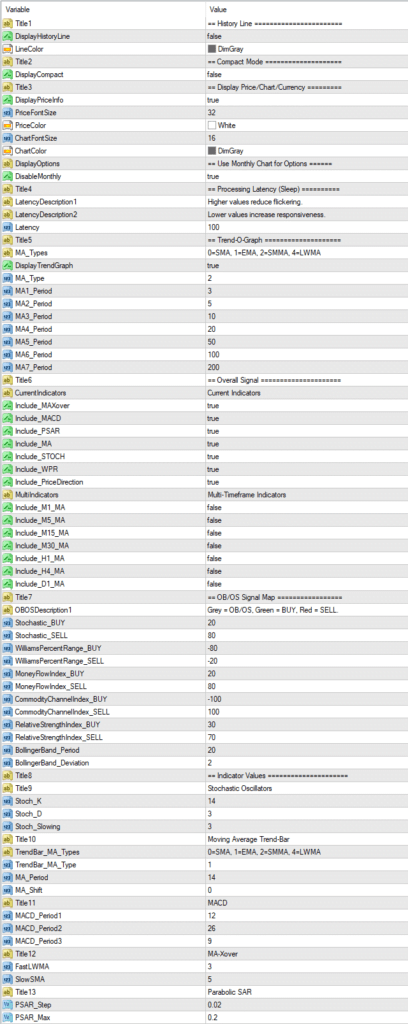
- HISTORY LINE – Enables or disables the History Line. When the dashboard is first loaded onto the chart you will see the History Line appear slightly ahead of the current time (when loaded manually, not with the system template).
Double-click on it and drag it across the previous bars to bring up the previous indicator values in the dashboard. You can delete the line at any time, but changing timeframes will make a new one appear (only if one is not present). As long as the History Line is ahead of the current price, the current readings will be given, so if you’re not using it, it’s best to delete it until you need it again. Otherwise, it will soon fall behind the current time. It is still not perfect and misses bars past the weekend mark, but is quite accurate for short-term history. It is more accurate reading the current indicators than the multi-timeframe indicators. - COMPACT MODE – Switches from the default full display to a smaller display. 1. The Trend Graph or the OB/OS Signal Map is not available in compact mode.
- DISPLAY PRICE/CHART/CURRENCY – The Price/Chart/Currency display can be turned on or off, and font size and color are customizable.
- USE MONTHLY CHART FOR OPTIONS – DisableMonthly disables Multi-Meter on the Monthly chart so that Options can be accessed by pressing F7 or from the Expert Advisors menu.
- PROCESSING LATENCY (SLEEP) – This is the millisecond value that stops the program loop before restarting the cycle. The default is 100. It can be adjusted to optimize the dash to your computer. You can reduce the value for slightly more responsiveness of the LUNA FX Indicator but go too low and it will start flickering.
- TREND-O-GRAPH – This graph shows trend waves of the short and longer-term trends. Use DisplayTrendGraph to toggle between the Trend Graph and OB/OS Signal Map. The Trend Graph is displayed by default. The values for the 7 Moving Averages can be set here, including the MA Type (Simple, Exponential, Smoothed, or Linear Weighted). The default is Smoothed.
- OVERALL SIGNAL – The overall Signal can be configured to include or exclude the direction of most of the indicators displayed. Current indicators are from the current chart and Multi-timeframe indicators are the MAs from the Trend Bar. Choose which of these signals you want to include or exclude. By default, ALL Current indicators and NO Multi indicators determine the signal.
- OB/OS SIGNAL MAP – This graph displays seven indicators plotted along seven timeframes. All of them except Bollinger Bands are oscillators commonly used for identifying Overbought/Oversold conditions. The indicators are from bottom to top: MACD, Stochastic Oscillator, William’s % Range, Money Flow Index, Commodity Channel Index, Relative Strength Index, and Bollinger Bands.
A grey cross will appear if the price moves into an OB or OS zone, indicating a reversal is imminent. When the price does reverse the cross will become Green for Buy or Red for Sell.
The more crosses, the better if you a trading a reversal, as the OB or OS level is more significant. The zone values are customizable. The default values are the most commonly used.
The OB/OS Signal Map should be used when the market is ranging sideways, as Oscillators are not very reliable in strong trends. NOTE: The MACD Buy or Sell signal is the MACD crossing the signal line, a grey cross appears if the MACD is falling above the signal line or rising below the signal line. The Bollinger Bands give a grey signal if the price has moved outside of the bands. If the price reverses, the Buy or Sell signal is displayed. - INDICATOR VALUES – Values here are for changing the MA-Xover signal, MACD signal, Parabolic SAR signal, MA Trend Bar, W%R, and Stochastics.


This Luna FX Indicator System is very simple and straightforward. Even a complete beginner can start trading and making profits with this system. You can set it to send you a signal alert via Mobile Notification, platform pop-ups, and Email. This is helpful as it means you do not need to stare at the charts all day, waiting for signals to appear, and you can monitor multiple charts simultaneously.
MT4 Trading Indicator can be used on any Forex currency pair and other assets such as stocks, commodities, cryptos, precious metals, oil, gas, etc. You can also use it on any time frame that suits you best, from the 1-minute through to the 1-month charts.
It is straightforward to use even by complete forex beginners. You don’t have to be a professional to use it. Just load one of 3 different Templates to your chart.
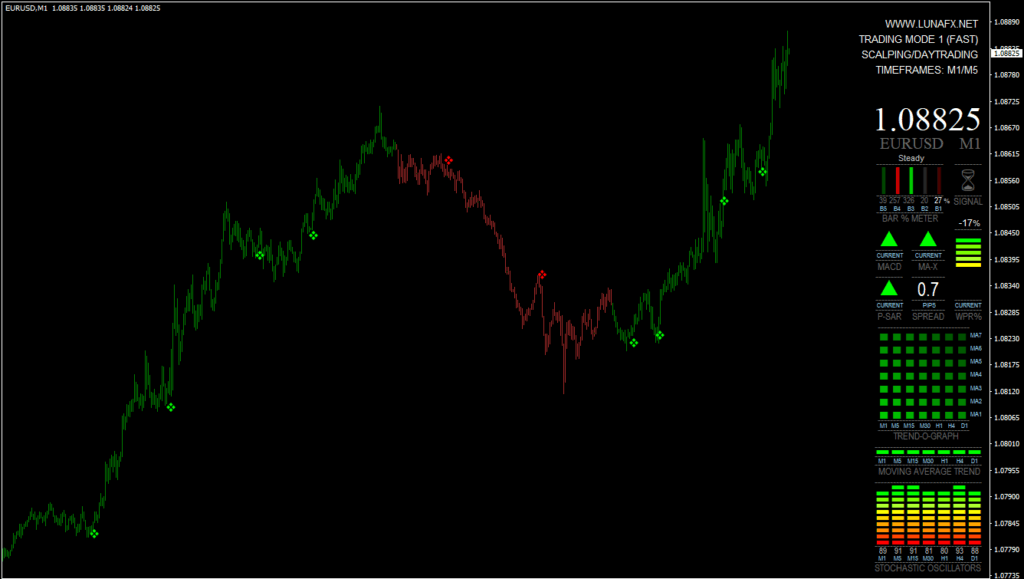
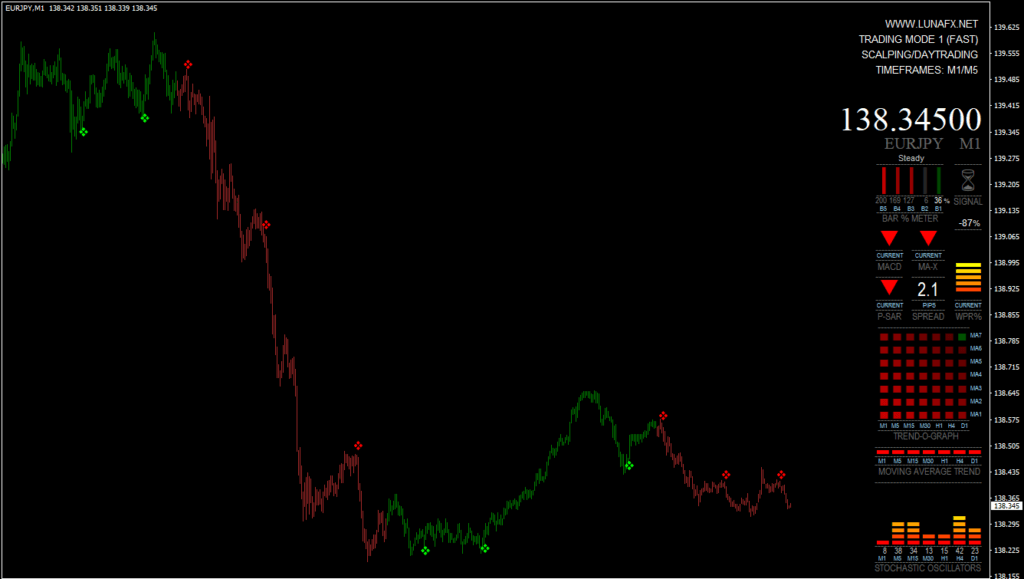
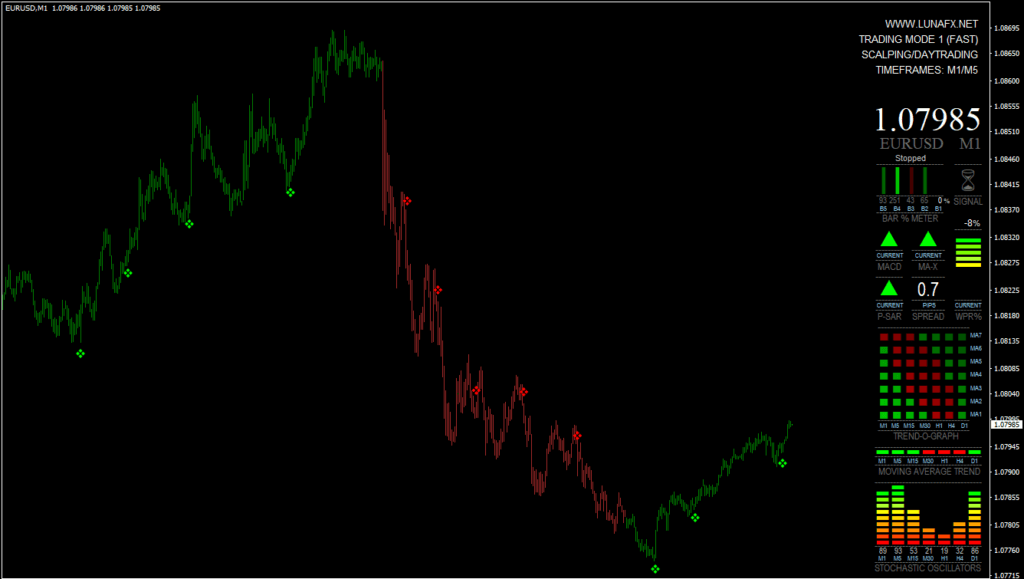
- LUNA-M1– is the fastest and most aggressive template. It provides faster signals with increased risk. This mode is ideal for fast day trading or scalping.
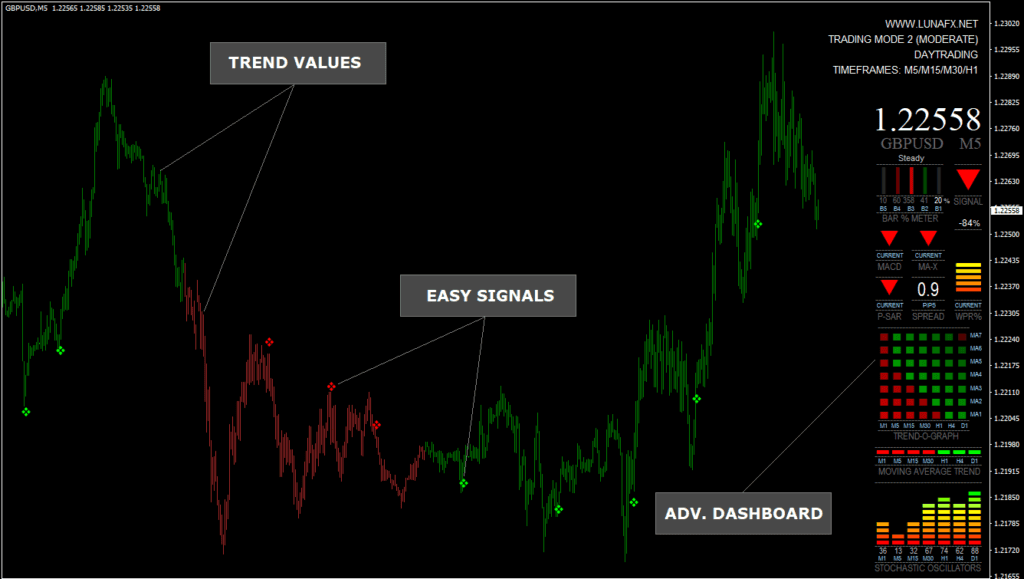
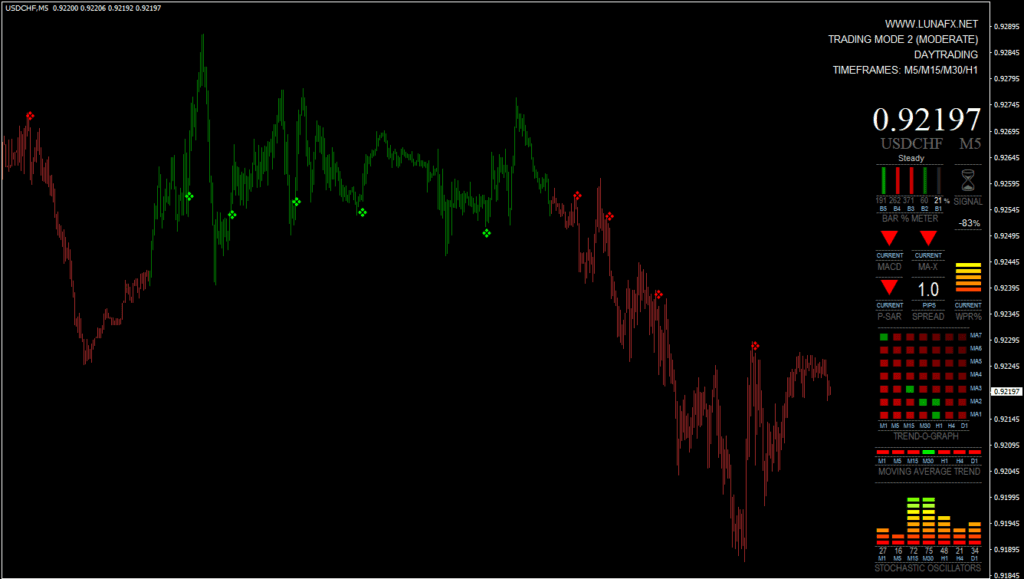
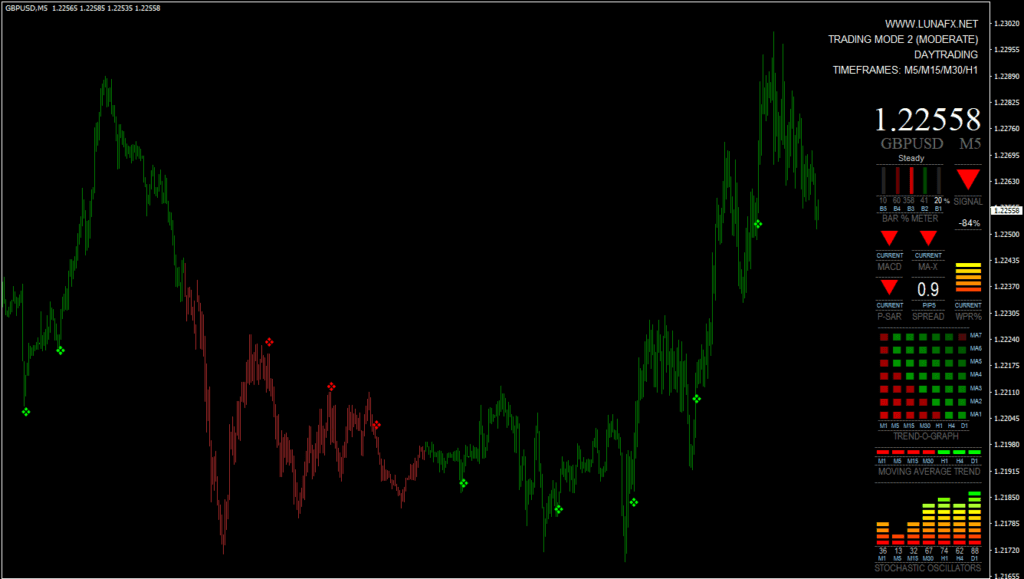
- LUNA-M2– is the standard, balanced template. Moderate risk and moderate signal speed. This mode is ideal for typical day trading/swing trading.
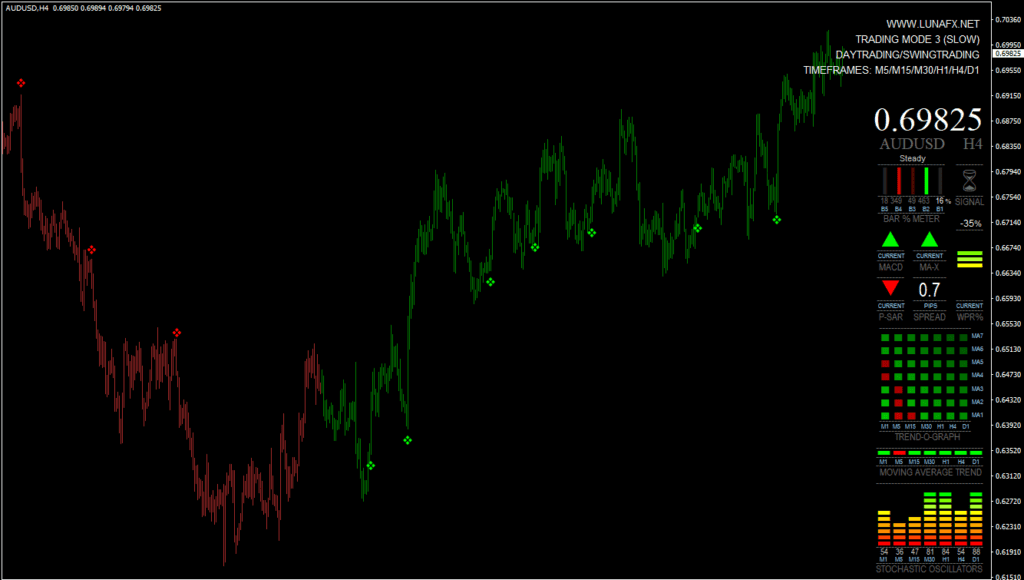
- LUNA-M3- provides the most conservative signals. The trend changes slowly and allows for catching the more significant moves on moderate / higher TFs.
Trading rules for MT4 Trading Indicator
Follow money management & Don’t enter to trade within the high-impact news period. Exit from your trades half & an hour from the high-impact forex news.
As always, to achieve good results, remember about proper money management. To be a profitable trader, you must master discipline, emotions, and psychology. It is crucial to know when and when not to trade. Avoid trading during unfavorable times and market conditions like low volume/volatility conditions, beyond major sessions, exotic currency pairs, wider spread, etc.
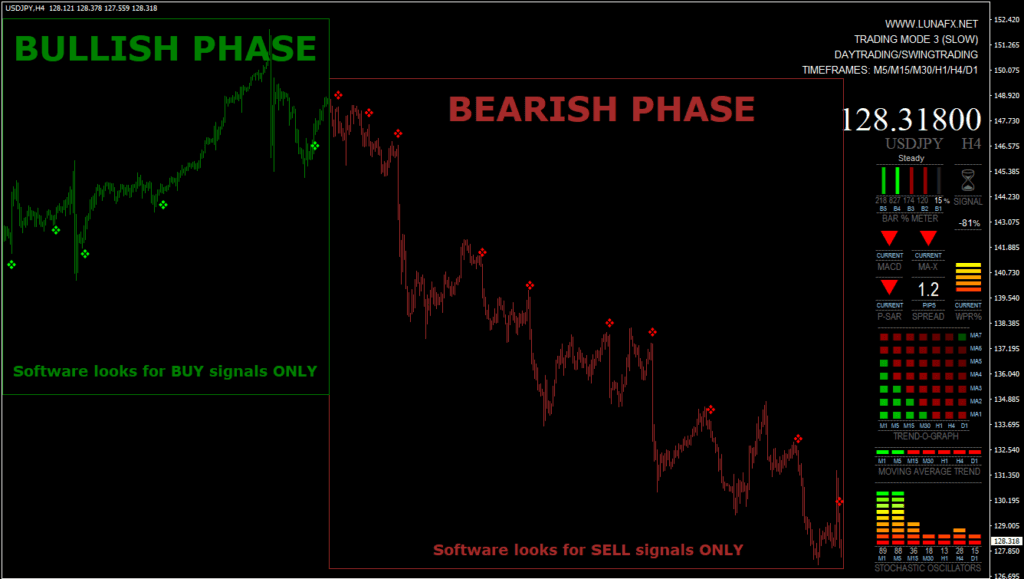
Buy Entry
When you observe green candles on the chart, it indicates that the current market trend is bullish. These Green marks serve as buy signals and suggest that it would be beneficial to open a buy position.
Sell Entry
When you observe red candles on the chart, it indicates that the current market trend is bearish. These Red marks serve as sell signals and suggest that it would be beneficial to open a sell position.
Trade Exist
Any positions with this Forex Trading Indicator can be liquidated using a fixed profit target. Alternatively, the profit target should be set using previous support or resistance or high-low level as a reference point. You may also exit the trade manually if the conditions of the system reverse (the opposite signal appears).
It is recommended to use a stop loss. Set SL below the entry price using previous support/resistance as a reference point Or on the previous high/low swing. Using fixed stop loss settings without any reference points is not advocated.
- You can use simple RR ratios. After placing SL below/above the last swing. Aim for the same amount of pips (TP1) or double the amount (TP2).
- If you SL = 15pips. TP1 should be placed at +15pips and TP2 at +30pips.
Thanks Admin will test it.
thanks!!! will be testing it, installed and seems working OK
Not worth testing!
What happened