
In the fast-paced world of Forex trading, time is often just as critical as price. While most traders focus heavily on support and resistance levels, the “timing” of market moves is a hidden dimension that professional algorithms leverage daily.
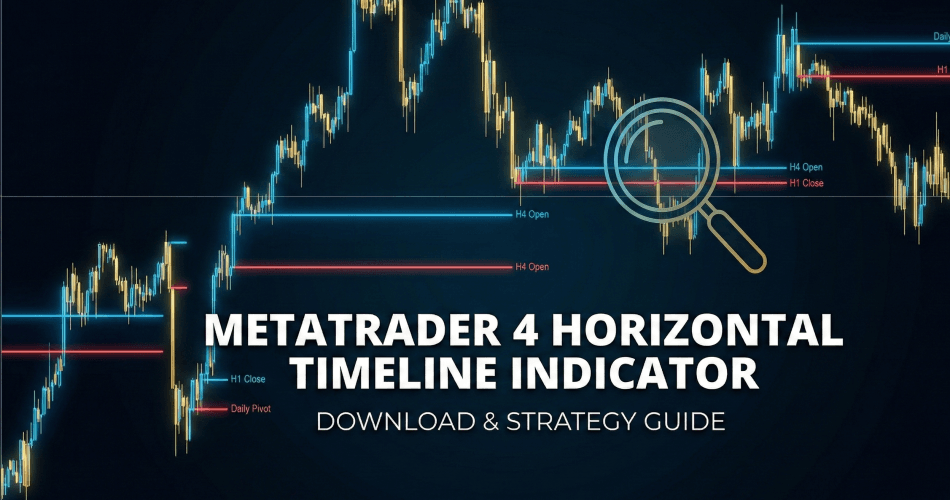
The Metatrader 4 Horizontal Timeline Indicator is a utility tool designed to bridge this gap. It automates the marking of specific time intervals on your chart, helping you visualize session opens, candle closes, and cyclical patterns that are otherwise invisible to the naked eye.
Whether you are a scalper tracking the 15-minute close or a swing trader watching weekly boundaries, this tool simplifies your workflow by handling the visual heavy lifting.
Key Features
This indicator is not just a drawing tool; it is a strategic assistant. Here is what makes it an essential add-on for your MT4 platform:
- Automated Time Marking: Automatically draws vertical lines at specific time intervals (e.g., every 4 hours), saving you from manually drawing lines every day.
- Multi-Timeframe Support: Capable of marking intervals from 5 minutes up to 1 Month.
- Customizable Alerts: Includes a
TimeAlertvariable. When set toTrue, the indicator notifies you when a new time line is generated, ensuring you never miss a critical candle close. - Pattern Recognition: By segmenting the chart into time blocks, it becomes easier to spot recurring market behaviors during specific sessions (e.g., London Open or New York Overlap).
Supported Time Intervals (Input Settings)
To configure the indicator, you need to input the specific minute value in the settings. Use this cheat sheet:
- 5: 5-Minute (Scalping)
- 15: 15-Minute
- 30: 30-Minute
- 60: 1-Hour (Session Opens)
- 240: 4-Hour (Critical for Price Action)
- 1440: Daily (1 Day)
- 10080: Weekly
- 43200: Monthly
Pro Tip: Ensure your chart timeframe is smaller than the interval you are trying to mark. For example, if you want to see Weekly lines (10080), you must be on a Daily, H4, or H1 chart.
Expert Insight: How to Trade with Time Lines
Our team has tested this indicator to find the most effective strategies for 2025.
The Horizontal Timeline Indicator is best used to identify “Time Clusters.” Here is a proven method:
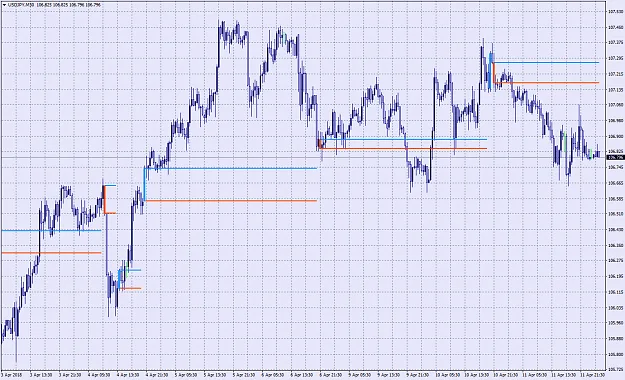
1. The H4 Close Strategy
- Setting: Set the indicator input to 240 (4H).
- Logic: Many institutional algorithms and bank traders rebalance their positions at the close of the 4-hour candle (e.g., 10:00, 14:00, 18:00 Server Time).
- Execution: Watch for price rejection (long wicks) occurring exactly at the vertical line. If price hits a support level at the same time the vertical line appears, it is a reversal signal.
2. Session Breakouts
- Setting: Set the indicator input to 60 (1H).
- Logic: This visually segregates the hours. You can easily spot the “Asian Box” range.
- Execution: If price breaks a horizontal support/resistance level exactly as the vertical hour line appears (London Open), it often signals a high-momentum move.
How to Install the Horizontal Timeline Indicator
Follow these steps to update your Metatrader 4 terminal:
- Download: Download the
.mq4or.ex4file from the link below. - Open Data Folder: Launch MT4, go to File > Open Data Folder.
- Navigate: Go to
MQL4>Indicators. - Paste: Copy the downloaded file into this folder.
- Refresh: Restart MT4 or right-click the “Navigator” window and select “Refresh”.
- Activate: Drag the “Horizontal Timeline” indicator onto your chart.
- Configure: In the “Inputs” tab, set your desired interval (e.g., 240) and set
TimeAlerttoTrue.
Troubleshooting Common Issues
Even the best indicators can encounter conflicts. If the Horizontal Timeline indicator is not behaving as expected, check these common solutions:
1. Lines Not Appearing
- Cause: The most common reason is a time frame mismatch.
- Fix: Ensure your
IntervalThe setting is higher than your current chart timeframe. For example, if you set the interval to 60 (1 hour), you must be viewing a 30M, 15M, 5M, or 1M chart. If you switch to the H4 chart, the lines will disappear because an hour cannot be displayed on a 4-hour candle.
2. “Indicator is off by a few hours.”
- Cause: Server Time vs. Local Time.
- Fix: This indicator uses your broker’s MT4 Server Time, not your local computer time. If your broker is GMT+2 and you are GMT-5, the lines will follow the broker’s candle closes. This is actually preferred for technical analysis, as price action respects server closes (New York Close).
3. Chart Freezing or Lagging
- Cause: Too many objects on the chart.
- Fix: If you have set the interval to a very low number (like 5) on a chart with extensive history (e.g., “Max bars in chart” set to 100,000), the indicator is trying to draw 20,000 vertical lines. Go to
Tools > Options > Chartsand reduce “Max bars in chart” to 5,000, or increase the indicator interval.
Recommended Resources
FAQ
u003cstrongu003eWhy is the indicator not showing any lines?u003c/strongu003e
Check your timeframe. The interval variable must be u003cemu003elargeru003c/emu003e than your current chart timeframe. Also, ensure you have enabled u0022DLL Importsu0022 in your MT4 settings if required.
u003cstrongu003eDoes this indicator repaint?u003c/strongu003e
No. Time is constant. Once a vertical line is drawn at a specific time (e.g., 12:00), it will never move or disappear.
u003cstrongu003eCan I use this for Binary Options?u003c/strongu003e
Yes. Timing is critical in Binary Options. Setting this to u003cstrongu003e5 (5M)u003c/strongu003e or u003cstrongu003e15 (15M)u003c/strongu003e can help you anticipate candle expirations.
Risk Warning: Trading Forex and CFDs involves significant risk and can result in the loss of your invested capital. You should not invest more than you can afford to lose and should ensure that you fully understand the risks involved. Past performance of any trading system or indicator is not necessarily indicative of future results.
IS THIS A CORRECT INDICATOR AS ITS NAME SHOWING . 123 PATTREN V7 INDICATOR .
yes its same indicator