

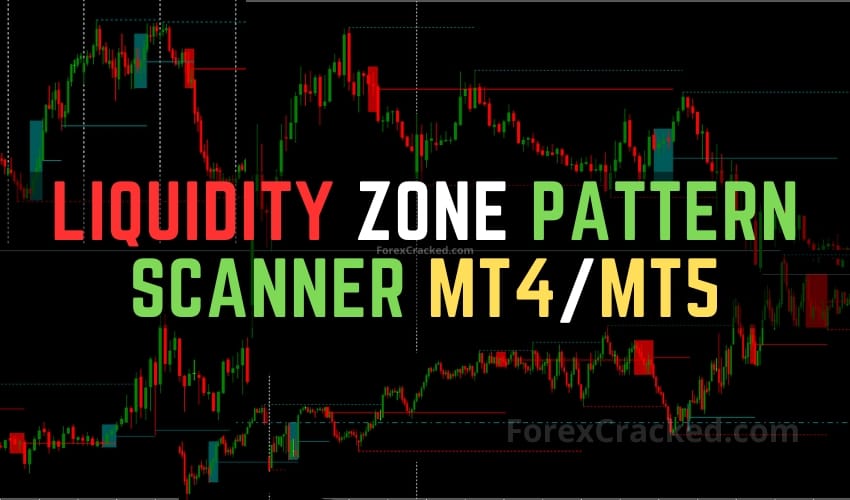
The Pattern Scanner Indicator is a charting tool rooted in concepts from the Wyckoff methodology, intended to assist traders in identifying potential market phases and price behaviors. Liquidity Zone indicator functions by automatically detecting major and minor patterns in the market, highlighting contraction ranges, expansion lines, and historical liquidity levels on a user’s chart. While it can serve as a comprehensive visual aid, its effectiveness depends largely on how it’s interpreted and integrated into a trading strategy.
Key Takeaways
- The Liquidity Zone Pattern Scanner is a free MetaTrader 4 and MT5 indicator that shows where liquidity sits on your chart
- It detects major and minor Wyckoff-style patterns automatically and draws the liquidity zones and expansion lines around them
- Key breakout levels are flagged as they form, so you trade the reaction at a marked level instead of guessing
- Zones are areas of interest rather than entry signals, and they carry the most weight on H1 and higher timeframes
- Works on any pair and timeframe, free to download below
Pattern Scanner Indicator Classification
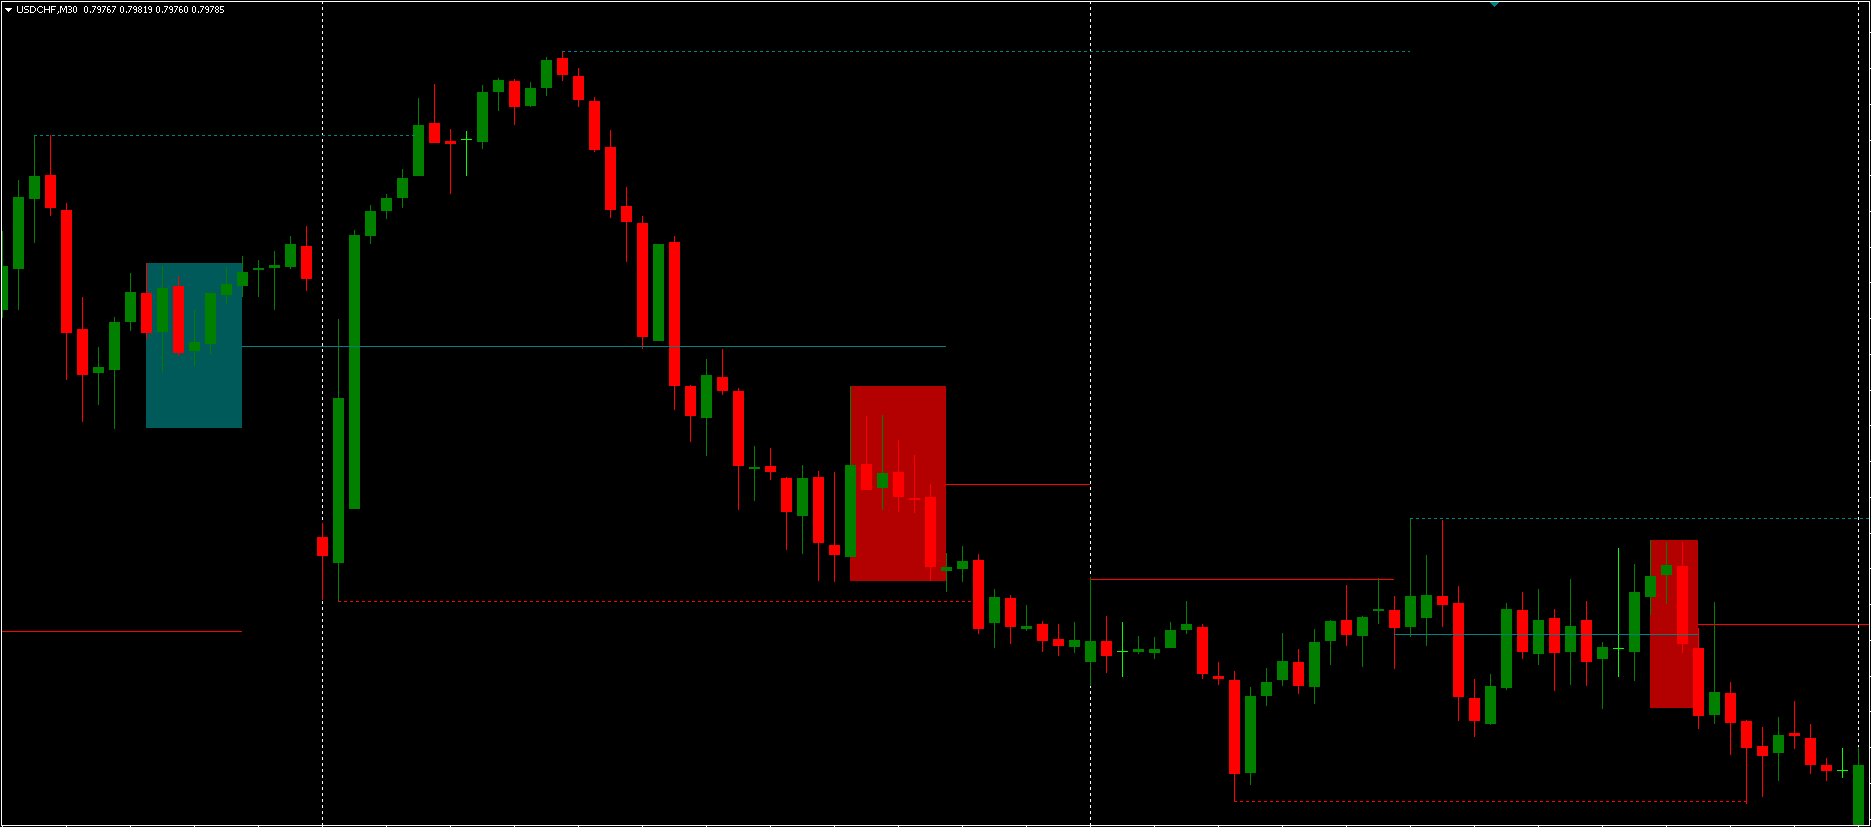
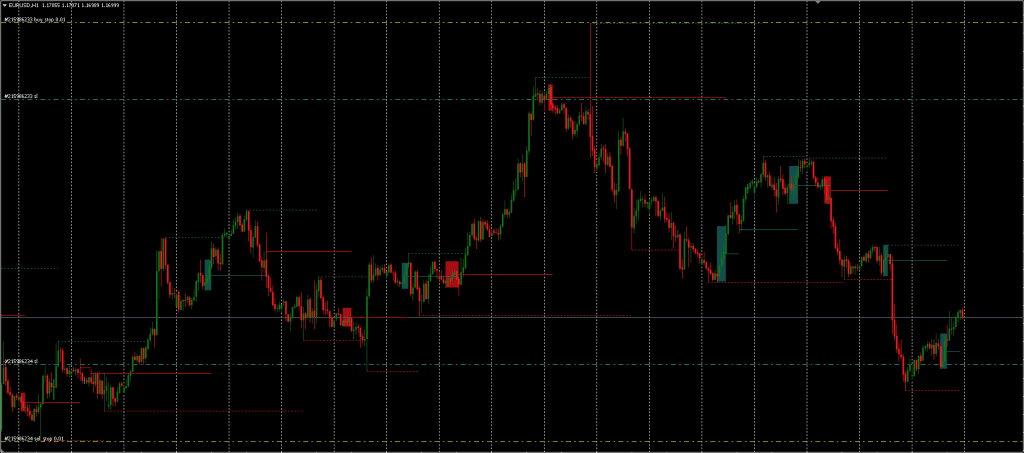
At the core of the Pattern Scanner Indicator is its approach to identifying contraction phases, typically indicative of market consolidation or indecision. The tool distinguishes between major and minor patterns based on how price action interacts with the contraction range boundaries.
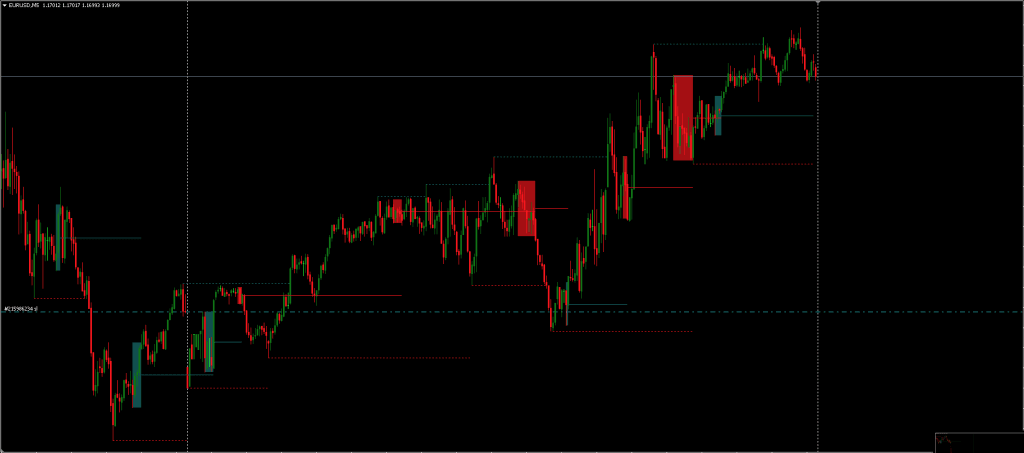
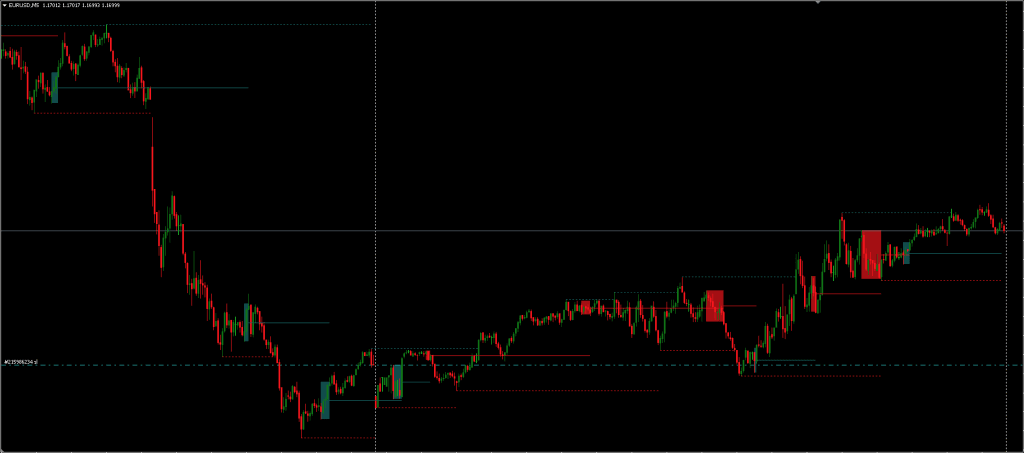
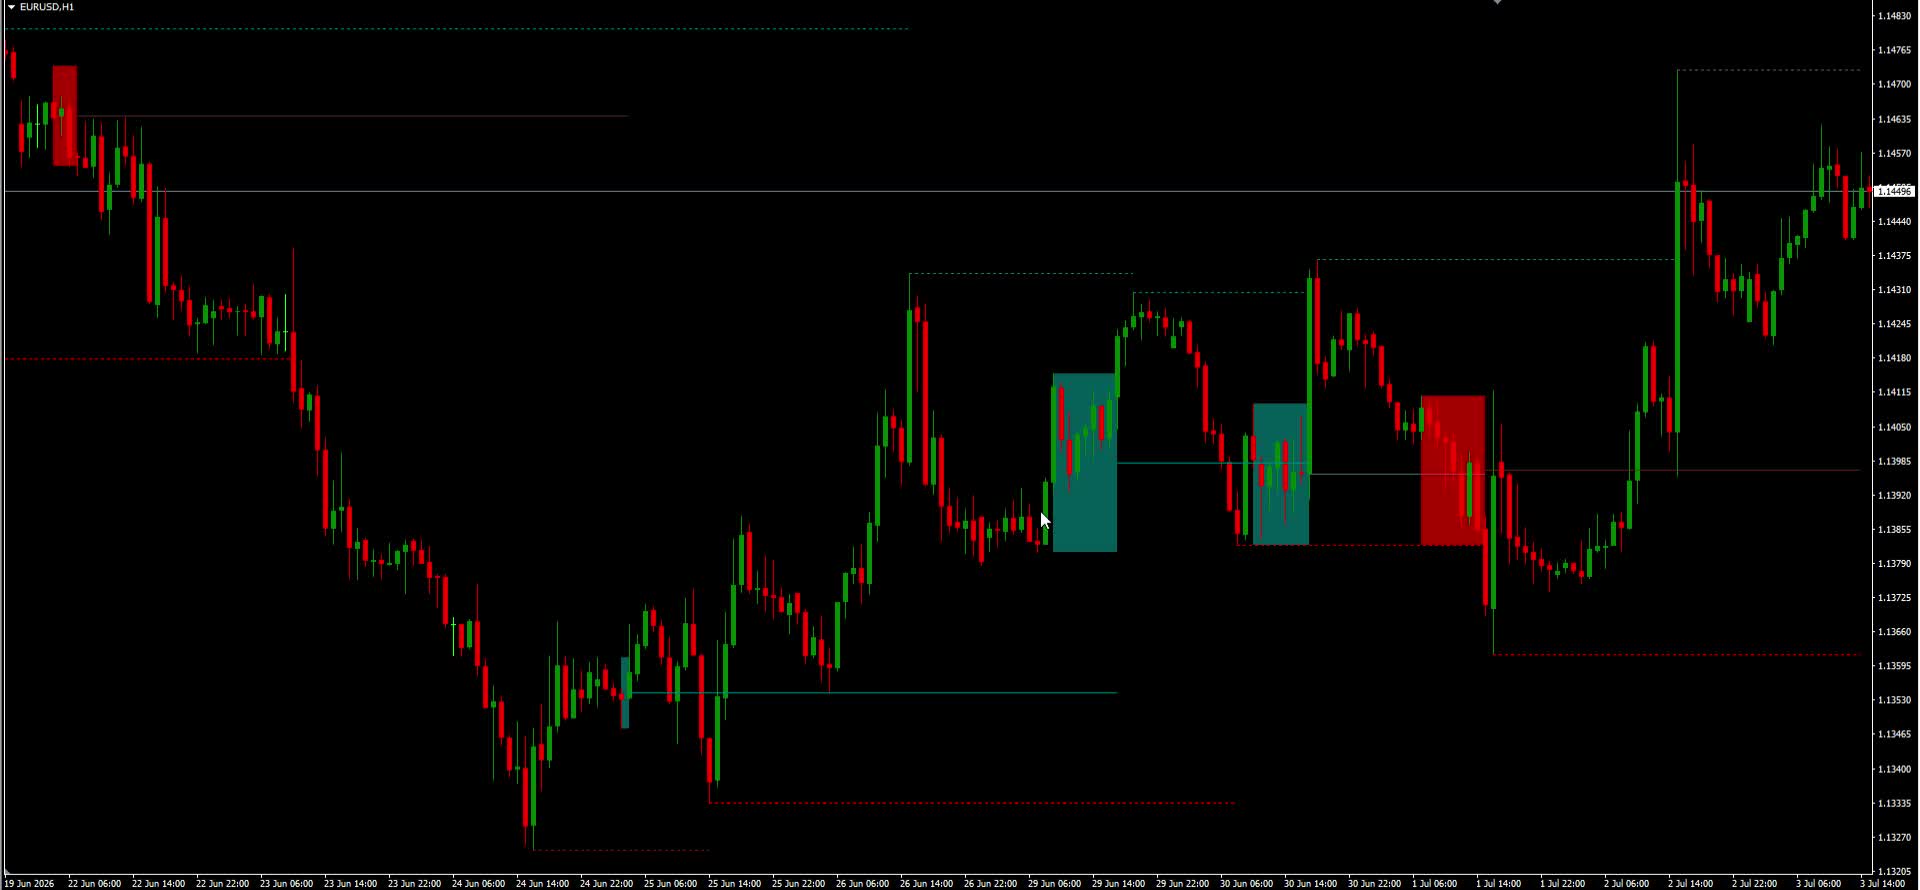
- Major Patterns occur when the price breaks both the upper and lower bounds of a defined contraction range. These are visually emphasized on charts with a highlighted border around the range.
- Minor Patterns are recorded when only one side of the contraction range is breached. Although less significant than major patterns, they may still offer context for short-term trading opportunities or trend development.
These classifications aim to bring structure to market noise, helping traders recognize potential turning points or moments when volatility could increase.
Liquidity Levels and Expansion Lines
A key feature of the Liquidity Zone indicator is its plotting of liquidity levels, which are derived from previous swing highs and lows. These levels serve as reference points and can potentially be used for establishing targets or positioning stops. However, it’s important to note that these levels are plotted based on historical data, meaning they reflect past price behavior and may not predict future movements.
The Pattern Scanner Indicator also displays expansion lines, calculated from the average of recent swing highs and lows. Price movements around these lines are interpreted to signal the onset of either a bullish or bearish master pattern. Typically, a break above the contraction range suggests bullish intent, while a downward break indicates a bearish candlestick pattern. That said, prices may hover around the expansion line before fully committing to a directional move, which can present ambiguity in interpretation.
This Liquidity Zone Indicator isn’t a standalone trading indicator System. Still, it can be very useful for your trading as additional chart analysis, to find trade exit position(TP/SL), and more. While traders of all experience levels can use this system, practicing trading on an MT4 demo account can be beneficial until you become consistent and confident enough to go live. You can open a real or demo trading account with most Forex brokers.
Configurable Settings of Liquidity Zone Indicator
To accommodate different analytical approaches, the Liquidity Zone Indicator includes several settings that traders can adjust:
- Contraction Detection Lookback: Determines how far back the tool searches for swing points to define contraction ranges.
- Liquidity Levels: Allows traders to modify the historical depth used to identify potential liquidity zones.
- Show Major/Minor Patterns: These toggles help customize the display by highlighting only the preferred pattern types.
These options provide flexibility, but they also require a certain level of understanding to calibrate effectively. Incorrect configurations may lead to either excessive signals or overlooked patterns.
How to Install the Liquidity Indicator on MetaTrader 4 and MT5
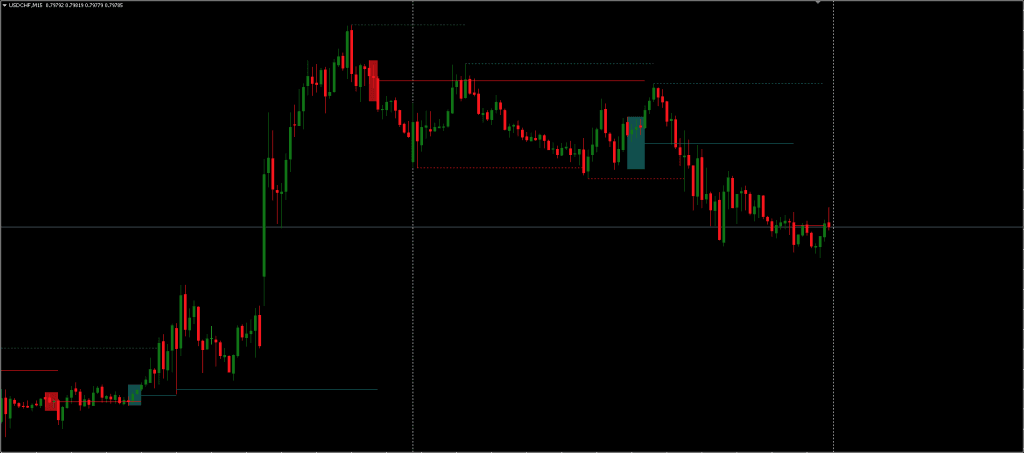
The scanner works on both MetaTrader 4 and MetaTrader 5, and the install is the same on either platform. Download the file below, then in your terminal open File > Open Data Folder, drop the indicator into MQL4 > Indicators (or MQL5 > Indicators on MT5), and restart the platform. Drag the indicator onto any chart and the liquidity zones, pattern boxes, and expansion lines draw automatically. It runs on any pair and timeframe, though the zones carry more weight on H1 and above where more volume sits behind each level.
If MetaTrader 4 liquidity analysis is what you are after, this is the practical way to see it: the indicator marks where resting orders cluster, so you watch how price reacts when it returns to a marked zone instead of trying to read raw volume, which MT4 does not provide for forex.
Practical Application for Master Pattern
In practice, the Master Pattern indicator is used to identify potential breakout points that align with a change in market direction. The contraction phase, defined by a lower high and higher low, outlines a period of reduced volatility, often preceding a breakout. When price exits this range, the expansion phase begins, and the expansion line becomes a central reference for potential support or resistance.
Traders may incorporate the Pattern Scanner Indicator within broader strategies, using it in conjunction with traditional technical tools or volume analysis. However, like most indicators, the Master Pattern is not predictive. It reflects past and present price structure, and its effectiveness will vary based on market conditions and individual usage.
Liquidity Zone Pattern Scanner
A free MetaTrader 4 and MT5 indicator that detects major and minor Wyckoff-style patterns, draws liquidity zones, and flags key breakout levels.
Pros
- Auto-detects major and minor patterns with liquidity zones and expansion lines
- Works on both MT4 and MT5, any pair and timeframe
- Practical liquidity view on a platform with no native order-book data
Cons
- Zones are areas of interest, not entry signals
- More reliable on H1 and above; noisy on very low timeframes
- Little official documentation from the developer
Summary
A practical way to see liquidity on MetaTrader, which does not show true order-book depth for forex. It marks the zones and breakout levels automatically, so you watch how price reacts at a drawn level instead of guessing. Zones are areas of interest rather than signals, so it works best paired with your own structure analysis and a stop.

 Built by ForexCrackedWe tested 1,200+ indicators. Then we built our own.Six years of reviewing EAs and indicators went into FXC Fusion: two engines, the seven-panel cockpit, MT4 and MT5, from the team behind this site.
Your download will start automatically. If it doesn’t, click here.Right now a download can take up to a minute to start. Please wait a moment, or use click here.
Liquidity zones pair naturally with the other smart money footprints. Mark where the moves start with the free Order Blocks indicator, track the imbalances they leave with the Fair Value Gaps (FVG) indicator, and read the trend behind it all with the BOS & CHoCH market structure indicator.
Frequently Asked Questions
Conclusion
The Pattern Scanner Indicator offers a structured method for analyzing market behavior through the lens of contraction and expansion. Designed with visual clarity and configuration options, it presents patterns and data points that some traders may find useful in forming trades or understanding price mechanics. Still, Liquidity Zone Indicators value ultimately depends on how it’s applied in the context of a complete trading plan.


Discussion no comments yet
Is this still working?
Nothing here yet
No one has asked anything about Liquidity Zone Pattern Scanner Indicator MT4/MT5 yet. First question gets answered.