

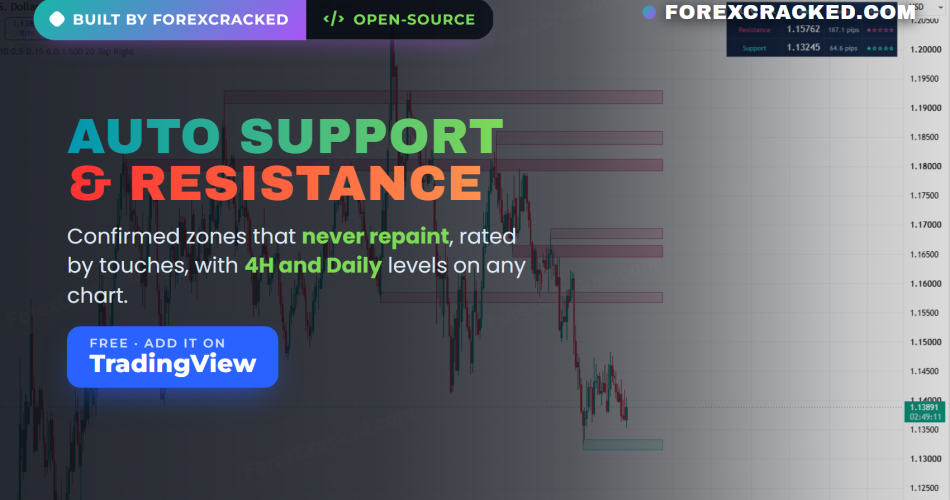
An auto support and resistance indicator for TradingView is only worth having if you can trust the lines it draws. Most of them plot a level the moment a candle pokes a high, then quietly move it later, which is the fastest way to lose faith in a tool. We built this one the other way around. A zone only appears once the swing behind it is confirmed, so a level that is on your chart stays where it is. It also rates every zone from one to five stars based on how many times price has actually respected it, and it pulls the 4H and Daily levels onto your chart while you trade a lower timeframe.
Key Takeaways
- Free, open-source TradingView indicator that draws support and resistance as zones from confirmed swing pivots, so levels do not repaint or slide around after the fact
- Every zone is rated one to five stars by how many times price has touched it, and stronger zones are shaded darker so the important levels stand out
- It draws 4H and Daily levels on your chart with a thicker border and a timeframe tag, so you can trade a lower timeframe without missing the big zones
- When price closes through a zone it flips, old resistance becomes new support, and a dashboard shows the nearest level above and below with the pip distance and star rating
What the auto support and resistance indicator draws
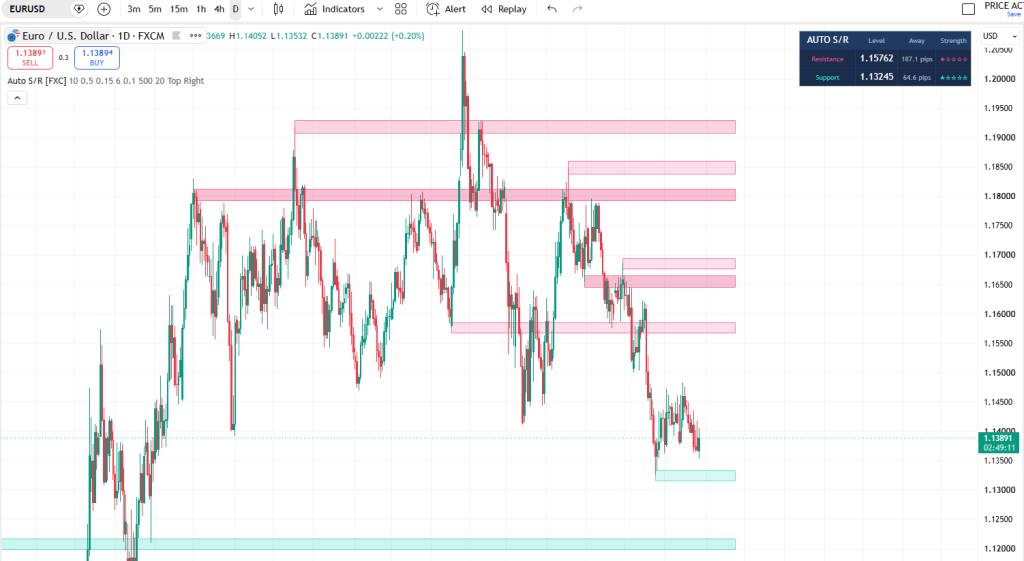
The tool watches for swing pivots and turns each confirmed one into a zone rather than a single line, because price reacts to areas and not to exact prices. Pivots that form close together get merged into one zone, and each merge counts as another touch, so a level that price has tested repeatedly ends up as one strong band instead of five thin ones stacked on top of each other. Support zones draw teal, resistance draws pink, and the more touches a zone has the darker it is shaded. You can read the chart’s structure in a second without counting anything.
Why the levels do not repaint
This is the part that matters most, and it is worth being precise about. A pivot high is only a pivot once a set number of bars have closed on both sides of it. That is how the indicator confirms a swing, and it means a zone appears a few bars after the swing actually happened. Some tools hide this by drawing the level instantly and then removing it if the swing fails, which looks better in a screenshot and is useless in live trading. We took the honest version. You see a level slightly later, and in exchange the level you see is real and will not move. Set the pivot strength higher for fewer and more significant zones, lower for more of them.
The 4H and Daily levels on your chart
Most traders lose money at levels they were not looking at. You trade the 15 minute chart, price stalls for no visible reason, and the reason was a Daily zone you had no way of seeing. This indicator requests pivots from two higher timeframes, 4H and Daily by default, and draws those zones directly on whatever chart you are on. They get a thicker border and a small tag showing which timeframe they came from, so you always know whether the zone in front of price is a local one or the one the whole market is watching. Both higher timeframes are configurable, and they only draw when they are actually higher than your current chart.
Star strength, breaks and flips
Every zone carries a rating from one to five stars, and the rule behind it is simple: one star per touch, capped at five. A fresh zone from a single swing starts at one star. A zone that price has come back to four times is a four star zone, and it is shaded to match. The dashboard shows the rating for the nearest level above and below price.
When price closes beyond a zone by more than a small ATR buffer, the zone breaks and flips sides. Old resistance becomes support, its touch count resets, and it keeps living on your chart in its new role. That is how support and resistance actually behaves, and it saves you from deleting a level that is about to become the most useful one on the chart. Weak zones that nothing has touched for a long time age out and disappear, but strong four and five star zones stay until price genuinely breaks them.
Settings
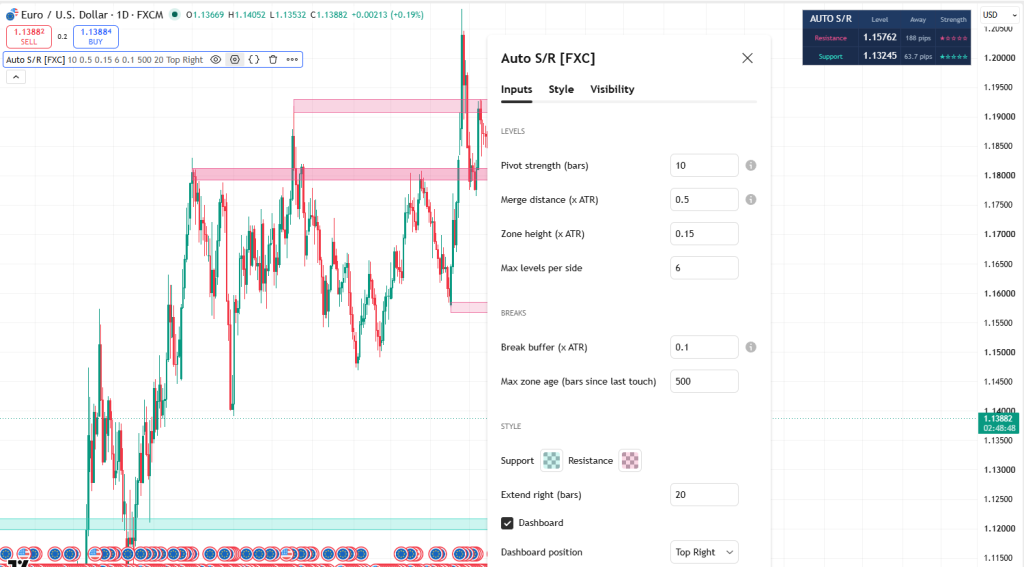
The defaults are tuned for a clean chart, and most people only touch the first two:
- Pivot strength: 10 bars. Raise it for fewer and stronger zones, lower it for more.
- Merge distance: 0.5x ATR. How close two pivots must be before they merge into one zone and count as an extra touch.
- Zone height: 0.15x ATR, so zones scale with the instrument’s volatility instead of a fixed pip value.
- Max levels per side: caps how many zones can sit above and below price, so the chart never fills up.
- Higher timeframe levels: 4H and Daily by default, each with its own pivot strength and level cap.
- Break buffer: 0.1x ATR. How far price must close beyond a zone to count as a real break rather than a wick through it.
- Max zone age and Keep strong levels: weak zones fade after a set number of bars, four and five star zones stay until broken.
How to add it on TradingView
- Open the script page: Auto Support & Resistance [ForexCracked] (link below).
- Click the star to add it to your favourite indicators.
- On your chart, open the Indicators menu, go to Favourites, and click Auto Support & Resistance [ForexCracked].
- Open the settings to adjust the pivot strength and the two higher timeframes to suit the pair you trade.
Auto Support & Resistance [ForexCracked]
![Auto Support & Resistance [ForexCracked]](https://www.forexcracked.com/wp-content/uploads/2026/08/auto-support-resistance-featured.png)
A free, open-source TradingView indicator that draws non-repainting support and resistance zones from confirmed pivots, rates them by touches, and shows 4H and Daily levels on any chart.
Pros
- Levels confirm before they draw, so they do not repaint
- Zones rated 1-5 stars by touch count
- 4H and Daily levels shown on lower timeframes
- Broken levels flip instead of vanishing
- Dashboard with nearest level, pip distance and strength
- Free and open-source
Cons
- A zone appears a few bars after the swing, the cost of confirming it
- Marks levels, does not time entries or trade for you
- Needs a pivot-strength tweak to suit very fast or very slow charts
Summary
We built this because most auto S/R tools draw a level instantly and then move it, which makes them useless the moment you try to trade off one. This one waits for the swing to confirm, merges nearby pivots into a single zone, rates each zone by how often price has respected it, and brings the 4H and Daily levels down onto your chart. Free and open-source.
 Need a TradingView account?The free plan runs this indicator, with charts, alerts and watchlists.
Start free
Need a TradingView account?The free plan runs this indicator, with charts, alerts and watchlists.
Start free

 Built by ForexCrackedWe tested 1,200+ indicators. Then we built our own.Six years of reviewing EAs and indicators went into FXC Fusion: two engines, the seven-panel cockpit, MT4 and MT5, from the team behind this site.
How to trade with it
Zones are areas to make a decision at, not signals to trade blindly. The way we use it is straightforward. Start with the dashboard, since it tells you the nearest level above and below and how far away each one sits, which immediately frames your risk. Give more weight to the four and five star zones and to anything tagged 4H or Daily, because those are the levels the rest of the market can see. When price arrives at a zone, wait for it to do something you can act on, a rejection wick, a failed break, or a clean close through it, then take your entry with a stop on the far side of the zone rather than a few pips inside it. A zone that breaks and flips is worth watching for a retest, because that first return to a flipped level is often the cleanest entry the chart offers all session.
The MetaTrader versions and the levels behind them
Trade MetaTrader, or want the levels calculated rather than drawn? We publish the same idea in a few forms. Grab the auto support and resistance indicator for MT4 and MT5, try the fractal support and resistance indicator if you prefer levels built from fractals, work out classic pivot levels with the free pivot point calculator, browse every support and resistance tool we have collected, or explore the full free forex indicators library.
Frequently Asked Questions
Add the Auto Support & Resistance indicator on TradingView
Auto Support & Resistance is free and open-source. Add it to your charts here: Auto Support & Resistance on TradingView
Risk disclaimer: The Auto Support & Resistance indicator is an analytical tool that marks price levels from confirmed swing structure. It does not predict future price movement and it does not place trades. Levels break, and results depend on market conditions, your settings, and your own execution and risk management. This is shared for educational purposes and is not financial advice.


Discussion no comments yet
Is this still working?
Nothing here yet
No one has asked anything about Auto Support and Resistance Indicator for TradingView: Confi yet. First question gets answered.