
Introduction: The “Holy Grail” of Reversal Trading?
Every trader wants to buy the exact bottom and sell the same top. It is the ultimate dream of trading. But in reality, most traders who try to catch these turning points end up catching “falling knives”—buying just before the price crashes further.
The Vertex Alerts Arrows Indicator for MetaTrader 4 (MT4) claims to fix this problem. It uses a composite algorithm that blends Momentum calculations with Bollinger Band envelopes to pinpoint market exhaustion levels with high precision.
Instead of making you stare at messy lines and calculate deviations in your head, it gives you clear, actionable visuals: Green (Buy) and Red (Sell) arrows.
But is it reliable? Does it “repaint” and vanish when you are losing? And can it survive in a volatile 2025 market?
In this comprehensive review, we will break down exactly how it works, expose its weaknesses, and give you a specific “False Check Strategy” to filter out the bad signals and keep the winners.
What is the Vertex Alerts Arrows Indicator?
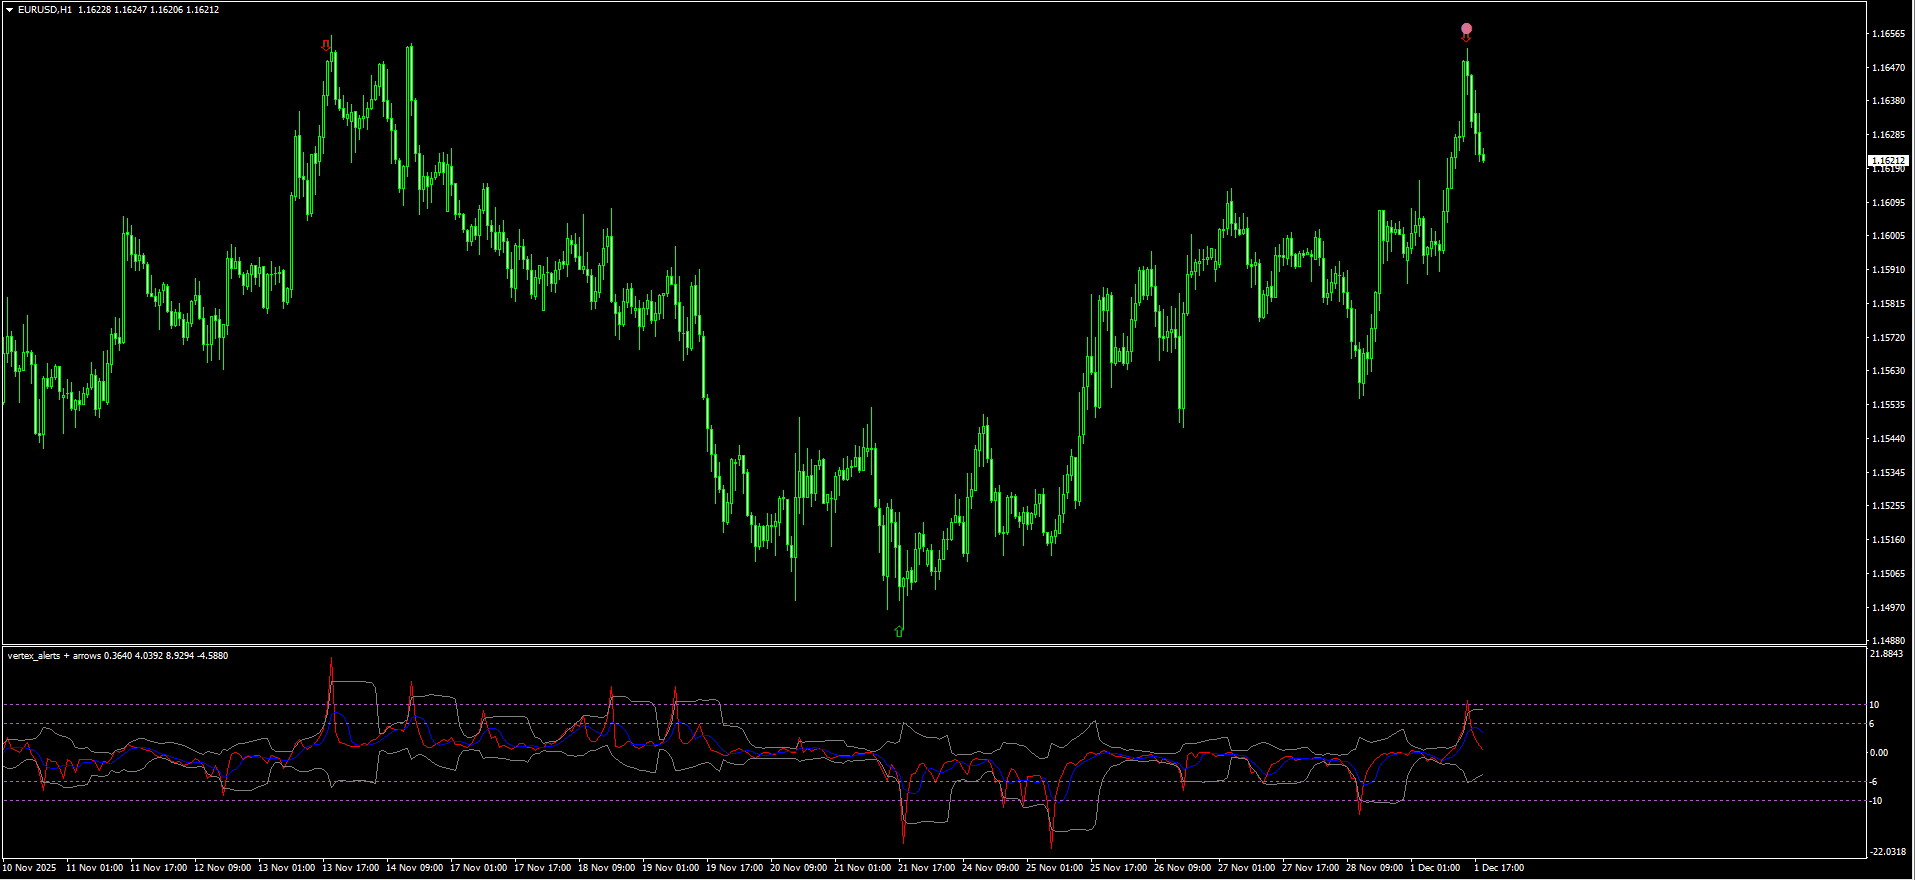
The Vertex Alerts Arrows is a custom oscillator that sits in a separate window below your main chart. It is designed to identify Extreme Overbought and Extreme Oversold conditions.
Most standard oscillators, like the Relative Strength Index (RSI), rely solely on the speed of price movement. Vertex takes a more sophisticated approach. It calculates a “modified momentum” value and wraps it in a dynamic volatility envelope (similar to Bollinger Bands).

The Visual Signals Explained:
The indicator communicates with you through a system of Arrows and Dots:
- Moderate Signal (The Arrow):
- Green Arrow: Appears when the signal line touches the -6 level (Oversold). This suggests a potential bounce.
- Red Arrow: Appears when the signal line touches the +6 level (Overbought). This suggests a potential pullback.
- Strong Signal (The Dot):
- Blue Dot: Appears when momentum crashes deep into the danger zone, below -10. This indicates “capitulation”—sellers are exhausted.
- Pink Dot: Appears when momentum surges into euphoria, above +10. This indicates “FOMO”—buyers are exhausted.
The Science: Why Mean Reversion Works
To trade this indicator successfully, you need to understand the theory of Mean Reversion.
Prices rarely move in a straight line forever. They act like a rubber band. When stretched too far (High Momentum + High Volatility), the rubber band must eventually snap back to the center (the average price).
The Vertex Indicator measures the “tension” in that rubber band.
- Standard Bollinger Bands measure price deviation.
- Vertex measures momentum deviation.
By combining these two, it identifies points where the market has statistically stretched too far and is mathematically probable to reverse.
Vertex vs. Standard Bollinger Bands
You might be asking, “Why should I download this custom tool if I already have Bollinger Bands?”
Here is the comparison:
| Feature | Standard Bollinger Bands | Vertex Alerts Arrows |
| Visuals | Lines on the main chart (can be messy) | Oscillator in a separate window (clean) |
| Signal Type | Visual touch of the band | Clear Arrow/Dot trigger |
| Calculation | Price deviation | Momentum deviation |
| Lag | Higher (Price must close outside band) | Lower (Reacts to momentum spikes) |
| Best For | Trend Following / Squeeze | Scalping Reversals |
Review: Pros and Cons
Before you add this to your chart, you need to know the truth. No indicator is perfect, and Vertex is no exception.
PROS (The Good)
- Visual Simplicity: You don’t need to analyze complex math; look for the Arrow + Dot combination.
- High Win Rate in Ranging Markets: If the market is bouncing sideways (in a Consolidation), this indicator is deadly accurate.
- Customizable: You can adjust the “Control Period” to make it faster (for scalping) or slower (for swing trading).
- Audio Alerts: Most versions come with pop-up and email alerts, so you don’t have to stare at the screen.
CONS (The Bad)
- Repainting Risk: Like many “centered” oscillators, the arrows can shift or disappear while the candle is still open. Never trade until the candle closes.
- Dangerous in Strong Trends: In a strong crash (e.g., a News Event), the indicator will repeatedly show “Buy” signals while the price keeps falling. (We fix this with the strategy below.)


The Strategy: How to Trade Vertex Without “Blowing Up”
If you blindly buy every Green Arrow, you will lose your account. Strong trends kill reversal indicators.
To make this profitable, we need a “False Check” Filter. We will use the 50 Exponential Moving Average (EMA) to act as our “Trend Guard.”
Setup & Settings
- Vertex Alerts Arrows: Default Settings (Control Period: 14).
- 50 EMA: Trend Filter (Applied to Close).
- Timeframe: M15 or H1 (Best balance of noise vs. signal).
1. The “Strong” Buy Strategy
We are looking for a deep pullback in an uptrend, or a hard bounce from support. We do not catch falling knives in a downtrend.
- The Filter: Price should be near or above the 50 EMA. (If price is way below the 50 EMA and crashing down, IGNORE the buy signal).
- The Signal: Wait for the Vertex line to drop below -10.
- The Trigger: Look for a GREEN ARROW + BLUE DOT combination.
- Note: The Dot confirms the signal is “Strong.”
- Entry: Enter at the Close of the candle.
- Stop Loss: Below the recent Swing Low (usually 5-10 pips).
- Take Profit: Exit when the Vertex line touches the Zero Level or prints a Red Arrow.
2. The “Strong” Sell Strategy
We are looking for a rally to hit a wall.
- The Filter: Price should be near or below the 50 EMA.
- The Signal: Wait for the Vertex line to rise above +10.
- The Trigger: Look for a RED ARROW + PINK DOT combination.
- Entry: Enter at the Close of the candle.
- Stop Loss: Above the recent Swing High.
- Take Profit: Exit when the Vertex line touches the Zero Level or prints a Green Arrow.
Pro Tip: If you see an arrow without a dot (Weak Signal), skip it unless you are an advanced scalper. The Dot is your safety belt.
Best Pairs and Timeframes
Not all currency pairs behave the same. Because Vertex is a mean-reversion tool, it works best on pairs that tend to range.
- Best Pairs: EUR/USD, AUD/CAD, AUD/NZD, EUR/GBP. (These pairs often respect support/resistance levels).
- Worst Pairs: Gold (XAU/USD) and GBP/JPY. (These pairs trend extremely hard and can blow through “Overbought” levels for days).
- Best Timeframes:
- M15: For intraday scalping.
- H1: For stable, high-probability trades.
- Avoid M1: Too much random noise and fake signals.
Indicator Settings: Tuning the Engine
When you open the indicator inputs, you will see Control_Period and Signal_Period. Here is how to hack them for your style:
- Control_Period (Default: 14):
- For Scalping: Lower this to 10. This makes the indicator more sensitive. You will get more signals, but more false alarms.
- For Swing Trading: Increase this to 20 or 24. This smooths out the line. You will only get signals at major turning points.
- Process_Marks (Default: 1):
- This usually controls the visual size of the arrows. Leave as the default unless they are cluttering your chart.
Caption: “Understand the math: This video explains the ‘Bollinger Band Squeeze’ and Reversal logic that powers the Vertex Indicator’s signals.”
How to Install the Vertex Indicator on MT4
If you are new to custom indicators, follow this simple guide:
- Download the Vertex_Alerts_Arrows.ex4 file from the link below.
- Open your MetaTrader 4 platform.
- Click File > Open Data Folder.
- Navigate to MQL4 > Indicators.
- Paste the downloaded file into this folder.
- Right-click on the “Navigator” window in MT4 and select Refresh.
- Find “Vertex Alerts Arrows” in the list and drag it onto your chart.
- Make sure to check “Allow DLL Imports” in the Common tab if requested (though usually not needed for this indicator).
Troubleshooting & FAQ
The arrows are disappearing! Is it broken?
This is called u0022repainting.u0022 The indicator is calculated based on the current price. If the candle hasn’t closed yet, the price can move back, invalidating the signal. Rule #1: Never enter a trade until the candle has fully closed and the arrow is u0022locked in.u0022
Can I use this for Binary Options?
Yes, Vertex is extremely popular for u003ca href=u0022https://forexcracked.com/tag/binary/u0022 target=u0022_blanku0022 data-type=u0022post_tagu0022 data-id=u00223310u0022 rel=u0022noreferrer noopeneru0022u003eBinary Optionsu003c/au003e. Traders often use the u0022Dotu0022 signal to take a reversal trade ahead of the next candle’s expiry.
I am not getting any alerts.
Check the u0022Inputsu0022 tab. Ensure Sound_Alerts or Email_Alerts is set to true. Also, make sure your speakers are on!
Conclusion: Final Verdict
u003cstrongu003eVertex Alerts Arrows Indicatoru003c/strongu003e
Summary
The u003cstrongu003eVertex Alerts Arrows Indicatoru003c/strongu003e is one of the best u003cstrongu003evisual u003c/strongu003eoscillators for MT4 because it combines two powerful concepts (Bollinger Bands + Momentum) into one easy-to-read window. It removes the guesswork of reading charts.u003cbru003eHowever, it is not a magic wand. You u003cstrongu003eMUSTu003c/strongu003e wait for the candle to close to avoid repainting, and you u003cstrongu003eMUSTu003c/strongu003e use the 50 EMA filter to avoid betting against a strong trend.