

Gold Pivot Breakout EA is an automated MetaTrader 5 (MT5) robot that trades XAUUSD (gold) with five breakout strategies at once, each on a different swing level. We ran a real-tick backtest over the same months as its public live signal: 495 trades against the live account’s 488, the same worst trade to within 21 cents, the same 13-trade losing streak to within a nickel. That is the closest agreement with a vendor’s live record we have recorded. Free download at the bottom.
What is the Gold Pivot Breakout EA? It is an MT5 expert advisor that trades gold only. It places buy stop and sell stop orders at prior swing highs and lows, sets the stop loss and take profit as a percentage of the gold price rather than a fixed distance, and manages the winner with a trailing stop. No grid, no lot doubling, and it holds a position for about 36 minutes.
TL;DR – Hard stop on every trade, no grid. Our real-tick test reproduced its 6-month live signal almost exactly, on shipped settings. The catch is the deposit: it needs $1,000, not the advertised $100.
Core Strategy and Logic of Gold Pivot Breakout EA
Every order in our backtest log names the strategy that placed it, PendingA to PendingE.
- Not swing trading, despite the name – It trades swing levels, but holding time averaged 36 minutes in our test and 44 live.
- Five breakout strategies at once – Each works a different level depth and switches off separately. Of 1,112 tagged pendings, E placed 338, D 267, A 221, C 214, B 72.
- Swing highs and lows, not indicators – Pendings sit on earlier highs and lows until the level changes; one deep sell stop sat at 4,101 for seven weeks before gold reached it. Same idea as the High Low Trading Robot.
- Stops scale with the gold price – The vendor’s headline claim holds exactly. Stop loss was 0.30% of entry on A, C and D, 0.28% on E, 1.00% on B, take profits 1.50% to 2.50%. At gold near $5,600 that stop was $15.30, at $3,944 $11.89.
- Hard stop loss, no grid – Every entry order carries a stop loss and every volume is 0.01 lots, the opposite of the Quantum Queen gold grid engine and its unprotected basket.
- The trailing stop does the exiting – 492 of 494 closed trades exited on their stop loss order; two reached a take profit.
- Weekend protection is real – Pendings are deleted every Friday at 21:00, 192 across 21 Fridays in our log.
Please test in a demo account first for at least a week. Also, please familiarize yourself and understand how this MT5 Gold Robot works, then only use it in a real account.
Recommendations
- Minimum deposit: $1,000 at 1:100 leverage, the size our matching test ran. Below $500 it runs out of margin (see the guide below).
- Pair and timeframe: XAUUSD only, any timeframe. We tested on H1.
- Account type: Low spread ECN. The vendor asks for gold spreads inside 25 points against a 500-point default, so tighten
Inp_MaxSpreadPts. - VPS is effectively required. It arms and cancels pending orders around the clock (FXVM).
- Check your balance on the margin calculator, then size with the lot size optimizer (Find the Perfect Broker For You Here).
Performance Review of Gold House: Our Backtest vs the Live Signal
1. The live record
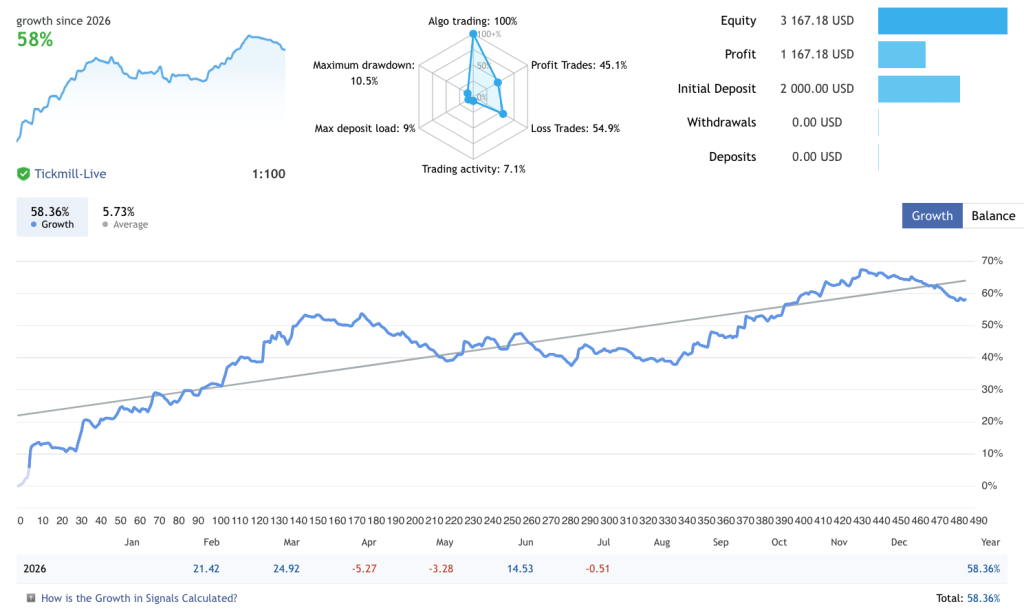
Deposits: 0. Withdrawals: 0. One $2,000 deposit went in and nothing has come out since, so the growth figure is real rather than the cash-flow artifact you get on topped-up signals. The account runs a vendor preset, Profit Priority Mode, which the listing does not publish.
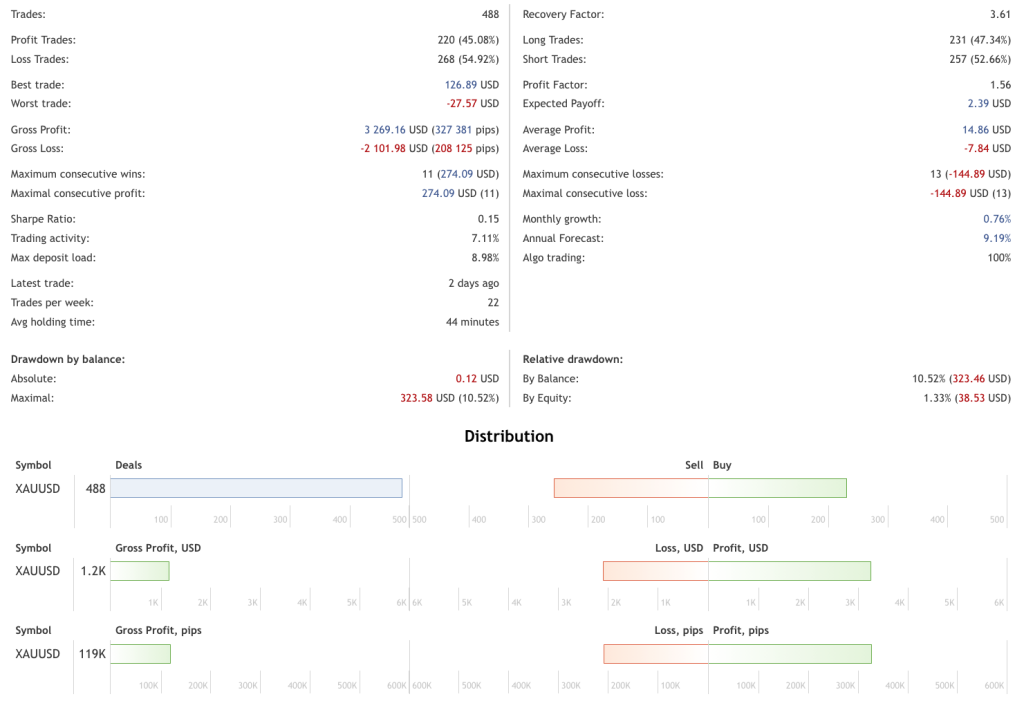
2. Our backtest lands on the same numbers
| Metric | Live signal ($2,000) | Our backtest ($1,000) |
|---|---|---|
| Period | Feb – Jul 2026 | 12 Feb – 26 Jul 2026 |
| Settings | Profit Priority Mode preset | Chart defaults, all 5 strategies on |
| Trades | 488 | 495 |
| Win rate | 45.08% | 46.67% |
| Profit factor | 1.56 | 1.51 |
| Expected payoff | $2.39 | $2.19 |
| Gross profit | $3,269.16 | $3,202.72 |
| Gross loss | -$2,101.98 | -$2,120.68 |
| Net profit | +$1,167.18 | +$1,082.04 |
| Best trade | +$126.89 | +$126.72 |
| Worst trade | -$27.57 | -$27.36 |
| Average win / loss | $14.86 / $7.84 | $13.86 / $7.98 |
| Longest losing run | 13 trades, -$144.89 | 13 trades, -$144.84 |
| Max balance drawdown | $323.58 (10.52%) | $317.35 (16.60%) |
| Long / short | 231 / 257 | 234 / 261 |
| Average holding time | 44 minutes | 36 minutes |
Read the bold rows. Two independent records arrived at the same best trade to 17 cents, the same worst trade to 21 cents and the same longest losing streak to 5 cents, with dollar drawdowns of $323.58 against $317.35. Not a directional match, the same strategy taking the same trades. More useful to a buyer: the chart defaults reproduce the live account, so the preset sent privately after purchase is not what makes it work.
The percentages differ only because the deposits do. Both ran roughly 0.01 lots, so dollars are the honest comparison: our +$1,082 on $1,000 reads as 108%, the live +$1,167 on $2,000 as 58%.
3. Same six months, same direction
| Month | Live signal | Our backtest |
|---|---|---|
| Feb 2026 | +$428.41 | +$304.95 |
| Mar 2026 | +$605.05 | +$557.31 |
| Apr 2026 | -$159.82 | -$139.79 |
| May 2026 | -$94.30 | -$74.44 |
| Jun 2026 | +$403.95 | +$489.11 |
| Jul 2026 | -$16.11 | -$24.53 |
Every month agrees in direction, February lighter because our test starts on the 12th. The strong months are the tail of gold’s run toward $5,250, the flat ones the slide back toward $4,000, so the 58% headline describes one favourable regime rather than six months of grinding.
4. What deposit you need, and which strategies to run on it
We ran the identical test twice, changing only the deposit.
| $100 deposit | $1,000 deposit | |
|---|---|---|
| Trades | 68 | 495 |
| Net result | -$47.02 (-47%) | +$1,082.04 (+108%) |
| Profit factor | 0.89 | 1.51 |
| Max positions open at once | 2 | 6 |
| Lowest margin level | 61.38% | 534.23% |
| Longest stretch with no trades | 8 weeks | none |
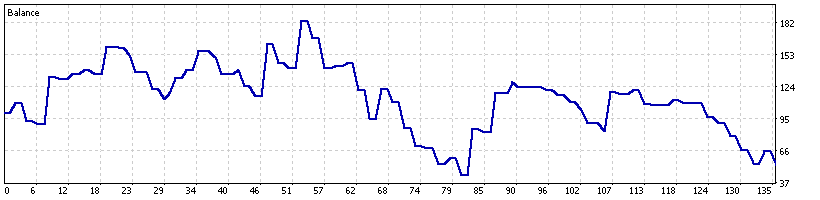
A 0.01-lot gold position is one ounce of notional, so at 1:100 leverage its margin is the gold price over 100, roughly $40 to $56 here, plus a 5% reserve. On $100 that funds two positions at the start and none after 17 April, so from 20 April to 8 June it placed one order a week at most.
Starvation also inverts which strategies look good, so the per-strategy read has to come from the $1,000 run:
| Strategy | $100: trades / net | $1,000: trades / net | Win rate | Per trade | Peak own positions |
|---|---|---|---|---|---|
| PendingA | 26 / +$100.64 | 97 / -$94.21 | 37.1% | -$0.97 | 2 |
| PendingB | 17 / +$26.22 | 28 / +$21.75 | 57.1% | +$0.78 | 1 |
| PendingC | 14 / -$61.21 | 98 / +$289.59 | 46.9% | +$2.96 | 2 |
| PendingD | 9 / -$97.05 | 103 / +$413.84 | 49.5% | +$4.02 | 3 |
| PendingE | 2 / -$15.62 | 168 / +$466.82 | 48.8% | +$2.78 | 4 |
PendingE looked worthless on 2 trades; given margin it took 168 and earned the most of any strategy, while PendingA, the only winner at $100, is the only loser at $1,000. Stack the subsets and the choice sharpens:
| Enabled | Trades | Net | Worst drawdown | Peak positions | Margin needed |
|---|---|---|---|---|---|
| All five (default) | 494 | +$1,097.79 | $301.48 | 6 | $354 |
| Everything but A | 397 | +$1,192.00 | $191.91 | 6 | $354 |
| C + D + E | 369 | +$1,170.25 | $218.41 | 5 | $295 |
| D + E | 271 | +$880.66 | $246.65 | 5 | $295 |
| D alone | 103 | +$413.84 | $99.77 | 3 | $177 |
Margin is worst case for our window: gold at $5,600, plus the 5% reserve. Switching A off would have beaten the shipped set while cutting the worst drawdown by a third.
- $2,000 and up – The shipped set. Room for all six positions with a wide buffer, which is what the live account runs.
- $1,000 to $2,000 – Everything but A. Same coverage, a third less drawdown.
- $500 to $1,000 – C, D and E. Keeps 95% of the profit on a quarter fewer trades.
- Below $500 – D alone, at 103 trades over six months instead of 494. Below about $300 nothing works, because one position can cost $56.
Two confidence levels here. The position counts and margin figures are measured, so the account-size guide is arithmetic. The profit split is attribution inside one all-five run, and switching a strategy off changes what the others see, since they share a 15-minute cooldown and compete for the same margin. PendingA’s deficit is also only 1.2 standard errors from its break-even win rate, so demo it before switching it off.
5. Where the risk actually sits
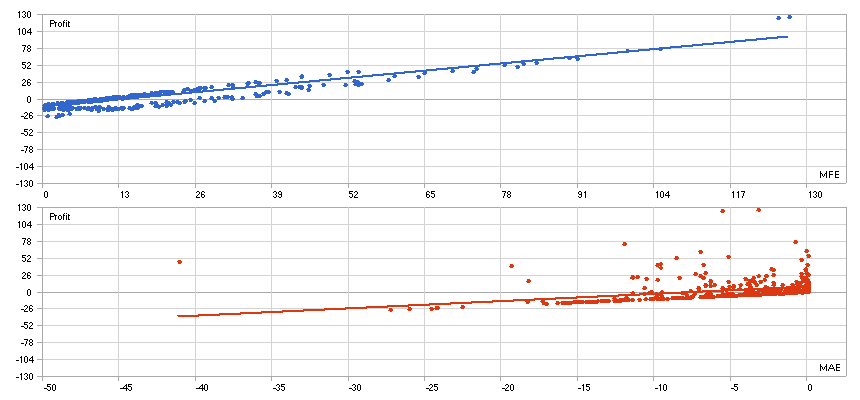
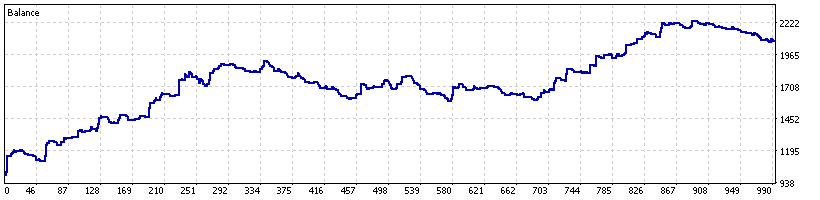
That diagonal is the best argument for this EA: no tail of runaway losers, because every position has a hard stop and there is no basket to average into.
The real risk is streakiness. The Z-Score is -7.95 at 99.74% confidence, so results cluster into runs, and both records confirm it with a 13-trade losing streak costing about $144. On $1,000 at 0.01 lots that produced a 16.60% balance drawdown; check it on the drawdown calculator before funding.
The take profit is nearly decorative, reached twice in 494 exits, so read the advertised reward-to-risk as a ceiling. Partial closes are advertised too, but 0.01 is the minimum lot, so that never fires. The Gold Reflex EA shows the same pattern.
Gold Pivot Breakout EA
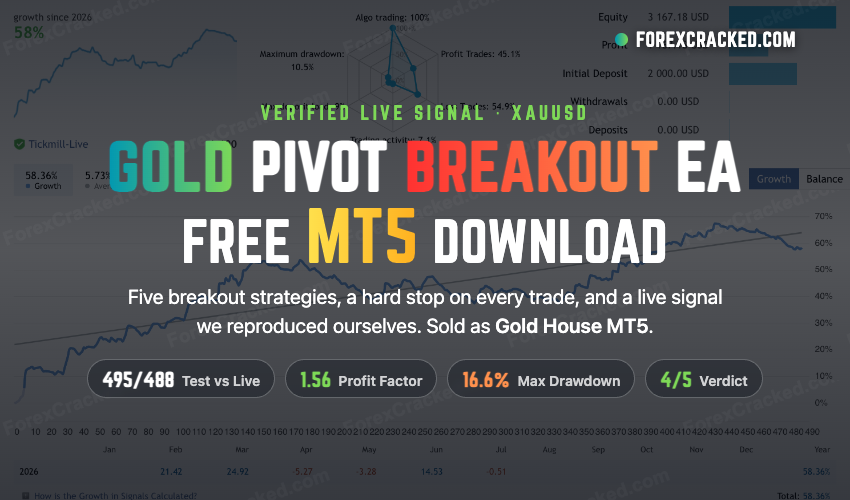
MT5 XAUUSD breakout robot running five stop-order strategies at once. Our real-tick backtest on shipped defaults matched its live signal on trade count, win rate, profit factor and worst trade.
Pros
- Live signal independently reproduced by our real-tick test, 495 trades against 488
- Hard stop on every position across 1,112 pending orders, no lot progression
- Stops and targets are a fixed percentage of the gold price, so settings do not go stale
- Strategies can be enabled individually to fit the account size
Cons
- The advertised $100 minimum is unworkable; the same settings lost 47% on it
- Losses cluster (Z-Score -7.95 at 99.74%); worst run 13 trades for -$144
- PendingA lost money in our window, yet ships enabled
- 6 months of live history, two-thirds of the gain in the first two
Summary
The strongest live-versus-backtest agreement in our review set, held back from 5 only because the advertised $100 minimum is arithmetically impossible at current gold prices.

 Built by ForexCrackedWe tested 1,200+ indicators. Then we built our own.Six years of reviewing EAs and indicators went into FXC Fusion: two engines, the seven-panel cockpit, MT4 and MT5, from the team behind this site.
EA-vs-EA Comparison
| Gold Pivot Breakout EA | Gold Strike EA | Gold Grid Strategy EA | |
|---|---|---|---|
| Strategy | Breakout, 5 levels | Breakout scalper | Trend-aligned grid |
| Hard stop loss | Yes, every order | Yes | No, basket only |
| Live profit factor | 1.56 | 1.66 | 3.28 |
| Live max drawdown | 10.5% | 21.4% | 21.2% |
| Backtest matches live | Yes, 495 vs 488 trades | No, 6.75 vs 1.66 PF | Yes, 218 vs 217 trades |
| Platform | MT5 | MT4 | MT5 |
Frequently Asked Questions (FAQ)
Conclusion
Very few robots we test survive a matched backtest this well. Ours put 495 trades against the live account’s 488 and landed on the same worst trade, the same longest losing streak and nearly the same dollar drawdown, so the published record is the strategy working rather than a curve fitted for a listing. However, the advertised deposit is wrong by an order of magnitude, so fund this at $1,000, match the enabled strategies to your balance, switch the drawdown stop on, and expect a losing run of a dozen trades at some point.


Discussion no comments yet
Is this still working?
Nothing here yet
No one has asked anything about Gold Pivot Breakout EA yet. First question gets answered.