

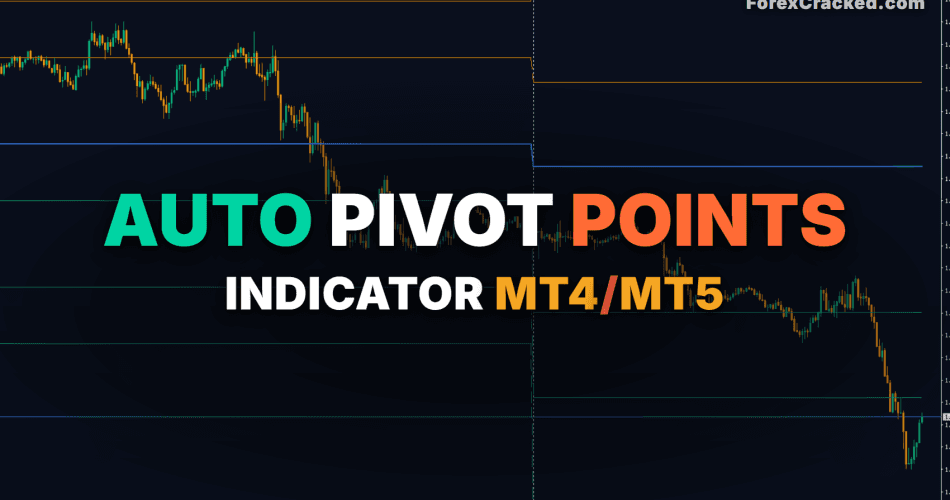

Pivot points are the most-watched support and resistance levels in trading. That is exactly why they work. Floor traders used them for decades. Bank desks still mark them every morning. And because so many traders watch the same levels, price genuinely reacts to them. The catch: calculating them by hand, every session, across multiple timeframes, is a chore nobody keeps up for long.
The TCL Auto Pivot Points indicator removes that chore. It is a free indicator for MetaTrader 4 and MetaTrader 5, built by Trade Code Labs, that plots accurate pivot levels automatically. And it does one thing most pivot indicators miss: it detects your chart timeframe and applies the correct pivot period without you touching a setting.
This review covers all four calculation methods, the auto-timeframe logic, how to actually trade pivots, and whether it belongs on your charts.
ForexCracked is an independent forex resource. We review and feature Trade Code Labs’ free indicators for our readers with Trade Code Labs’ permission. The two are separate companies. This is an independent review, not a vendor advertisement.
What Is the Auto Pivot Points Indicator?
A pivot point is a price level calculated from the previous period’s high, low, and close. It produces a central pivot (PP) plus a ladder of support levels (S1, S2, S3) below it and resistance levels (R1, R2, R3) above it. Traders use the central pivot to gauge daily bias: above it is bullish, below it is bearish. The S/R ladder gives you targets and reversal zones. (Investopedia has the full formula breakdown if you want the raw math.)
The TCL Auto Pivot Points indicator plots all of that automatically. Three things set it apart from the basic pivot tools bundled with most platforms:
- Four calculation methods. Classic, Fibonacci, Woodie, and Camarilla, each suited to a different style of trading.
- Auto-timeframe detection. It reads your chart and applies Daily, Weekly, or Monthly pivots automatically, because the right pivot period depends entirely on the timeframe you trade.
- Non-repainting, fixed levels. Once a session opens, the levels lock for the entire period and never shift.
It runs on MT4 and MT5, it is free with unlimited activations, and the current build is version 1.4.
How It Works (The Four Pivot Calculation Methods)
This is the part most traders skip, and it is the part that matters most. The four modes are not interchangeable. Each was designed for a different market behaviour.
Classic Mode (default)
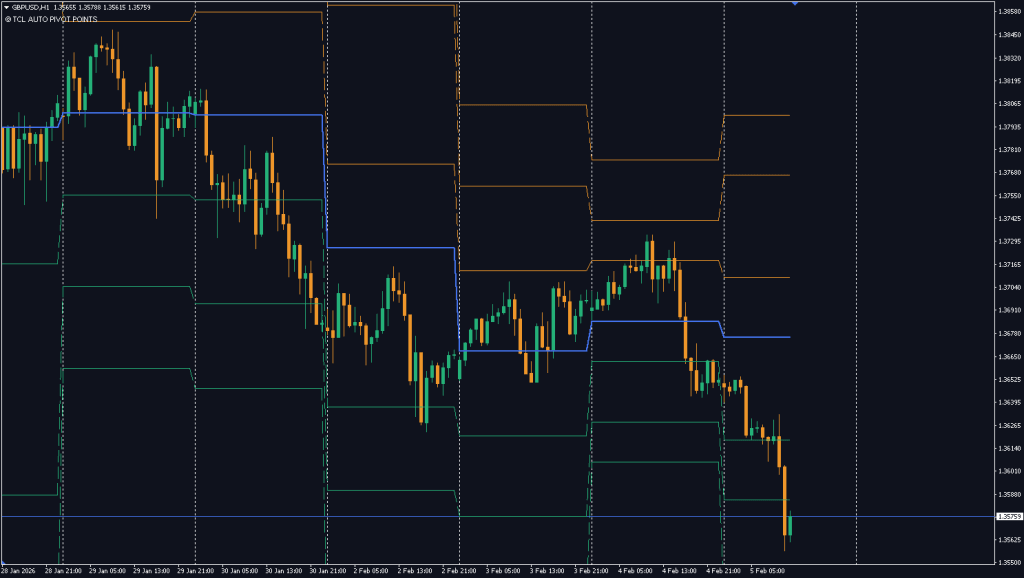
The standard floor-trader formula: PP = (High + Low + Close) / 3. Support and resistance levels project symmetrically from that pivot. Classic pivots are the most widely watched levels in the forex market, which makes them effective for ordinary day trading. A self-fulfilling-prophecy effect: price reacts because everyone is watching.
Best for: forex day trading on intraday charts.
Fibonacci Mode
This method projects the support and resistance levels using Fibonacci ratios (38.2% and 61.8%) applied to the previous period’s range. Because Fibonacci levels are themselves heavily watched, this mode tends to align with the retracement zones swing traders already mark.
Best for: swing trading and crypto, where Fibonacci confluence is common.
Woodie Mode
Woodie pivots give extra weight to the previous session’s closing price in the calculation. Weighting the close makes the levels more responsive to where momentum actually finished. Useful when a market is grinding sideways and the close carries the real information.
Best for: range-bound markets and scalping.
Camarilla Mode
Camarilla is the institutional favourite. It generates a tighter set of levels using a unique formula designed for fading breakouts and scalping ranges. The levels sit closer to price, so they fire mean-reversion signals more often. Institutional desks use Camarilla specifically to trade the reversion when price pushes past a level and fails.
Best for: mean-reversion trading and range scalping.
The Auto-Timeframe Logic
Here is the feature that makes this indicator genuinely smart. The pivot period you use should match your trading horizon. Daily pivots are meaningless on a monthly chart, and monthly pivots are useless for an M5 scalp. The indicator handles this for you:
| Your chart timeframe | Pivot period applied | Why |
|---|---|---|
| M1, M5, M15, M30, H1 | Daily pivots | Intraday trading. Daily levels are the most relevant S/R |
| H4 | Weekly pivots | Swing trading. Weekly levels define the broader structure |
| D1 | Monthly pivots | Position trading. Monthly levels for major market structure |
Switch from an M15 chart to an H4 chart and the indicator silently swaps daily pivots for weekly ones. You can override this with the Timeframe Mode parameter if you want manual control. The auto logic is correct for the vast majority of traders.
Core Features
- Four calculation methods. Classic, Fibonacci, Woodie, and Camarilla in one indicator
- Auto-timeframe detection. Automatically applies Daily, Weekly, or Monthly pivots to match the chart
- Institutional levels (R3 to S3). Extended resistance and support tiers beyond the primary levels
- Non-repainting. Levels are calculated from the closed previous period and lock for the full session
- Manual override. Force a specific pivot period when you need it
- Free, unlimited activations. Works on MT4 and MT5, no premium gate
- Lightweight. Minimal chart clutter, fast on any terminal
Settings and Customization
The indicator is deliberately simple. Two inputs do the work:
| Parameter | Default | What it controls |
|---|---|---|
| Calculation Method | MODE_CLASSIC | Chooses the pivot formula: Classic, Fibonacci, Woodie, or Camarilla |
| Timeframe Mode | TF_AUTO | Auto-detects pivot period by chart, or set a fixed period manually |
To force a specific pivot period regardless of chart timeframe, set Timeframe Mode to a manual option such as TF_MANUAL_DAILY. Useful if, for example, you want daily pivots visible on an H4 chart.
Recommended Settings by Trading Style
Forex day traders: Classic mode, auto-timeframe. On an H1 chart this gives you daily pivots, exactly what institutional floor traders watch. The pivot point acts as a magnet. R1/S1 are your primary targets. R2/S2 are extended targets for strongly trending days.
Swing traders: Fibonacci mode on H4 (auto-applies weekly pivots). The Fibonacci-projected levels tend to line up with the retracement zones you would already be drawing.
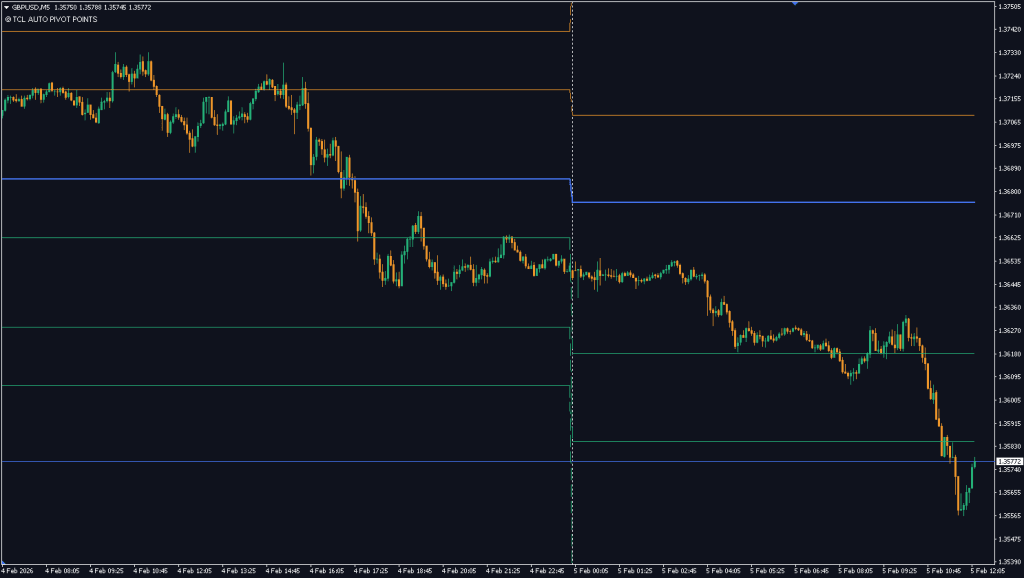
Range scalpers: Camarilla mode on M5 or M15. The tighter Camarilla levels give you frequent, well-defined fade entries when price overshoots and rejects.
Position traders: Classic or Fibonacci mode on D1 (auto-applies monthly pivots) to frame major structure.
How to Use the Auto Pivot Points Indicator
Three practical strategies.
Strategy 1: The Pivot Bias Trade (day trading)
The simplest, highest-value use.
- Apply the indicator in Classic mode on an H1 chart (daily pivots auto-apply).
- At the start of the trading day, note where price opens relative to the central pivot point (PP).
- Above PP = bullish bias for the session. Favour longs, look to buy pullbacks toward PP or S1.
- Below PP = bearish bias. Favour shorts, look to sell rallies toward PP or R1.
- Targets: R1/S1 are your primary objectives. R2/S2 are extended targets on strongly trending days.
- The PP itself often acts as a magnet. Price frequently returns to test it intraday.
Strategy 2: The Camarilla Range Fade (scalping)
For choppy, range-bound sessions.
- Switch to Camarilla mode on M5 or M15.
- When price pushes up into a resistance level (R3 area) and prints a rejection, look for a short back toward the pivot.
- When price drops into a support level (S3 area) and rejects, look for a long.
- Stop-loss goes just beyond the level you faded. First target is the central pivot.
- This works best when price is not trending. Confirm range conditions with a flat reading on a trend tool like the TCL Trend Radar.
Strategy 3: Pivot Confluence (highest-probability setups)
Pivots are strongest when they line up with other evidence.
- Mark the pivot levels with this indicator.
- Overlay a second reference. Anchored VWAP from the VWAP Super Bands indicator, or a supply/demand read from the Supply and Demand Oscillator.
- When a pivot level and an independent level sit at the same price, that zone is far more likely to hold.
- Trade only the pivot reactions that have confluence. Skip the rest. Fewer trades, higher quality.
Auto Pivot Points vs Manual Pivot Calculation
| Factor | Manual / basic pivot tools | TCL Auto Pivot Points |
|---|---|---|
| Calculation methods | Usually one (Classic) | Four: Classic, Fibonacci, Woodie, Camarilla |
| Timeframe matching | Manual. You must set the period | Automatic. Detects chart, applies correct period |
| Extended levels | Often R1/S1 only | Full R3 to S3 institutional ladder |
| Repainting | Varies | Non-repainting. Levels lock at session open |
| Setup effort | Recalculate or reconfigure constantly | Drag on chart, done |
| Cost | Varies | Free, unlimited activations |
The practical difference is consistency. A manual approach means you eventually stop updating the levels or use the wrong period on the wrong chart. Automatic, correct, non-repainting levels mean the pivots are always right, which is the whole point of using them.
Who Should Use This Indicator
New traders get the single most beginner-friendly bias rule in trading: above the pivot is bullish, below is bearish. It is a clean, objective framework for reading a session without needing to interpret anything subjective.
Day traders and scalpers get the institutional levels that genuinely move price, with the correct pivot period applied automatically and a choice of formula to match range or trend conditions.
Swing and position traders get weekly and monthly pivots: the higher-timeframe structure that frames where the bigger moves stall and turn.
It works on forex pairs, gold, indices, and crypto. Classic mode suits forex best. Fibonacci suits crypto and swing setups. Camarilla suits range scalping on any liquid instrument.
Auto Pivot Points
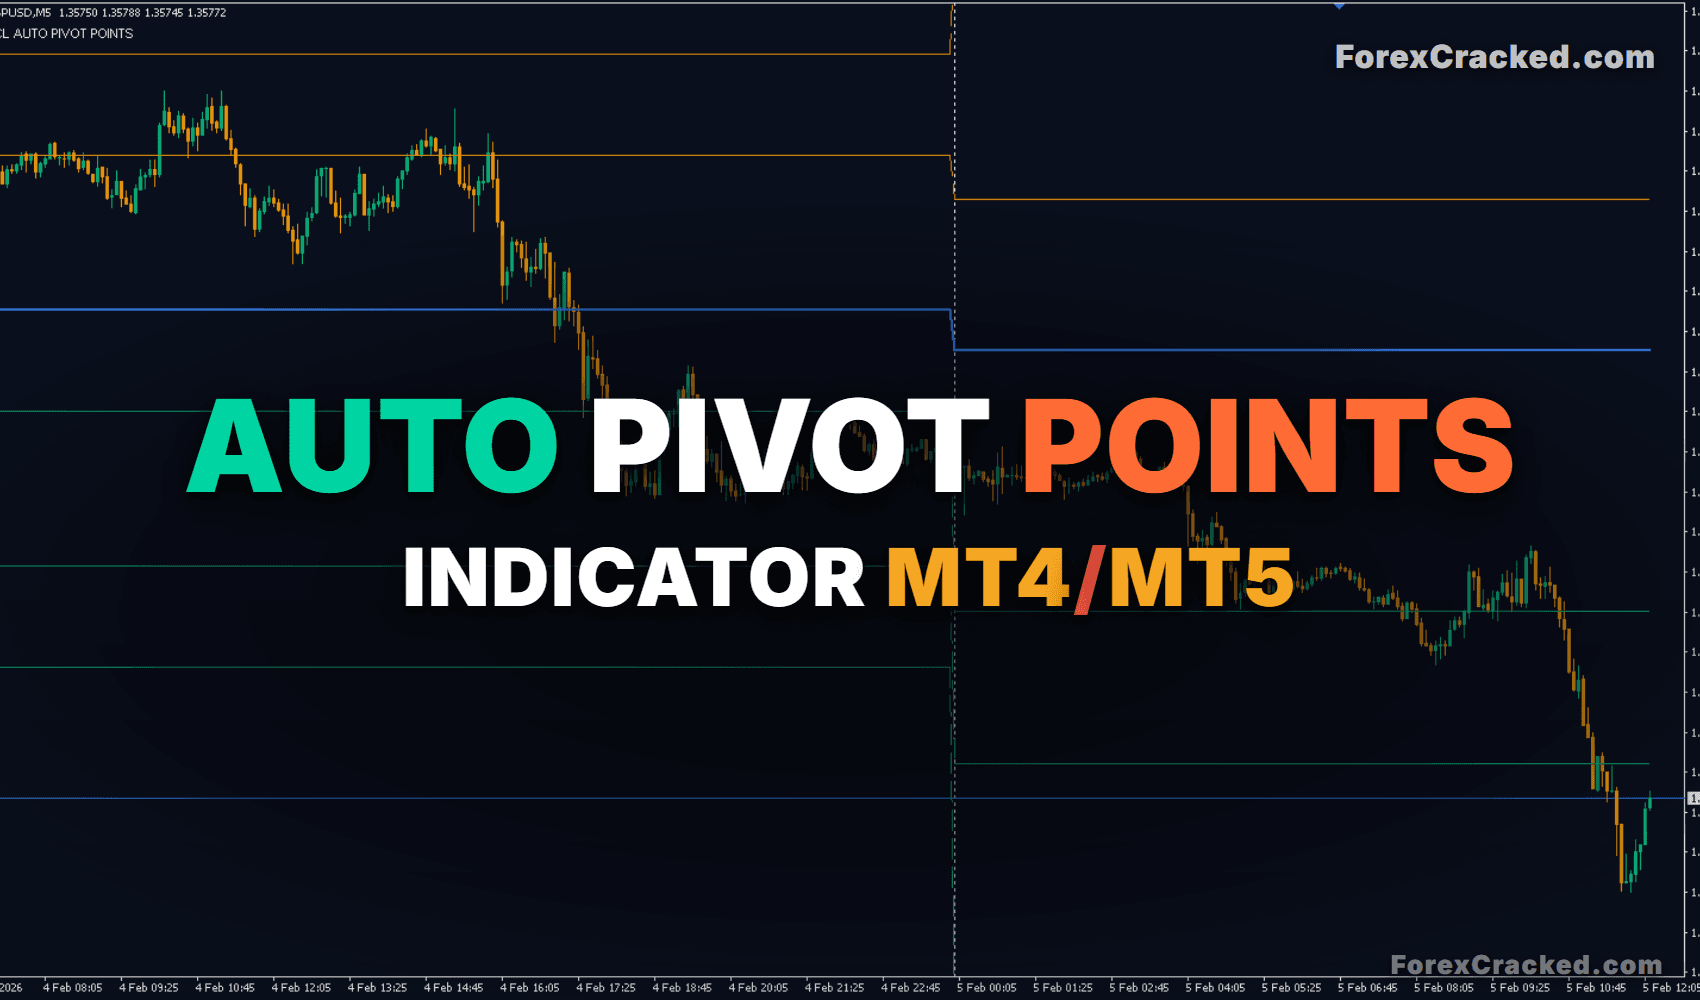
A free MT4 and MT5 pivot points indicator with four calculation methods (Classic, Fibonacci, Woodie, Camarilla), auto-timeframe detection, and the full institutional R3 to S3 level ladder.
Pros
- Four calculation methods (Classic, Fibonacci, Woodie, Camarilla) in one indicator
- Auto-timeframe detection applies the correct pivot period for every chart
- Full institutional R3 to S3 level ladder plotted automatically
- Strictly non-repainting. Levels lock at session open and never shift
- Manual override available for traders who want fixed control
- Simple two-input interface, fast on any terminal
- Free with unlimited activations on both MT4 and MT5
Cons
- Pivot points are a framework, not a signal. No entry triggers built in
- Best paired with a momentum or trend filter for actual entries
Summary
TCL Auto Pivot Points removes the manual work of calculating and re-applying pivot levels by automating four different formulas (Classic, Fibonacci, Woodie, and Camarilla) and detecting the correct pivot period for each chart timeframe. The full R3 to S3 institutional ladder is plotted on every chart, the levels are strictly non-repainting once a session opens, and the simple two-input interface makes it accessible to beginners while still flexible enough for professional desks. As a free indicator for both MT4 and MT5 with unlimited activations, it is one of the most complete pivot tools available for MetaTrader.
FAQ: Auto Pivot Points Indicator
Does the Auto Pivot Points indicator repaint?
No. Pivot levels are calculated from the previous period’s high, low, and close. Once the new day, week, or month begins, the levels are fixed for the entire duration and do not change. That makes them reliable for both live trading and backtesting.
Which pivot calculation method is best?
It depends on your style. Classic is best for forex day trading because those levels are the most widely watched. Fibonacci suits swing trading and crypto. Woodie suits range-bound markets. Camarilla is the institutional choice for fading breakouts and scalping ranges.
What is the difference between Classic and Camarilla pivots?
Classic pivots project support and resistance symmetrically from the (H+L+C)/3 pivot and are spaced wider apart, good for trend targets. Camarilla pivots use a different formula that places levels closer to price, making them better suited to mean-reversion and range-fade trading.
What timeframe should I use pivot points on?
Use daily pivots on intraday charts (M1 to H1), weekly pivots on H4, and monthly pivots on D1. The TCL Auto Pivot Points indicator applies the correct period automatically based on your chart, so you do not have to choose.
How do I trade with pivot points?
The simplest method: if price is above the central pivot (PP), trade with a bullish bias toward R1 and R2. If below, trade with a bearish bias toward S1 and S2. Pivot levels also act as reversal zones. Price often rejects R1/S1 and returns to the pivot.
Can I use this indicator on Gold, indices, or crypto?
Yes. It works on XAUUSD, indices, and crypto pairs as well as forex. Fibonacci mode is particularly popular for crypto. Classic mode is the standard for forex.
Is the Auto Pivot Points indicator really free?
Yes. It is free with unlimited activations on both MT4 and MT5. You only need a free Trade Code Labs account to download it.
Does it work on MT5?
Yes. The indicator is built for both MetaTrader 4 and MetaTrader 5 with the same four calculation methods and auto-timeframe logic on each.
Verdict: Is the Auto Pivot Points Indicator Worth Downloading?
Pivot points work because everyone watches them. But only if your levels are accurate and you are using the right period for your timeframe. The TCL Auto Pivot Points indicator guarantees both, automatically, with the bonus of four calculation methods so you can match the formula to the market.
It will not tell you when to enter. Pivots are a framework, not a signal. But as a free, non-repainting map of the levels that institutional traders genuinely act on, it is one of the more useful tools you can keep permanently on your charts. Pair it with a momentum or trend filter for entries, respect the bias rule, and it earns its place.
How to Download the Auto Pivot Points Indicator
- Click the free download link to open the TCL Auto Pivot Points page on Trade Code Labs.
- Create a free Trade Code Labs account if you do not already have one.
- Download the
.ex4(MT4) or MT5 file. - In MetaTrader: File → Open Data Folder → MQL4 (or MQL5) → Indicators, paste the file, and restart the platform.
- Drag the indicator onto a chart and choose your calculation method.
Browse the full library of free forex indicators for more MetaTrader tools, and pair this with the Advanced Super Trend indicator for trend direction or the Bollinger Bands Trader indicator for volatility context. Always size positions with a risk calculator before entering.
Disclaimer: Trading forex and CFDs carries significant risk. This indicator review is educational and not financial advice. Indicators describe probability, not certainty. Always test on a demo account first and use proper risk management. ForexCracked independently reviews Trade Code Labs’ free indicators with permission. The companies are not affiliated.


Discussion no comments yet
Is this still working?
Nothing here yet
No one has asked anything about Auto Pivot Points Indicator for MT4/MT5 Free Download & Revi yet. First question gets answered.