

Welcome to our weekly market analysis from forexcracked.com! It’s June 3rd, the first trading week of the month. Let’s dive into some charts and explore the market trends together.
This analysis article isn’t about telling you when to buy or sell. It’s about teaching you how to approach the market effectively. Every day, I follow the same routine before I start trading. In this article, I’ll briefly explain the technical aspects of what’s happening and what actions I take in these situations. Your goal is to understand what I do so you can follow the same process on your own.
Upcoming Events for This Week
These events include macroeconomic reports, economic indicators, and, generally, what’s happening in the world. Only the most important ones are considered here. You can check the forexfactory.com for all the events.
03/06/2024
The US ISM Manufacturing PMI Report is coming out this morning, but aside from that, there’s nothing major happening on Monday.
04/06/2024
CPI data for CHF and the GDP report for AUD are being released today, along with the US JOLTS Job Openings report. Other than that, there’s nothing else to worry about.
05/06/2024
The Bank of Canada is releasing its interest rates today, which is a highly volatile event for CAD pairs, and there will be a press conference. Additionally, the US is releasing the ISM Services PMI report. Other than that, there’s nothing else important.
06/06/2024
The EUR Monetary Policy statement is being released today, which is a highly volatile event for EUR pairs, and there will be a press conference. Additionally, the US is releasing its Unemployment Claims report.
07/06/2024
The US and Canada are releasing their Unemployment Rate reports today. This is a slightly volatile event for both the CAD and USD.
Forex
EURUSD:
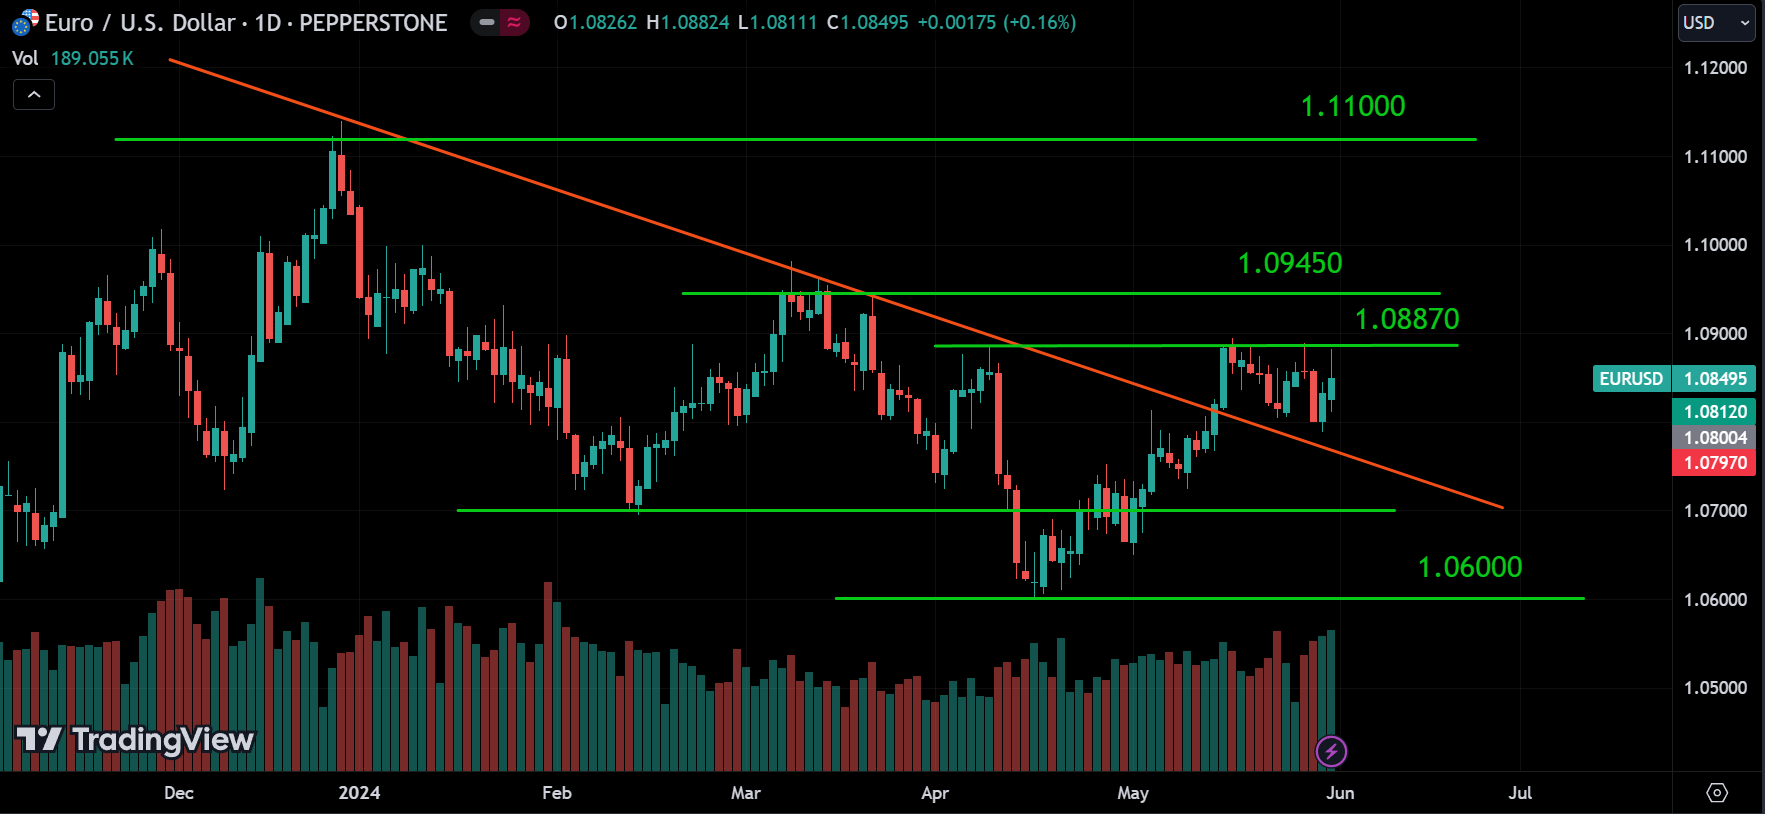
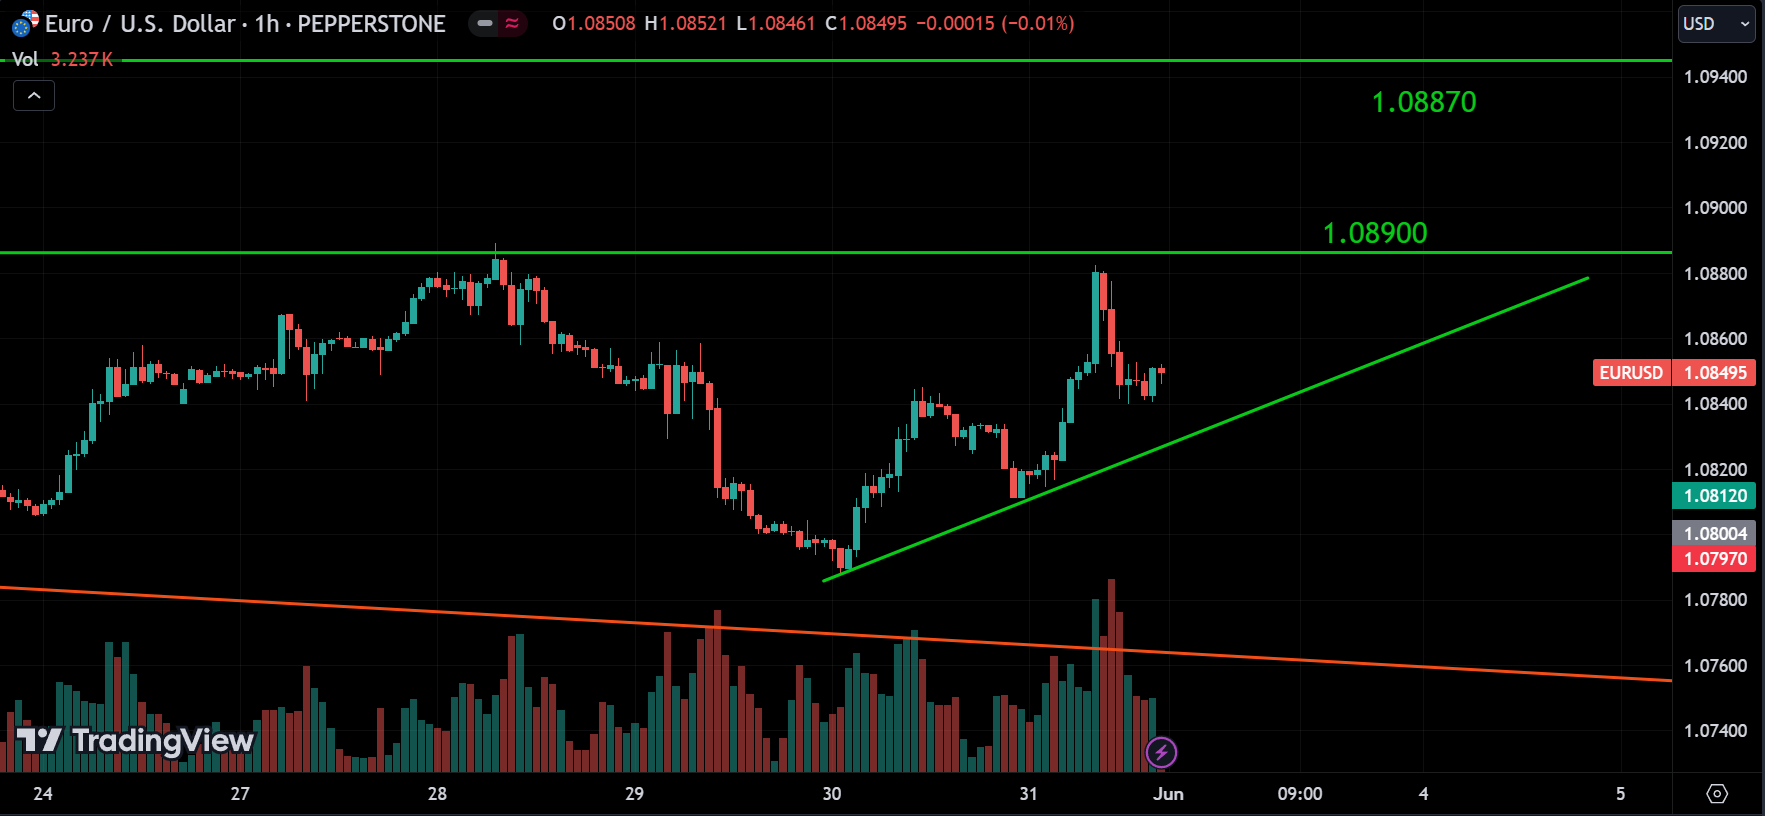
Looking at EURUSD, just like last week, it should be on an uptrend because the price is still above the red trend line. We can expect the price to continue going up. If you look at the 1-hour chart, 1.08900 seems to be a resistance level. The price has tried to break it three times and failed, but there is a medium-term uptrend happening.
If the price breaks above the resistance line at 1.08900, we can expect it to continue rising to the 1.09450 range. On the other hand, if the price retraces from the resistance level as it has before and breaks below the support, we can expect it to drop to the red line. If the red line is also broken, it could indicate a change in trend. However, the overall long-term trend for EURUSD is still bullish.
Keep in mind that the EUR Monetary Policy Report and the USD Unemployment reports are coming out this week. These are highly volatile events for this pair, and fundamentals are more powerful than technicals. So, be cautious when trading this pair.
USDJPY:
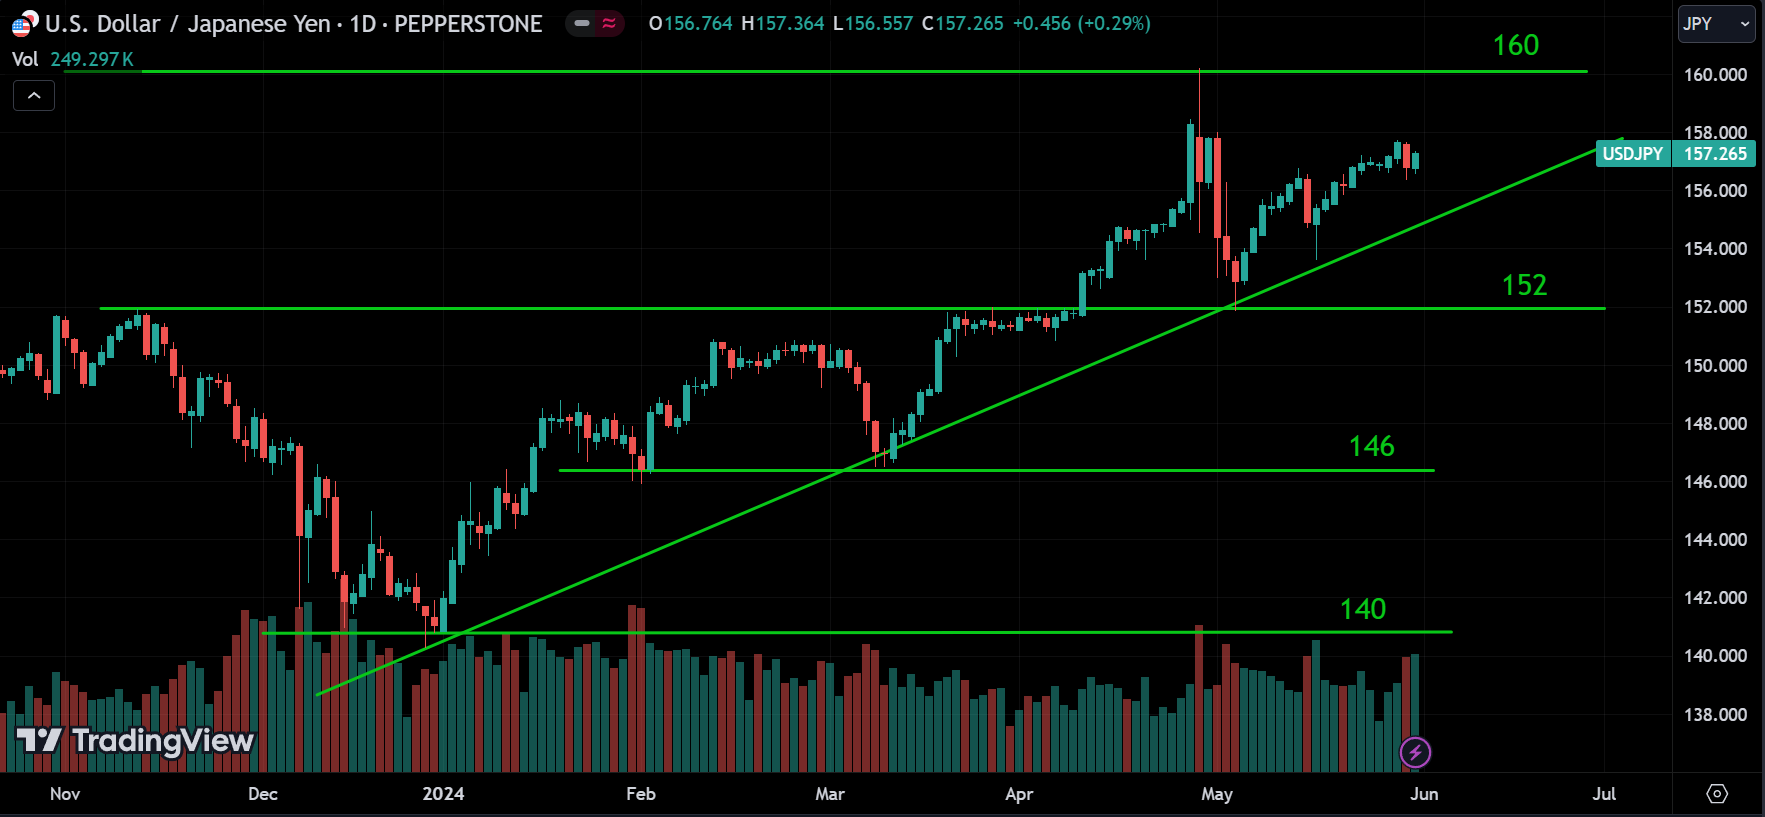
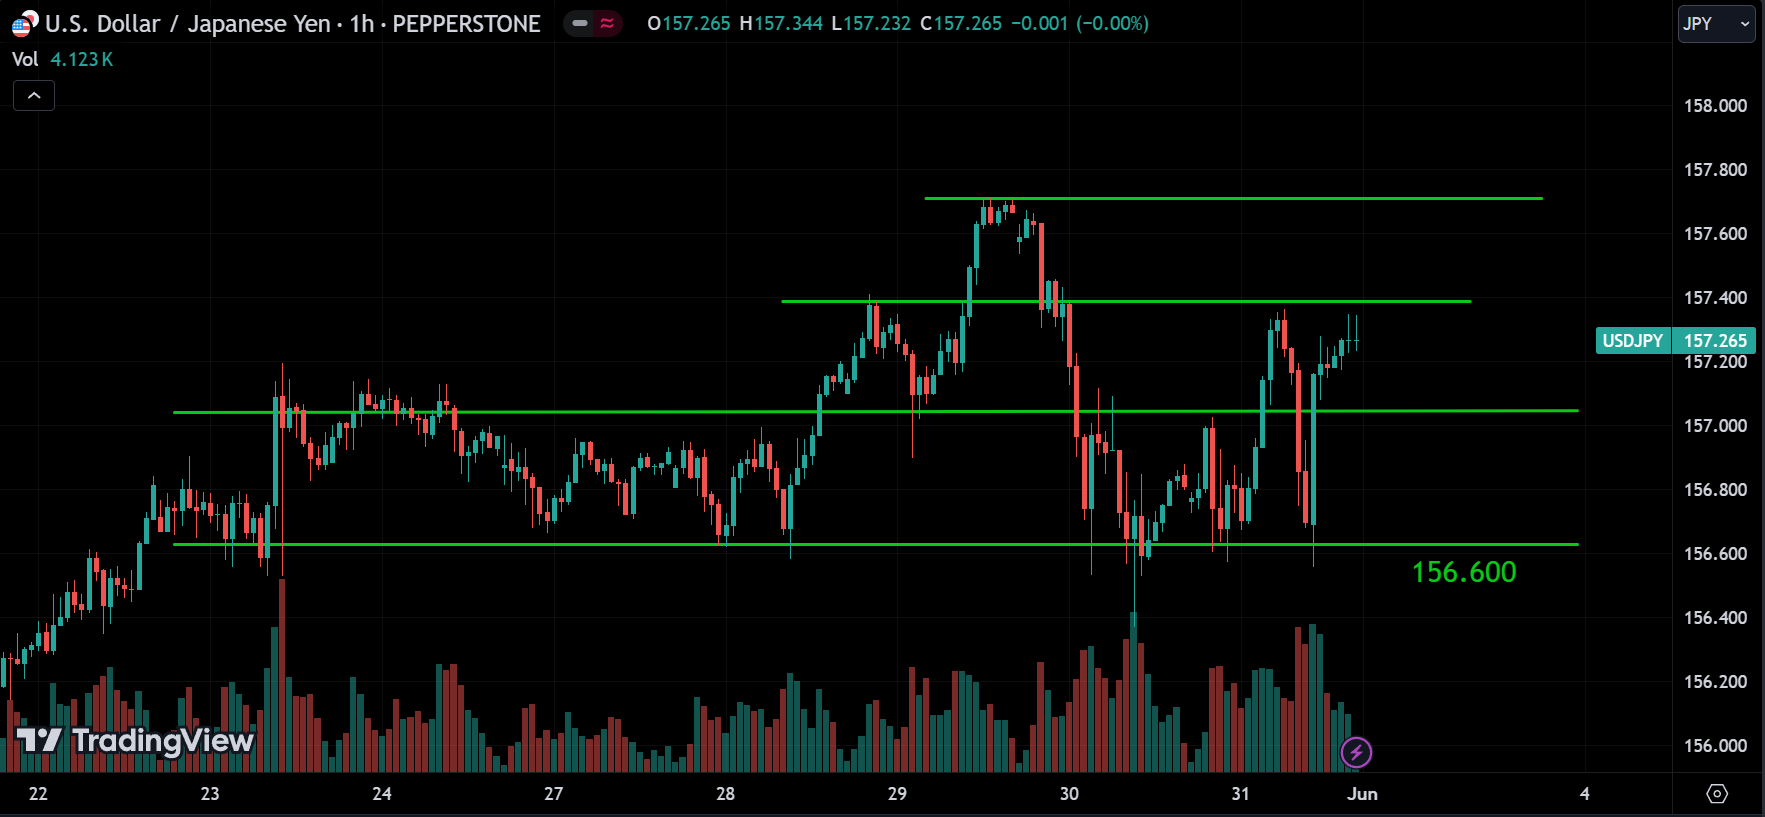
Looking at USDJPY, it is still on an uptrend and heading for the 160 level. On the 1-hour chart, there is strong support around the 156.600 level, and currently, the price is trading around 157.400, which acts as a minor resistance.
If the price breaks above the 157.400 range, we can expect it to rise to the 157.700 range, and if that level is also broken, it can climb even higher. On the other hand, if the price breaks below the 156.600 level, we can expect it to drop to the big trend line indicated on the daily chart.
So, wait for the breakout to determine the direction before entering a position.
GBPUSD:
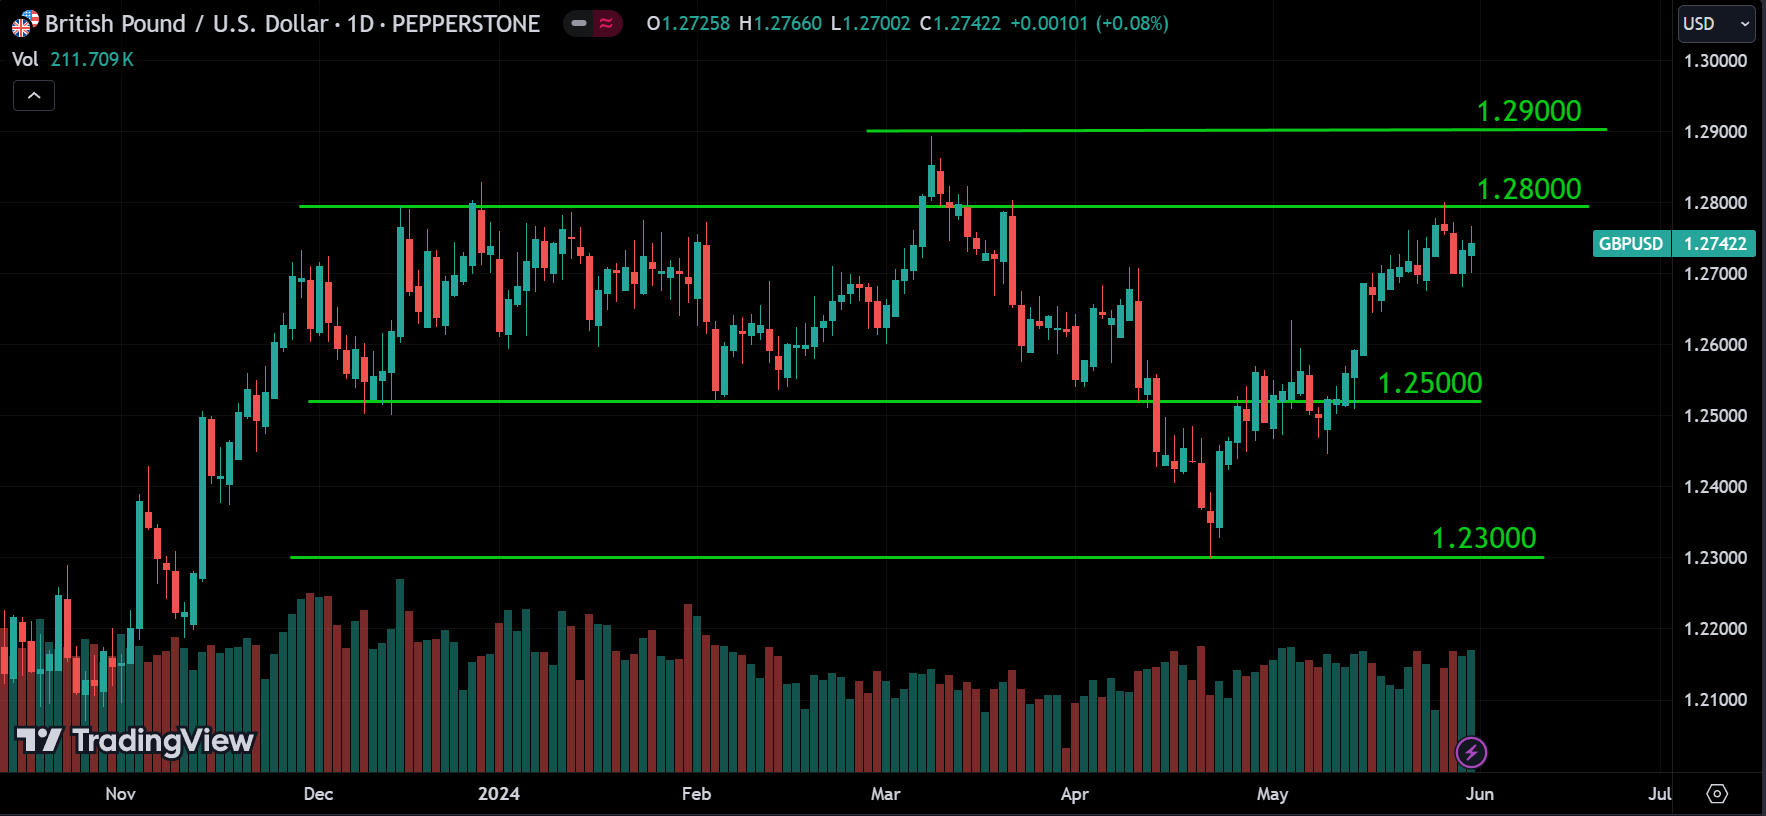
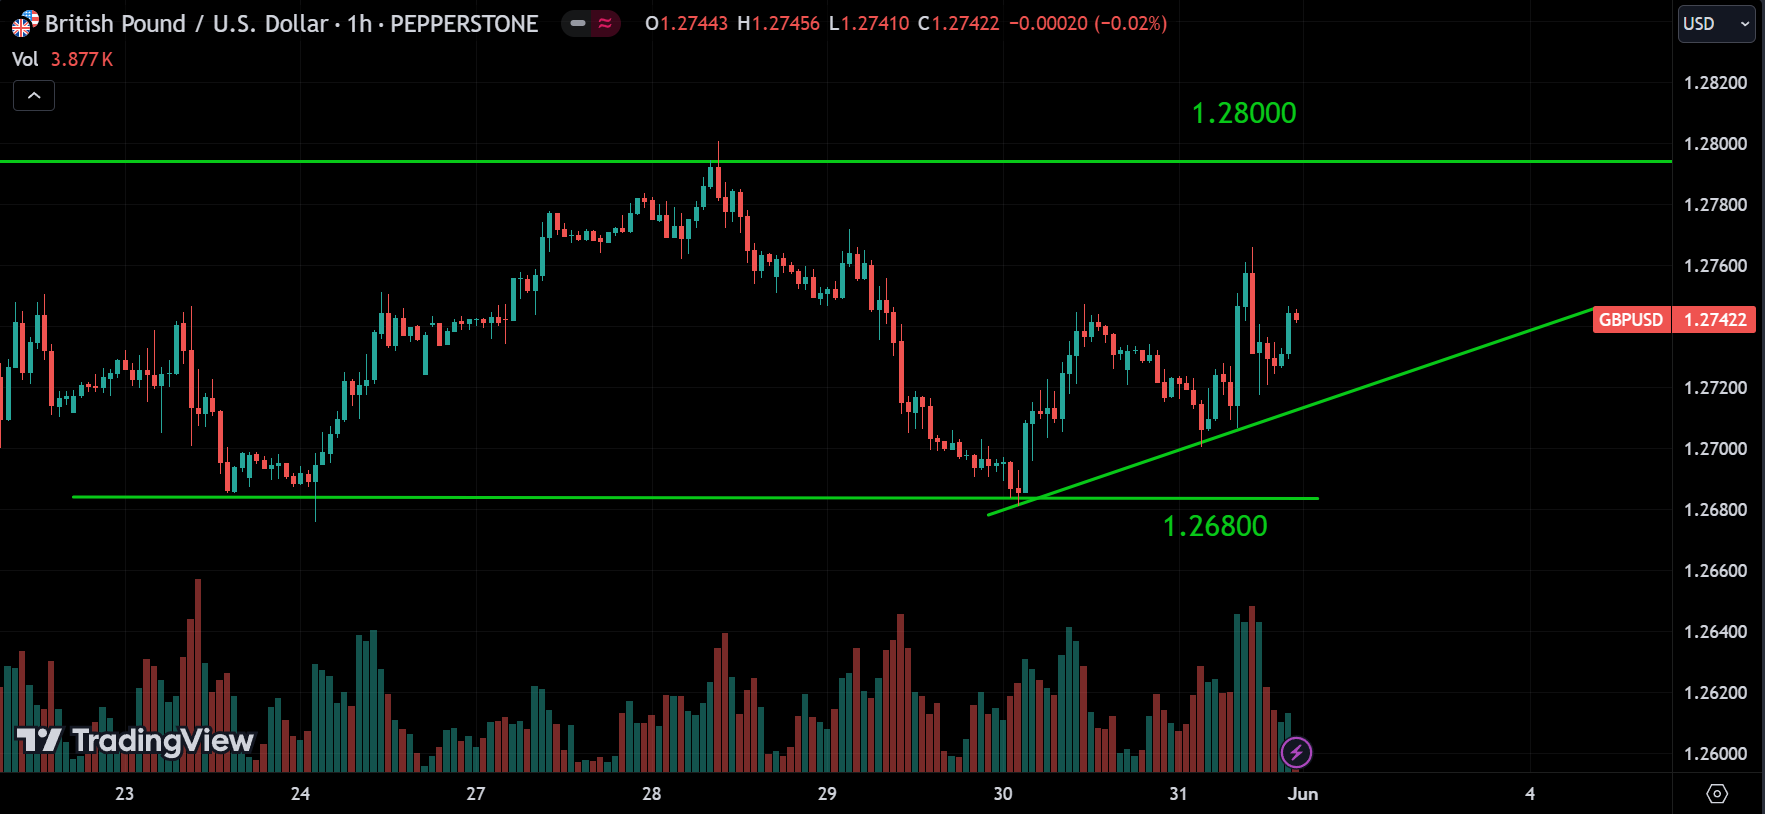
GBPUSD is currently trading around its resistance level of 1.28000 range, but the overall trend remains bullish. On the 1-hour chart, the 1.26800 level appears to be strong support for the price, initiating a medium-term uptrend after reaching this low.
We can anticipate several scenarios: the price may continue to rise towards the 1.28000 level again, retrace from that level, or break above it and continue upward. Conversely, if the price breaks below the support line on the 1-hour chart, it could drop to the major support around the 1.26800 level. If that level is also breached, further downward movement can be expected.
USDCHF:
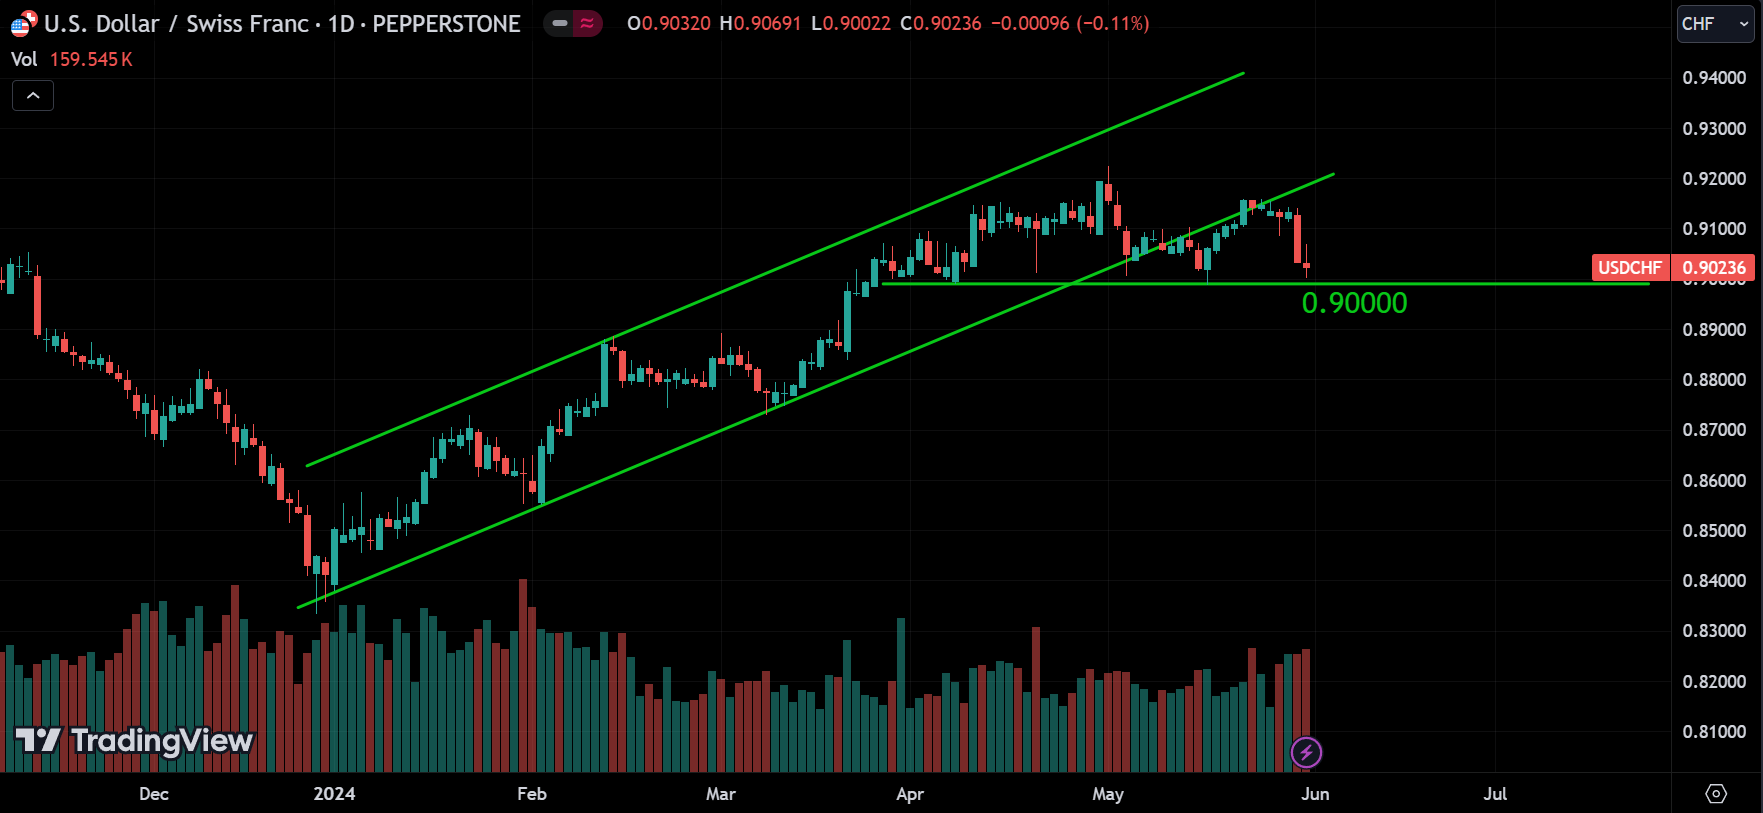
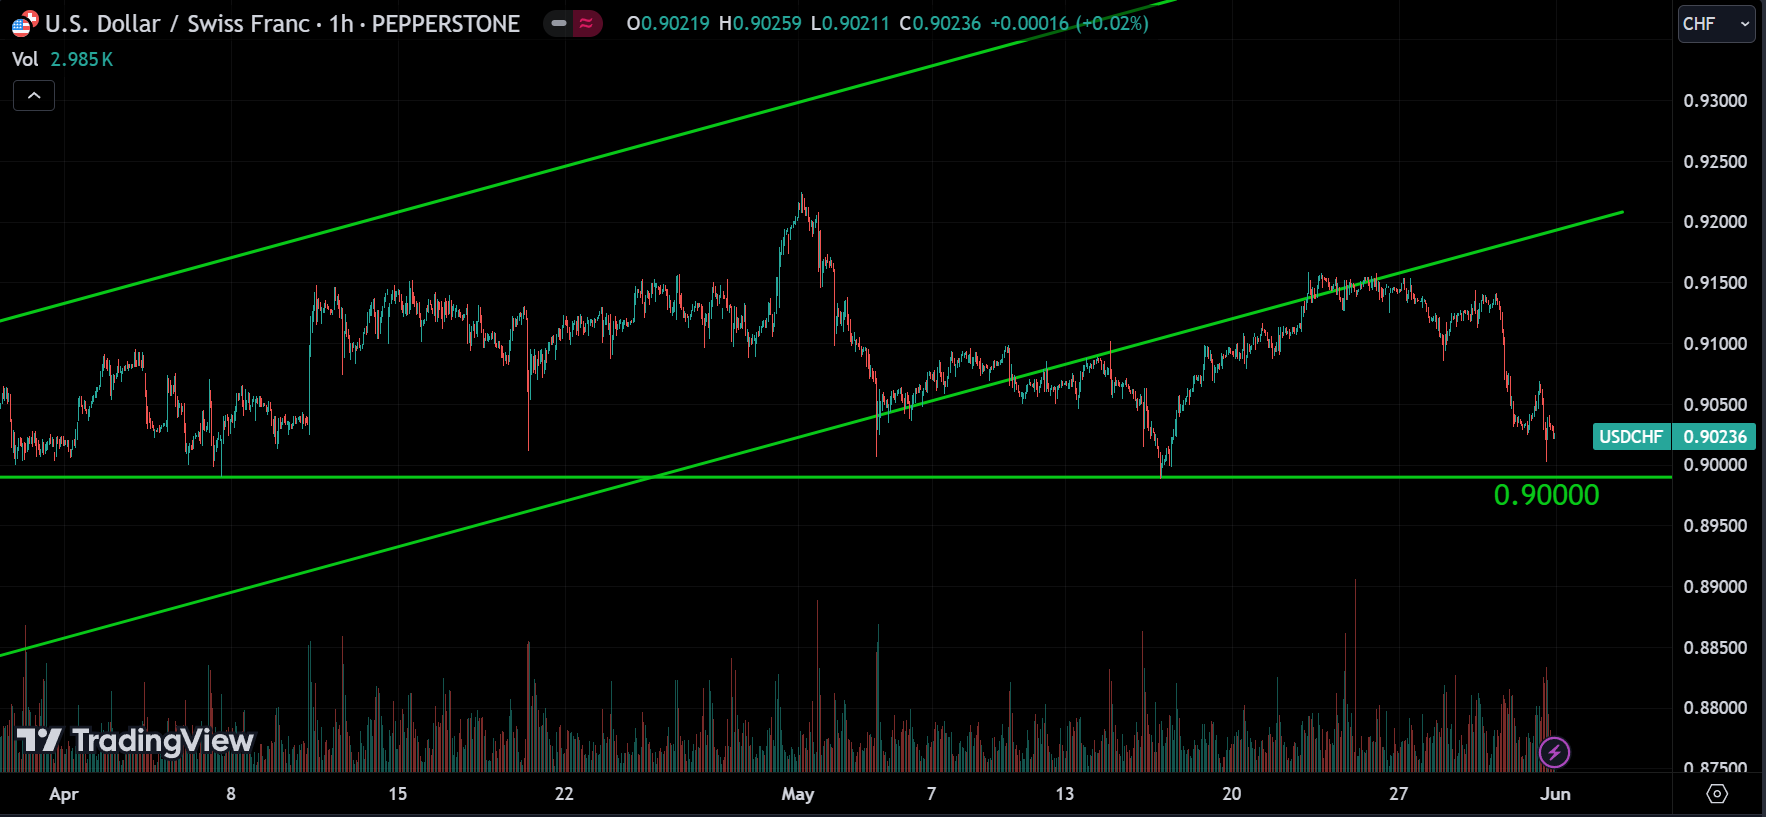
For USDCHF, it seems like it has started to consolidate after the long upward trend, meaning it’s more like moving sideways. The price is trading around the 0.90000 level, which appears to be a good support.
Looking at the 1-hour chart, we can clearly see that the uptrend has ended as the price broke the lower line of the channel and is now trading below it, acting as new resistance.
Now, we can expect two possibilities: the price breaking below the 0.90000 level and continuing to drop or the price retracing from that level. So, it’s best to wait for the breakout before making any decisions.
Keep in mind that CPI data for CHF will be released on Tuesday. Which is a volatile event for this pair.
USDCAD:
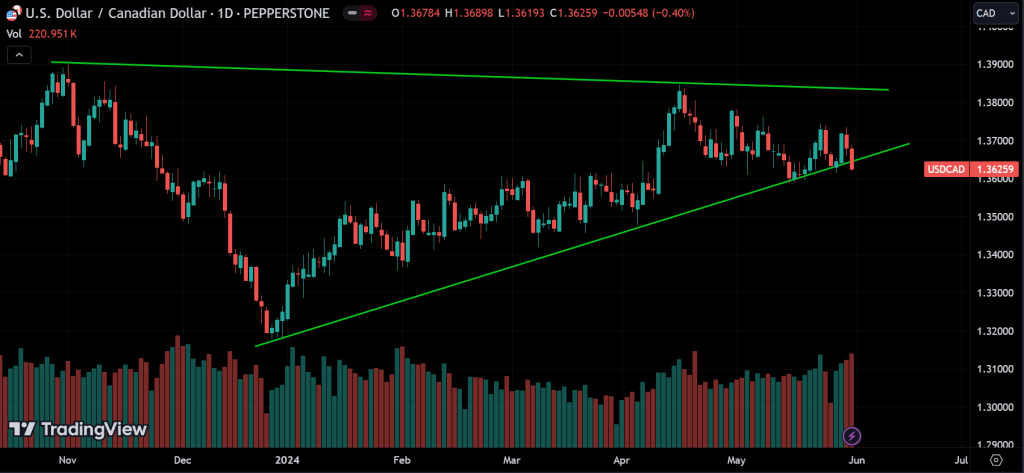
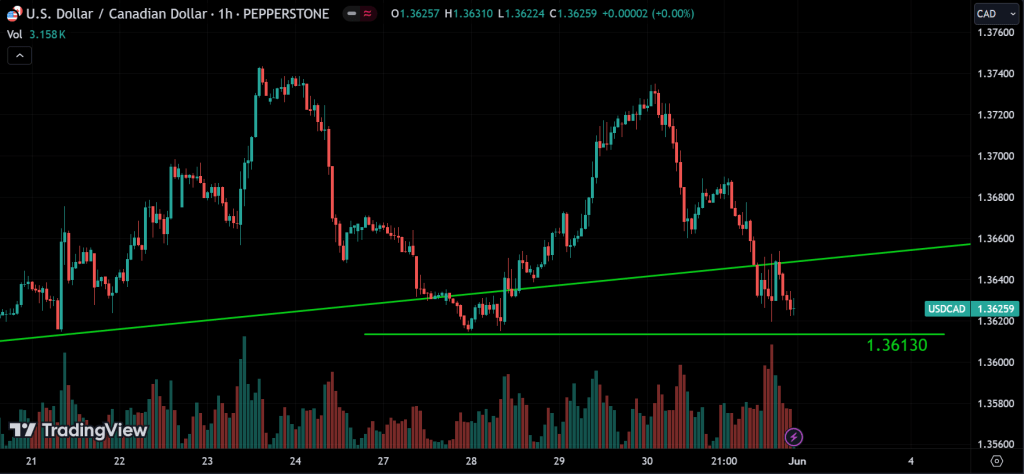
USDCAD appears to be in an uptrend, but it’s currently trading near the lower trend line, and the price is slightly below it. On the 1-hour chart, you can see that the 1.36130 level is acting as support for the price, as it found support when it previously broke the line.
So, we can anticipate that if the price breaks below the 1.36130 level, we can expect it to drop even further, indicating a potential new trend. Alternatively, the price could bounce back from this level to continue its upward movement. Therefore, waiting for any reversal or breakout signals before entering a position is wise.
Also, remember that the monetary policy statement for CAD is releasing on Wednesday, which is a highly volatile event for this pair.
AUDUSD:
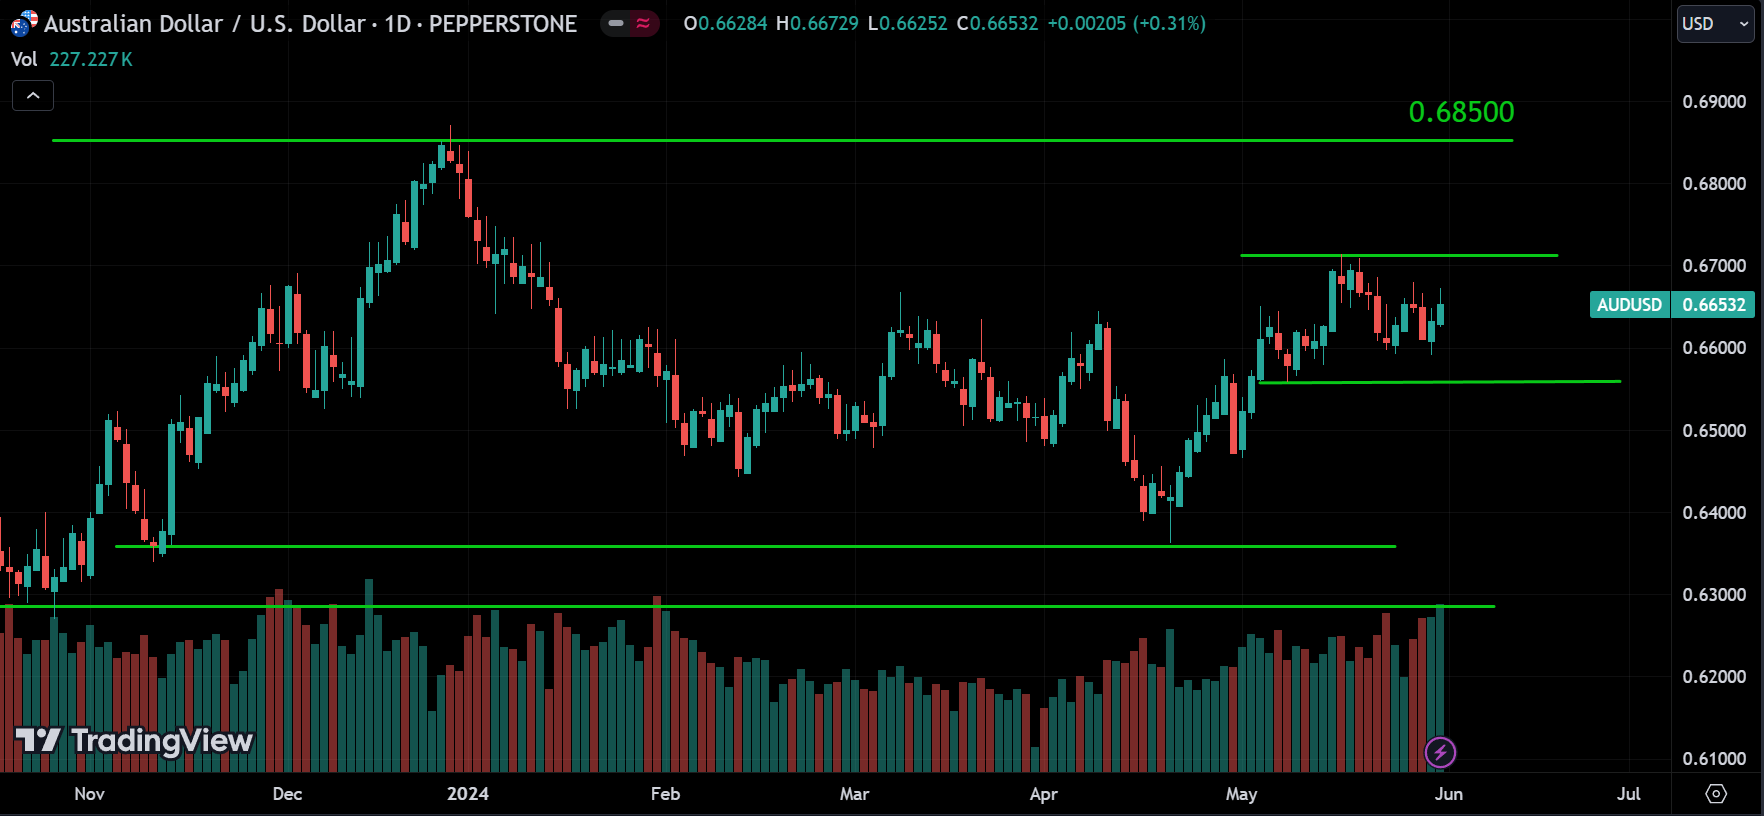
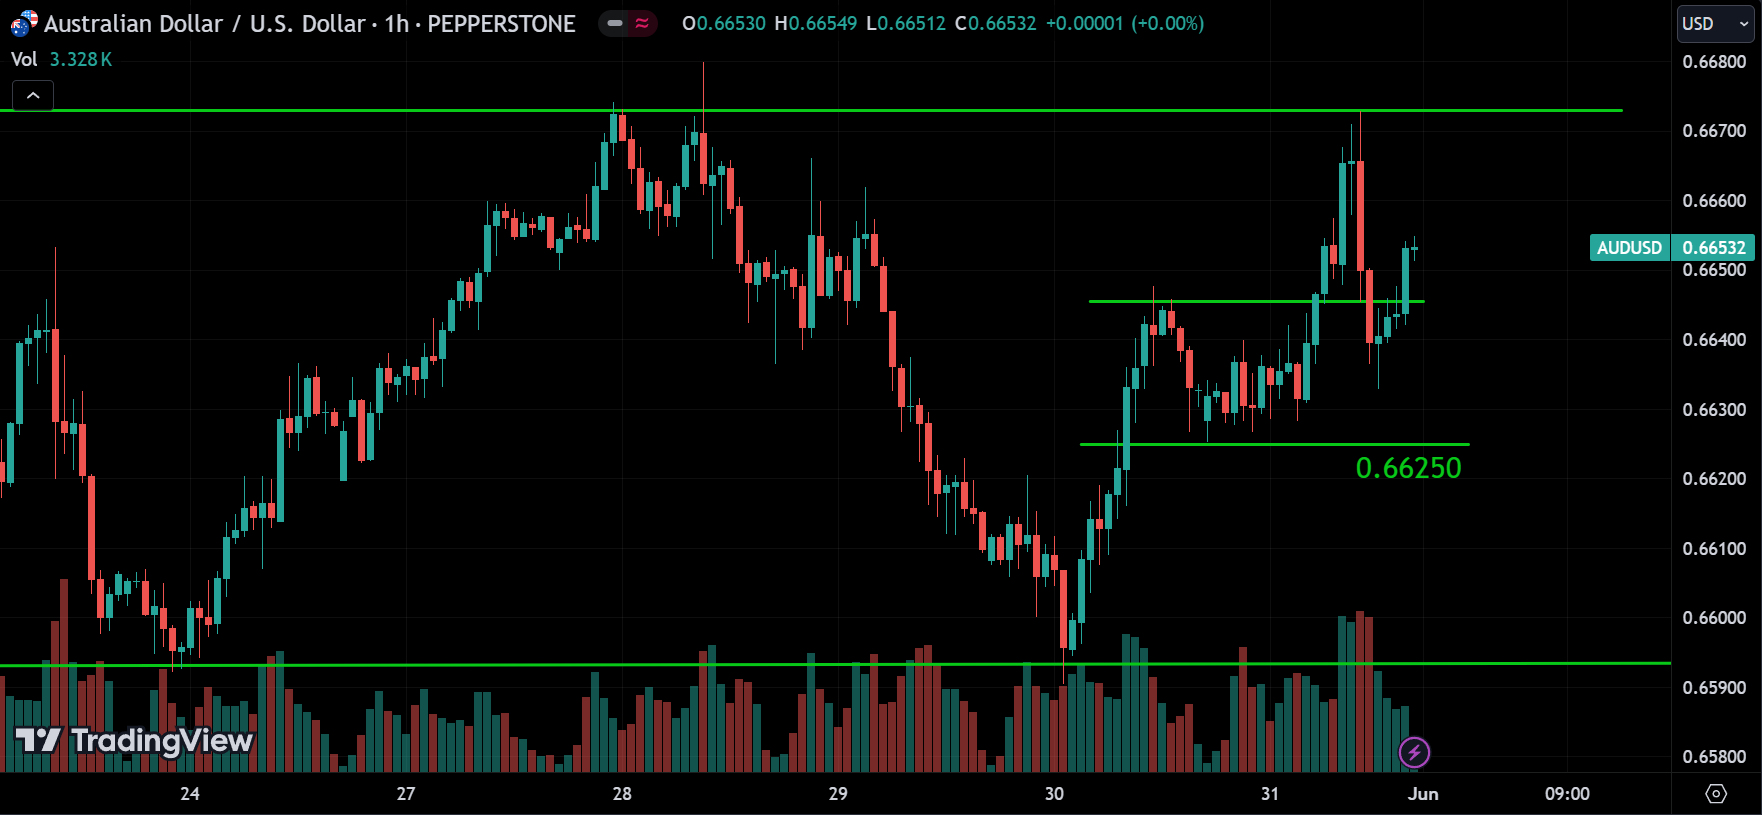
Looking at the daily chart, AUDUSD is now in a consolidation phase after the upward movement. On the 1-hour chart, it’s evident that it’s trading within the support and resistance levels of 0.66000 and 0.66700, with additional support at 0.66250. The price reached the resistance level but failed to break it, leading to a correction before starting to rise again.
So, we can anticipate that if the price breaks above the resistance level of 0.66700, we can expect it to rise to the 0.68500 level, possibly with corrections along the way. However, if the price fails to break the resistance and falls back below the support of 0.66250, then we can expect it to drop further, possibly to the 0.66000 range.
Also, keep in mind that on Tuesday, the GDP report for AUD is coming out, which is a highly volatile news event for this pair.
NZDUSD:
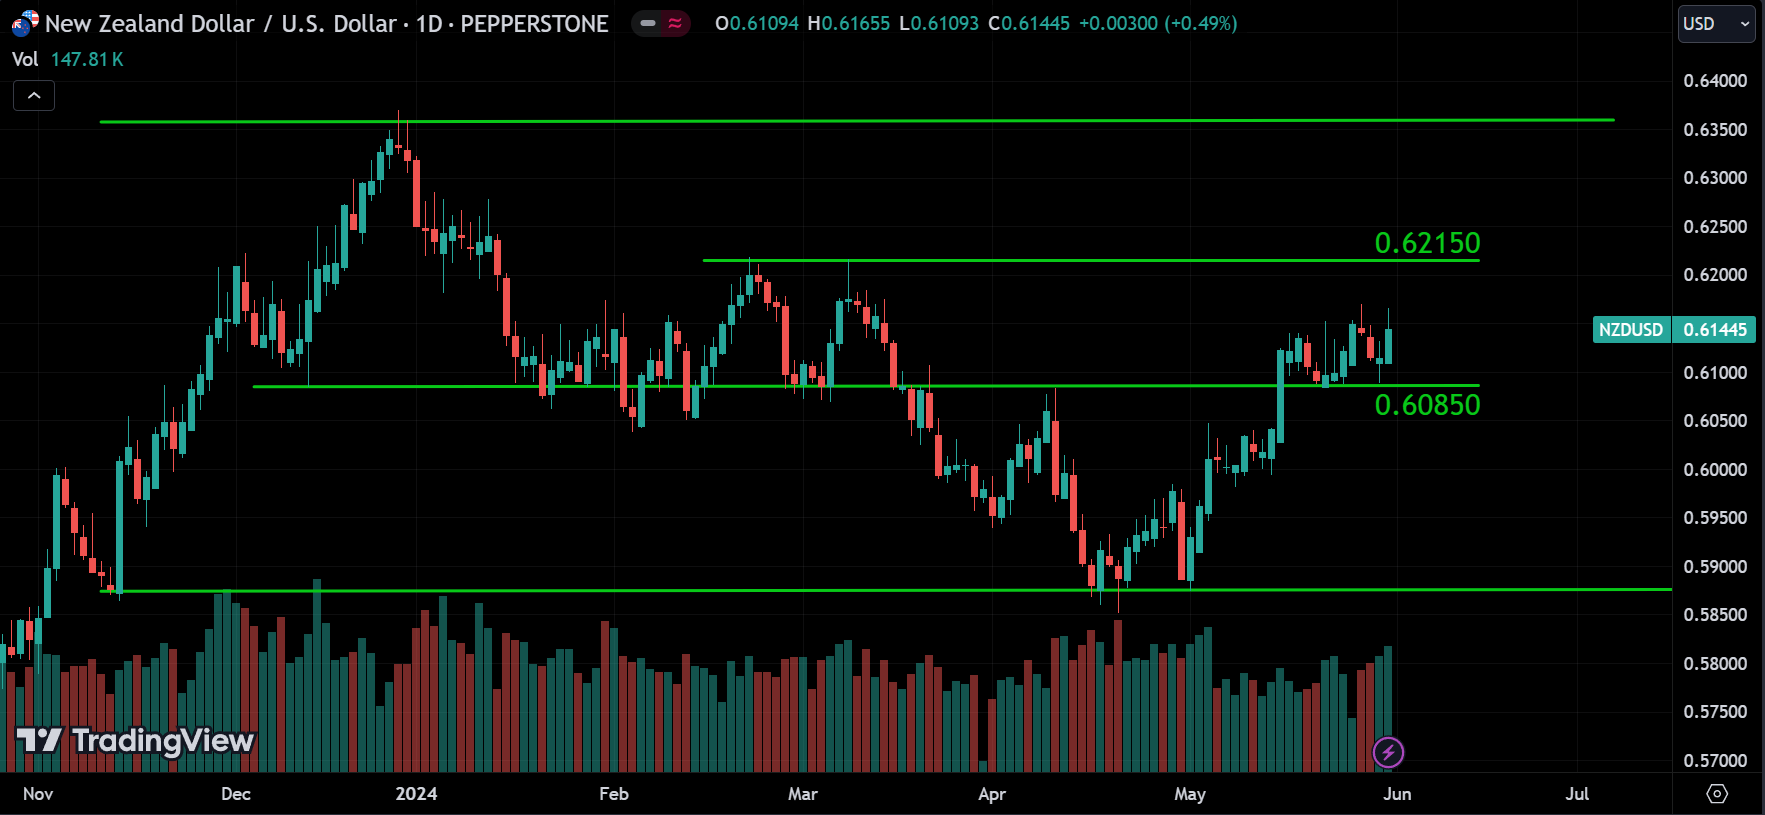
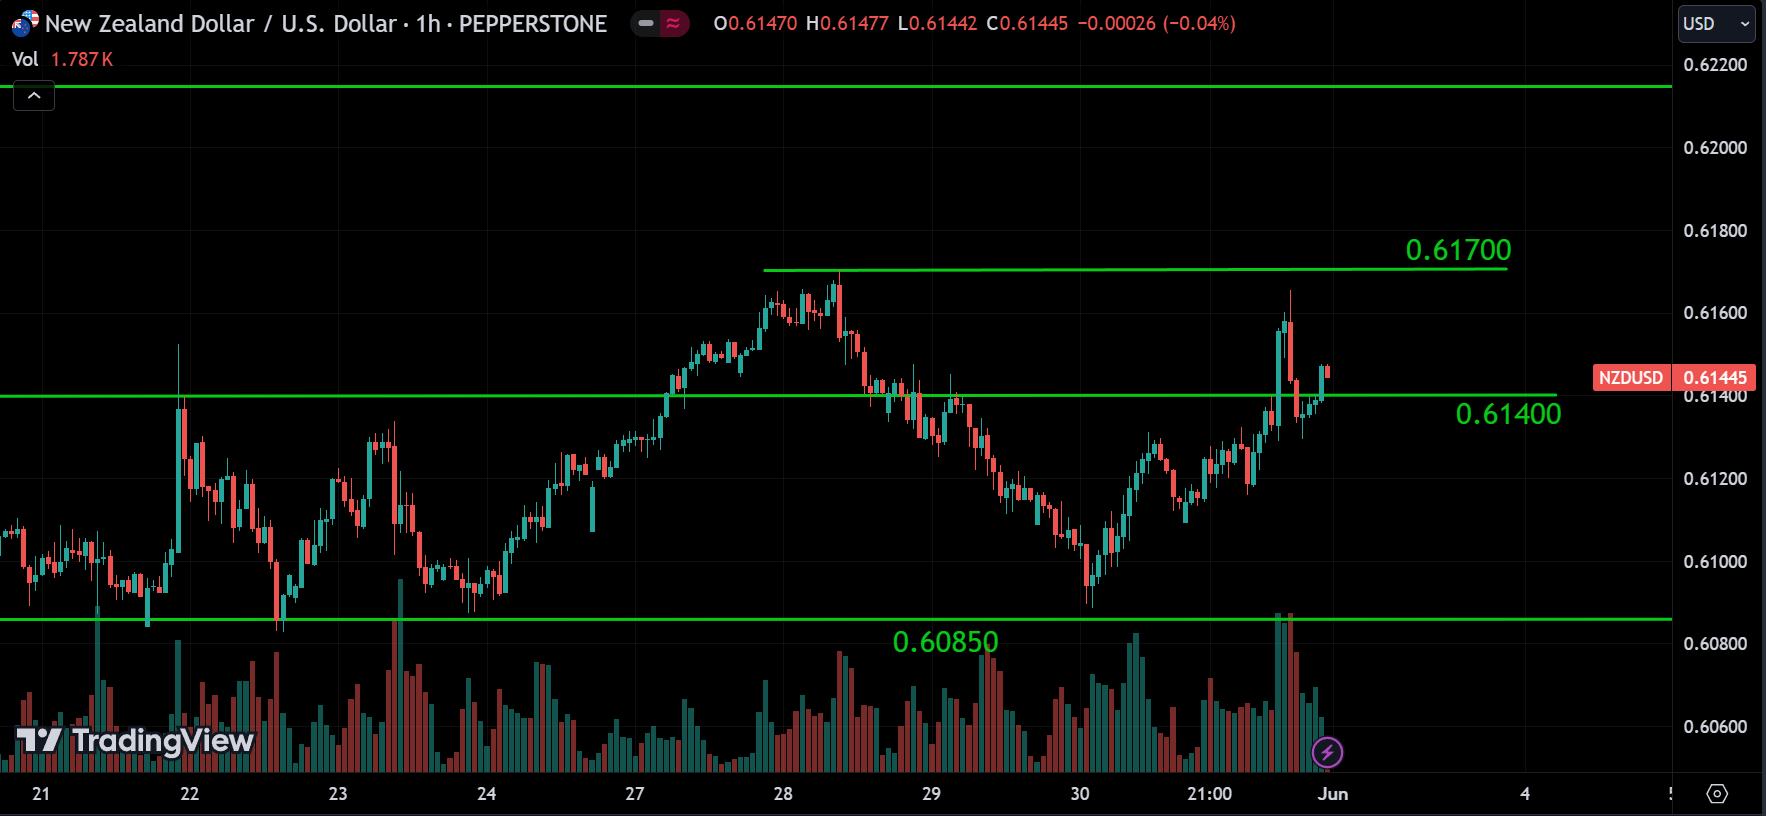
Observing NZDUSD, it’s also in an uptrend, and after surpassing the resistance level of 0.60850, it’s trading above that and aiming for the 0.62150 level. On the 1-hour chart, you can notice that 0.61400 somewhat supports the price, while 0.61700 stands as the strongest resistance.
We can anticipate that if the price breaks above the 0.61700 resistance line, then it’s likely to continue its upward trajectory. Conversely, if the price breaks below the support level of 0.60850, there might be a shift in trends.
Commodities
GOLD:
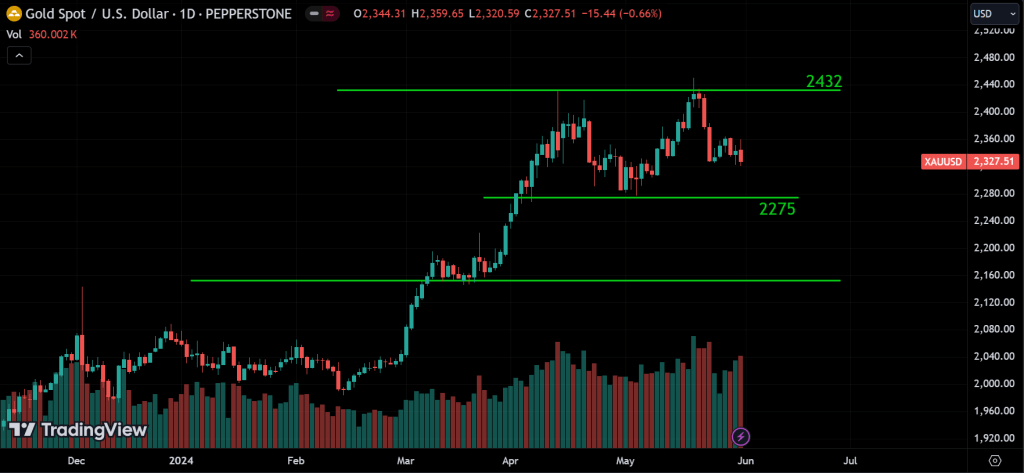
Looking at gold, after reaching a high of around 2432, it retraced back. 2275 acts as the strongest support for the price. So, we can expect that the price could bounce back from the 2275 level to resume its upward trend, or it could break below 2275 and decline further to the 2160 level. On the other hand, if the price returns to 2432 and breaks that level, we can expect it to continue its upward movement.
SILVER:
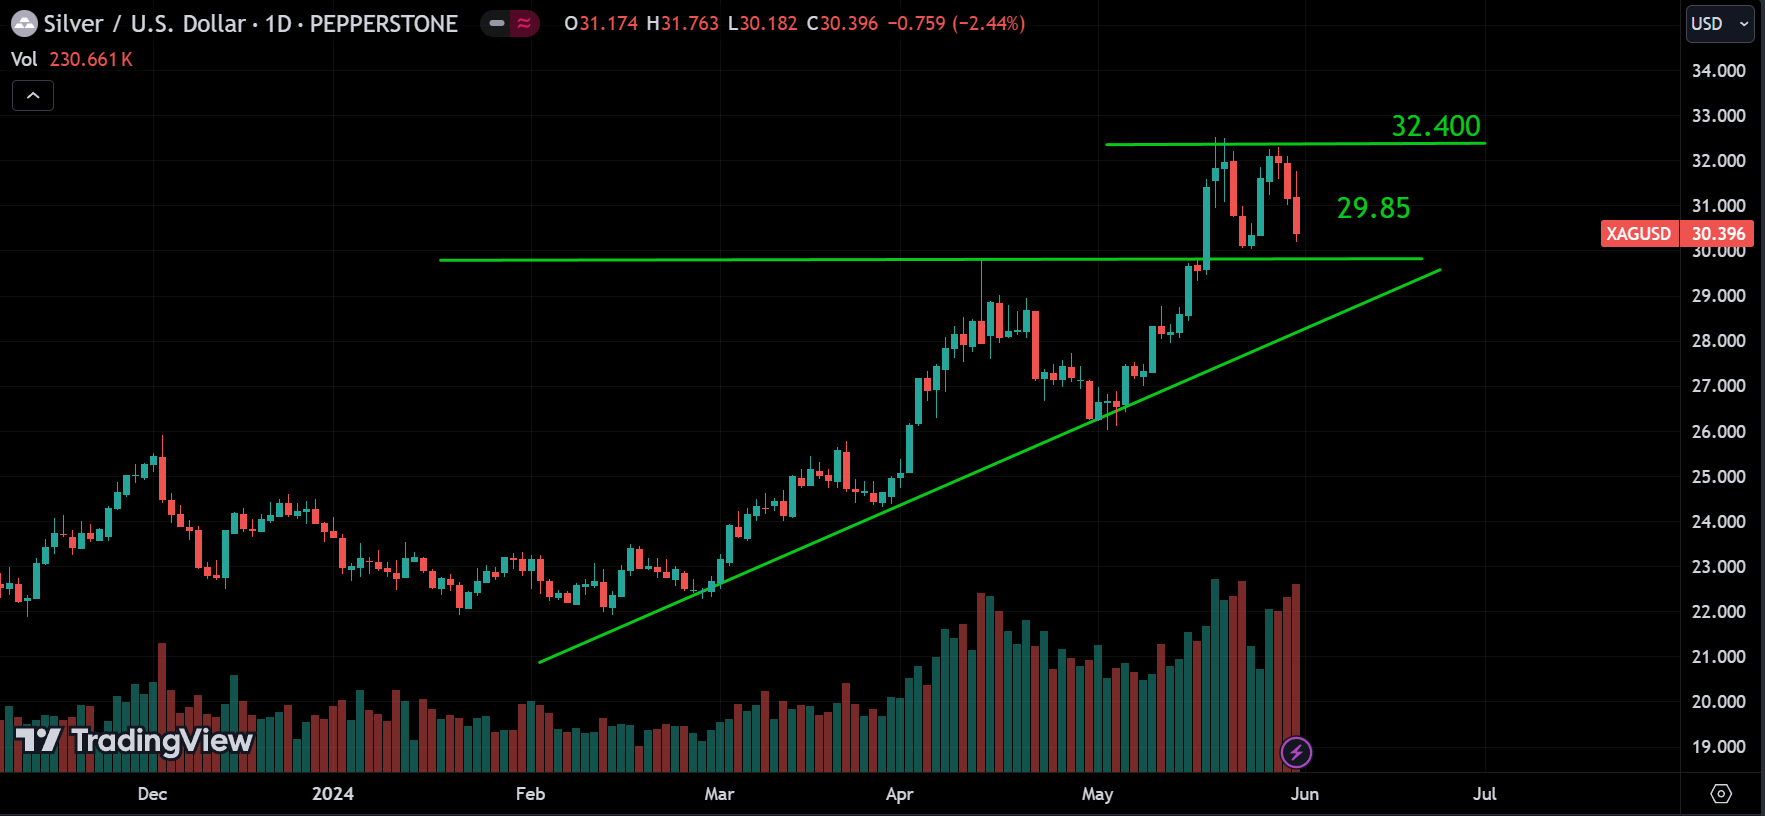
Regarding silver, 29.85 and 32.400 appear to be strong support and resistance levels for the price. What we can anticipate is that if the price breaks above the resistance level of 32.400, it could continue to rise. Conversely, if the price breaks below the support of 29.85, then we can expect it to drop further, possibly reaching at least the lower slope trend line.
CRUDE OIL:
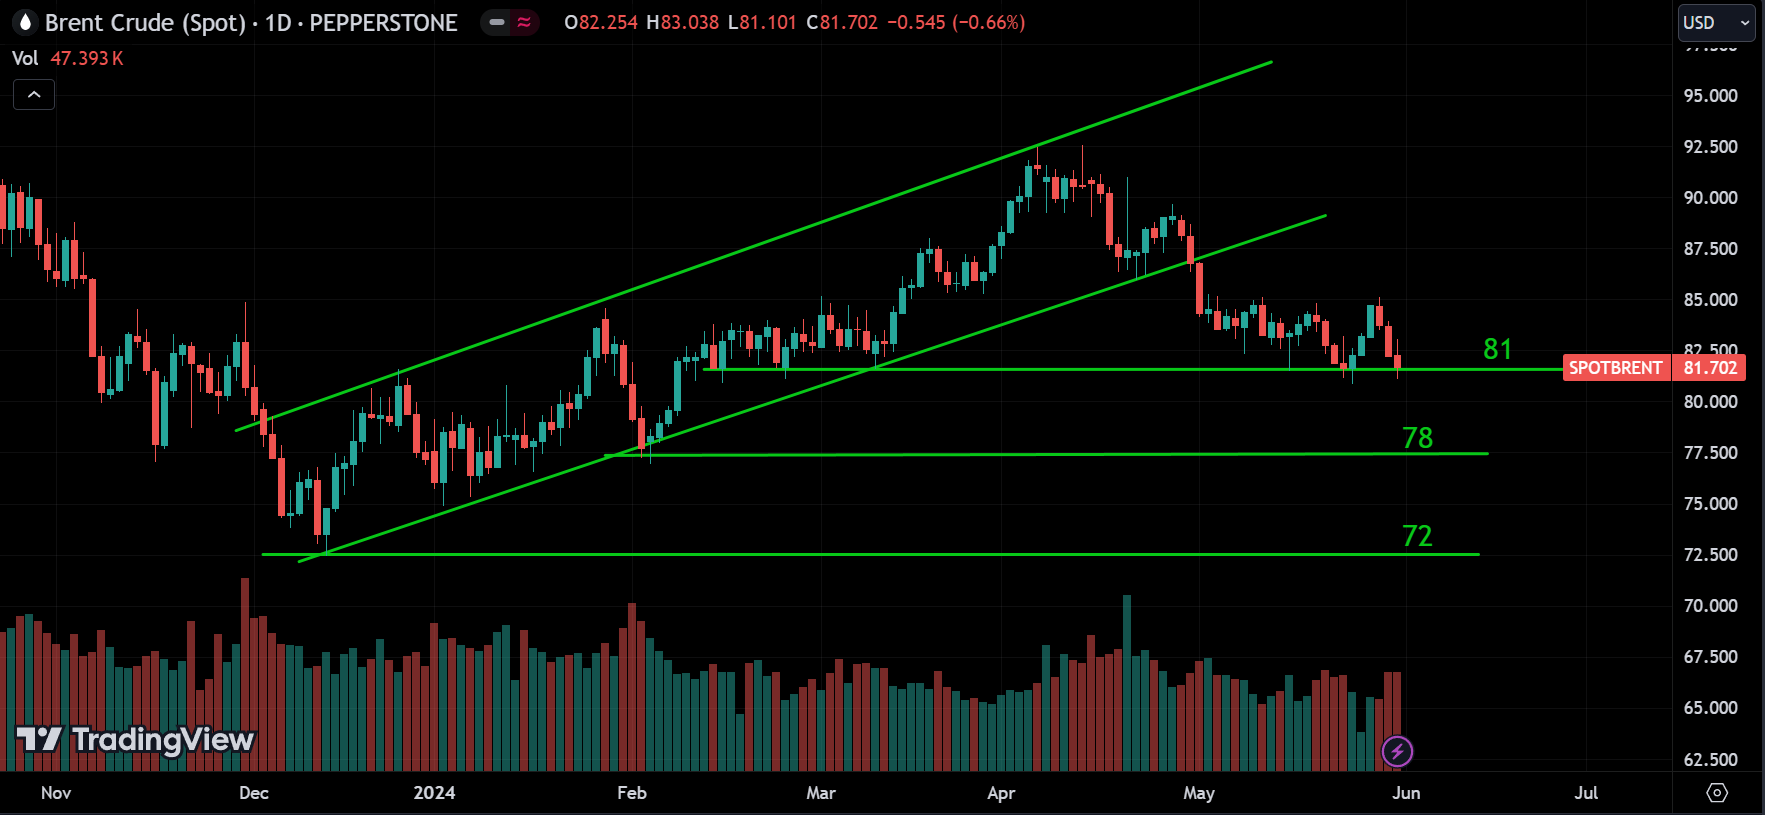
Like last week, oil is trading around its support level of 81. The price attempted to break this level but failed, and now it’s trying again. We can anticipate that if the price breaks below the 81 level, we can expect it to drop to 78, and if 78 is also broken, then we can expect it to drop to 72. However, on the other hand, the price could bounce back from the 81 level and start rising again. So, waiting for reversal or breakout signals is best before taking any positions.
Cryptocurrency
BTC:
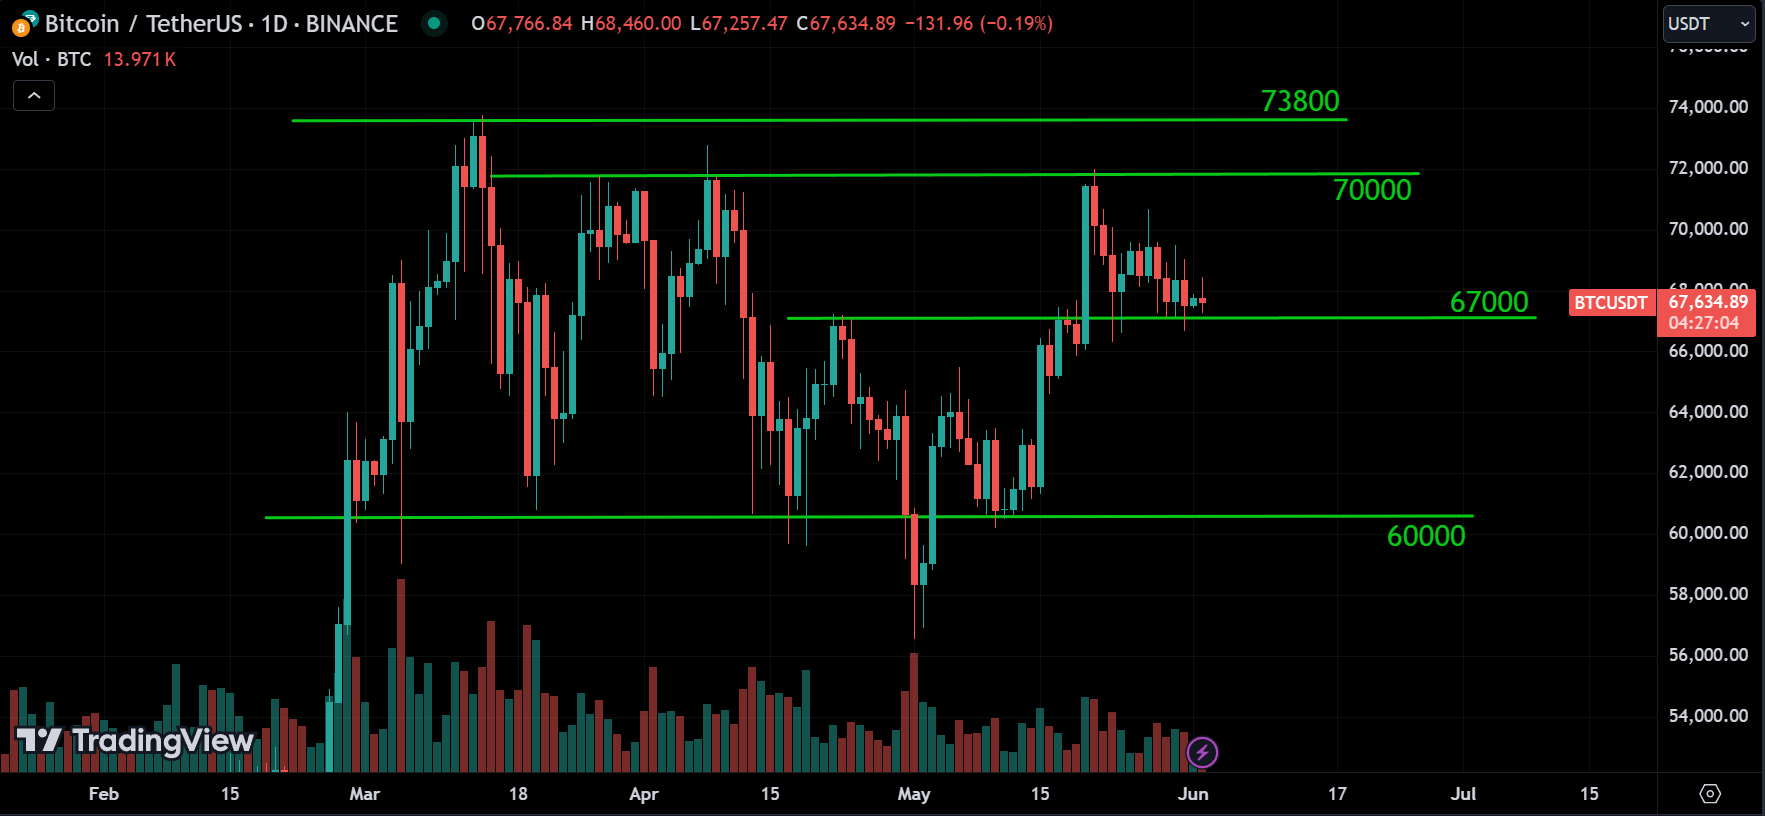
Regarding BTC, much like last week, it’s trading within the range of 70k and 67k. The same pattern repeats itself. It should go up since it’s overall on an uptrend, but currently, it’s stuck in a sideways momentum since March. It’s bound to make a move in one direction eventually. All we can do is wait.
Considering this situation, we can expect that the price needs to break either the 70k resistance or the 67k support. Currently, it’s trading near the support. So, if the price breaks the support, it could drop to the 60k range. On the other hand, if the price breaks above the resistance, it could reach its all-time high level and even set new highs.
ETH:
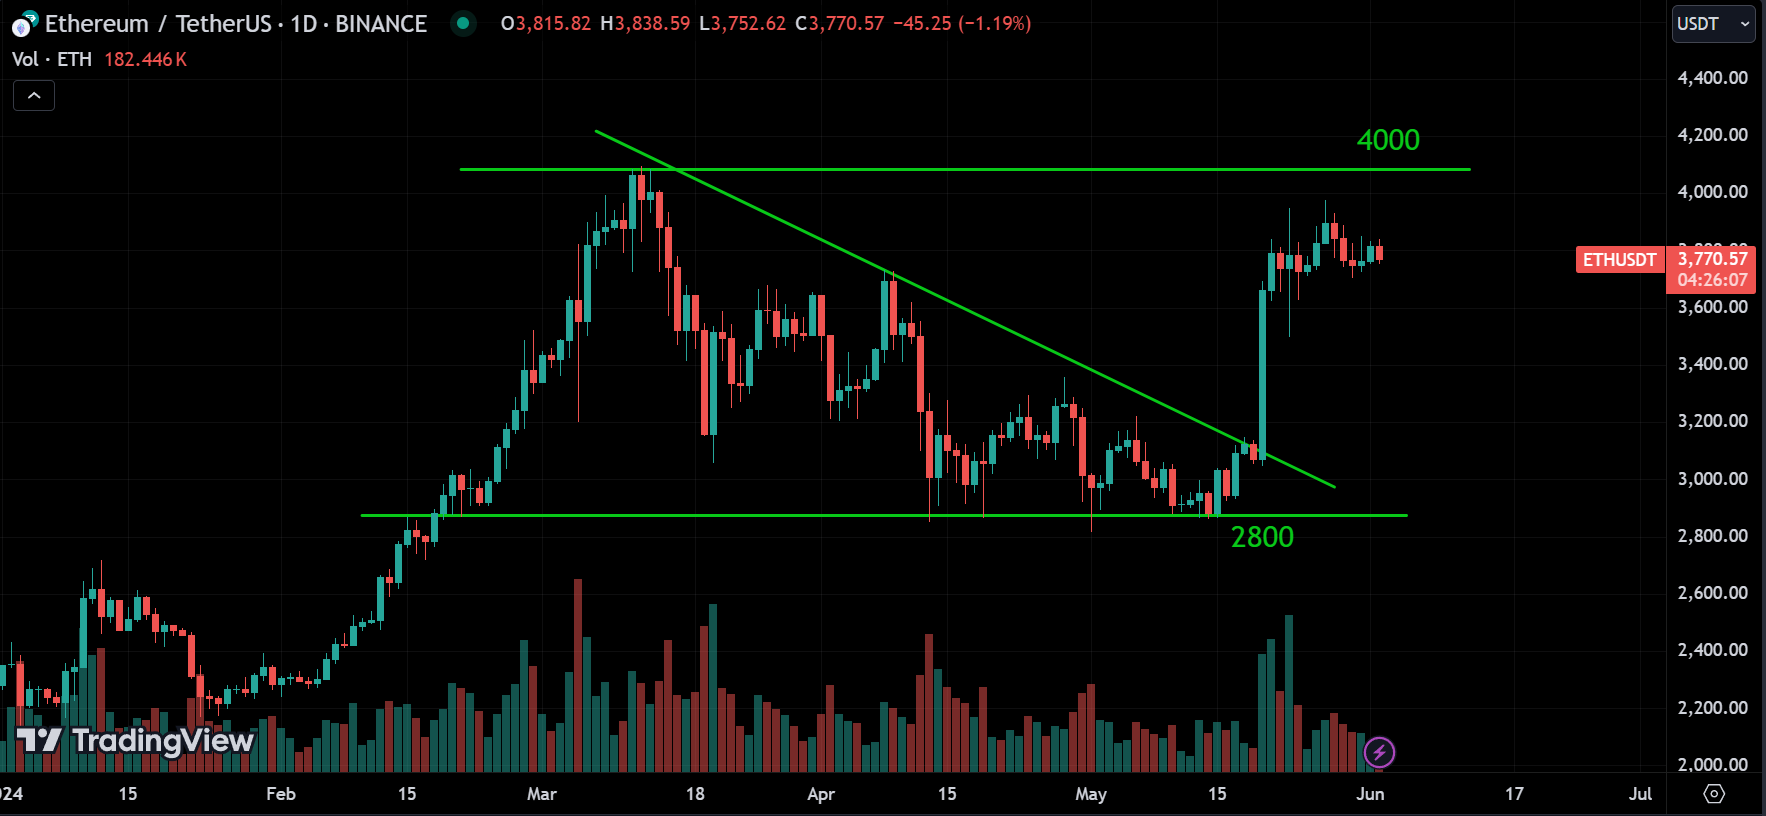
ETH is following a similar pattern to last week, aiming for the 4k range and currently consolidating just below 4000. We can anticipate that the price might break the 4000 resistance level and continue to rise, or it might start dropping toward the range of the slope triangle trend line.
BNB:
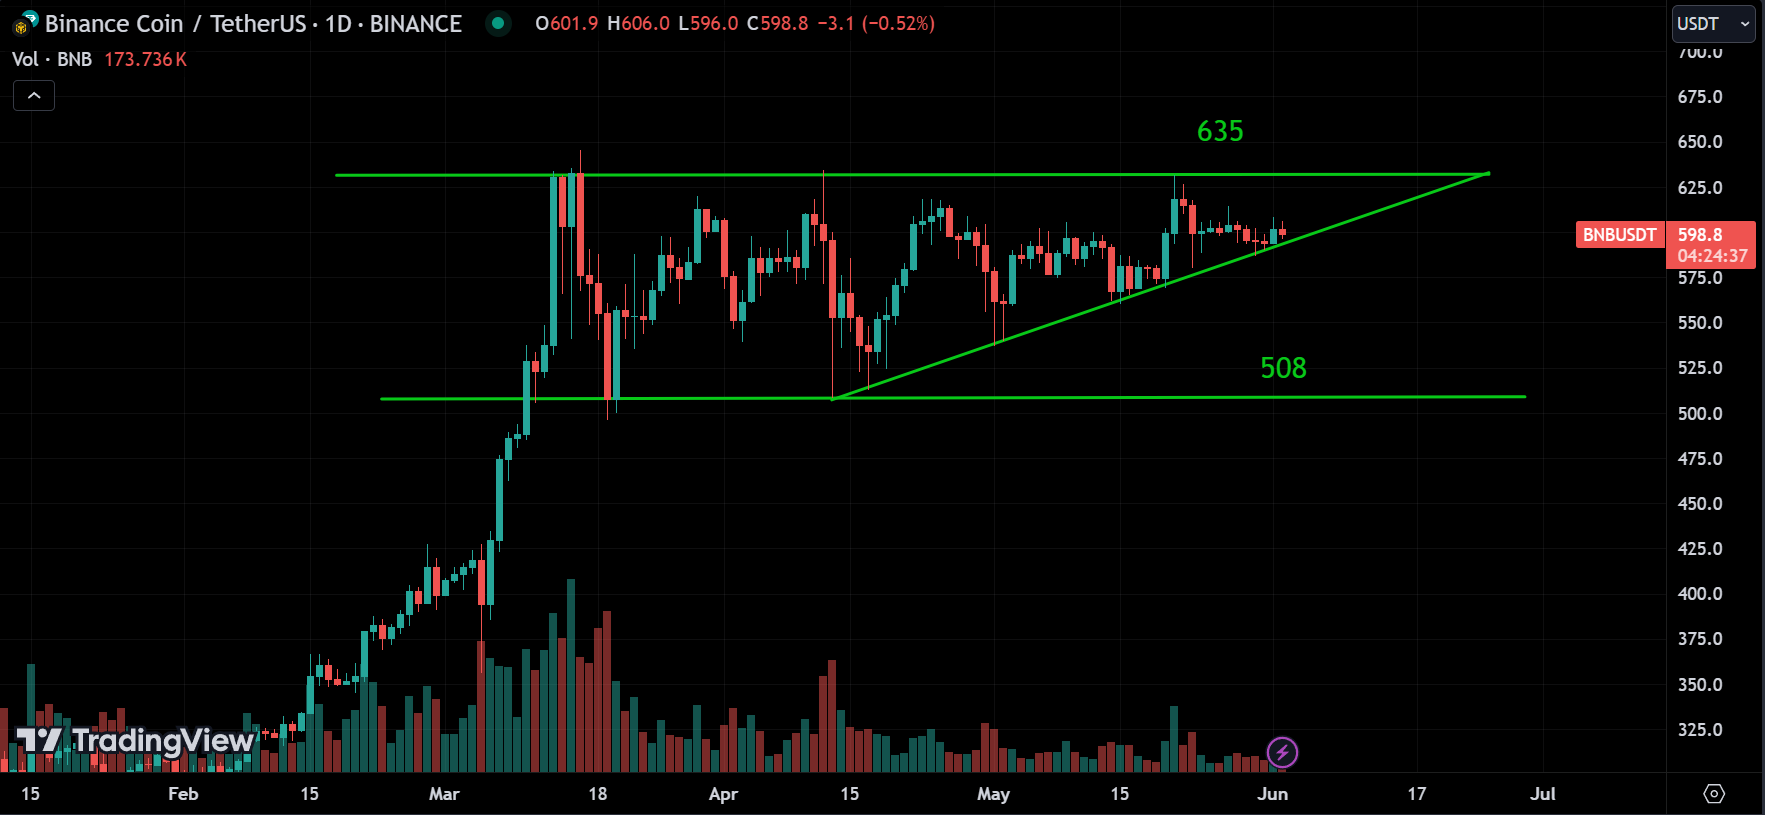
When observing BNB, it’s trading within a channel, and there’s an upward trend happening within that channel. You can notice that 508 is the strongest support, while 635 is the strongest resistance for the price. We can anticipate that the price might break above the 635 range and continue to rise, or it might retrace from the 635 level to the 508 level. Keep an eye out for any potential breakouts.
Conclusion & Disclaimer
It’s crucial to acknowledge the inherent unpredictability of financial markets. While we strive to offer informed perspectives on upcoming events and trends affecting various instruments, it’s important for readers to conduct their own analysis and exercise prudent judgment.
Encouragement of Independent Analysis
We strongly encourage readers to supplement the information presented here with their own research and analysis. Market dynamics can swiftly change due to many factors, and individual circumstances may vary. By conducting independent analysis, readers can tailor their strategies to align with their unique goals and risk tolerance.
No Certainty in Market Predictions
It’s vital to recognize that nobody possesses the ability to predict market movements with absolute certainty consistently. Market analysis serves as a tool to assess probabilities and identify potential opportunities, but it’s essential to remain cognizant of the inherent uncertainty in financial markets.
Aligning with High Probability
Rather than aiming for infallible predictions, our goal is to align with high-probability scenarios based on available information and analysis. This approach acknowledges the dynamic nature of markets while seeking to capitalize on opportunities with favorable risk-reward profiles.
Proceed with Caution
Lastly, while market analysis can offer valuable insights, it’s imperative to approach trading and investment decisions with caution. Markets can be volatile, and unforeseen events may impact asset prices unexpectedly. Exercise prudent risk management and consider seeking advice from qualified financial professionals before making any significant financial decisions.
Remember, the journey of financial analysis and investment is a continuous learning process, and embracing a disciplined approach can contribute to long-term success in navigating the complexities of global markets.
Please provide your feedback in the comment section below on how we can further improve our market analysis article. Thank you.
Please kindly provide me with the links on how to get free VPS to run the EAs
Thanks