

The Breakout and Retest Scanner is a MT4 indicator that looks for one setup. Price breaks through a support or resistance level, comes back to test it from the other side, then moves away again. The indicator scans up to 50 symbols on six timeframes from a single chart, draws every setup it finds with an entry, a stop loss and Fibonacci take-profit levels, and can send alerts to your phone. It is a free download on this page.
What Is a Breakout and Retest?
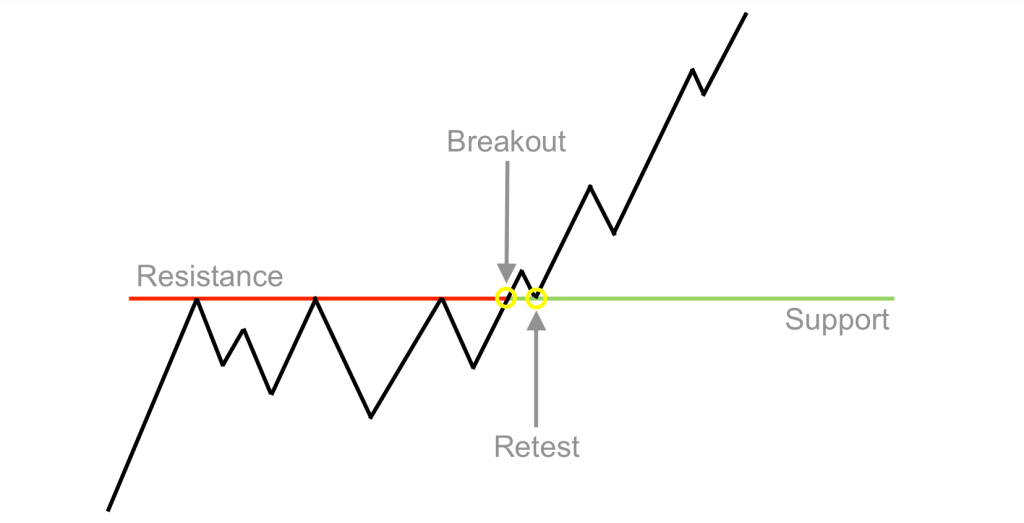
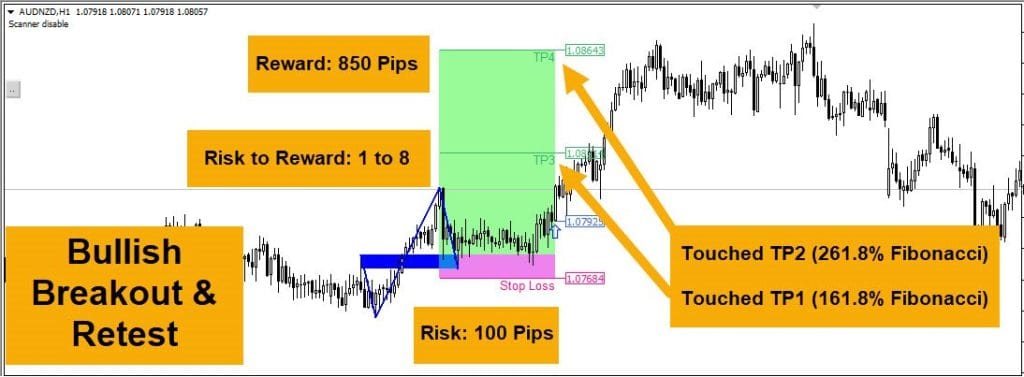
A breakout and retest is a support and resistance setup in three moves. Price breaks through a level, returns to it, then leaves it again in the breakout direction. The return trip is the retest. If old resistance now holds as support (or old support as resistance), the break is treated as real rather than a false breakout.
potting this by hand means watching a lot of charts and waiting, which is the job the scanner takes over. For the manual method, entry rules and risk math, see our guide on how to trade breakout and retest setups. The same idea applied to sloping levels is covered in the trendline retest strategy.
How the Breakout and Retest Scanner Marks a Setup
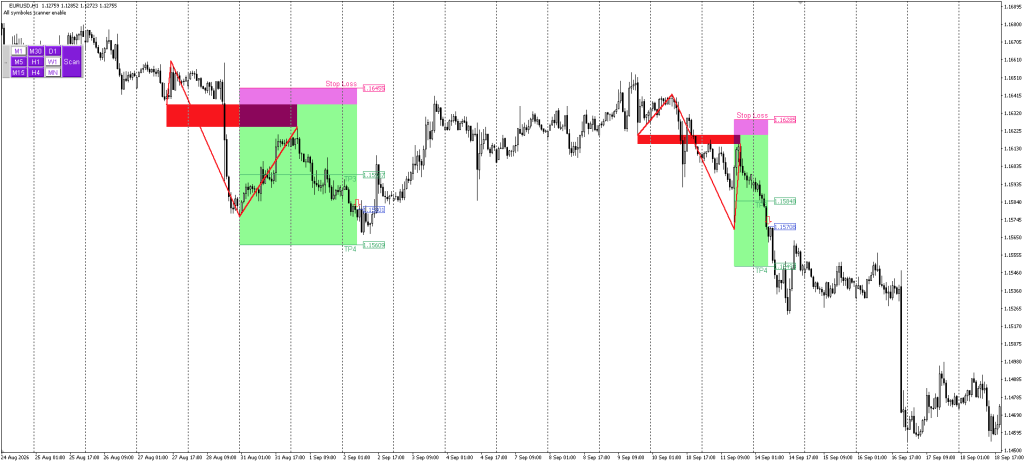
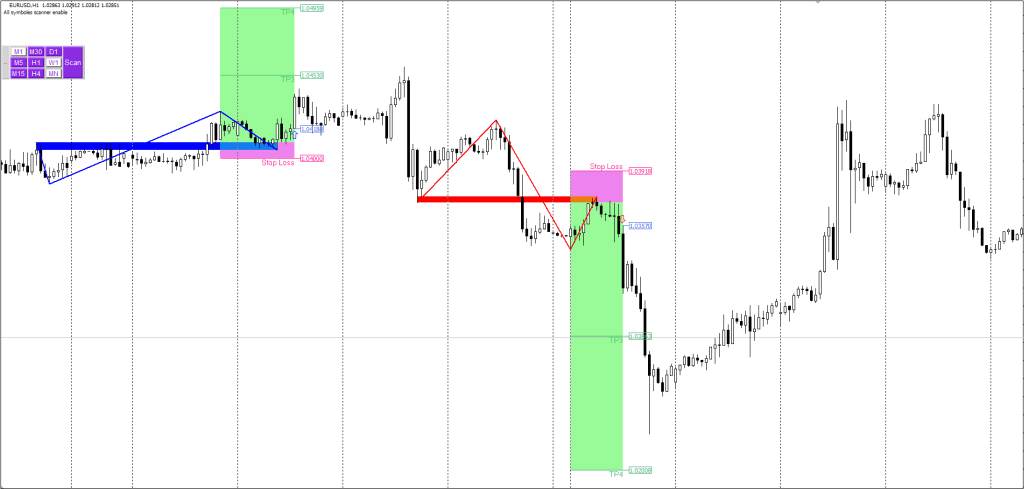
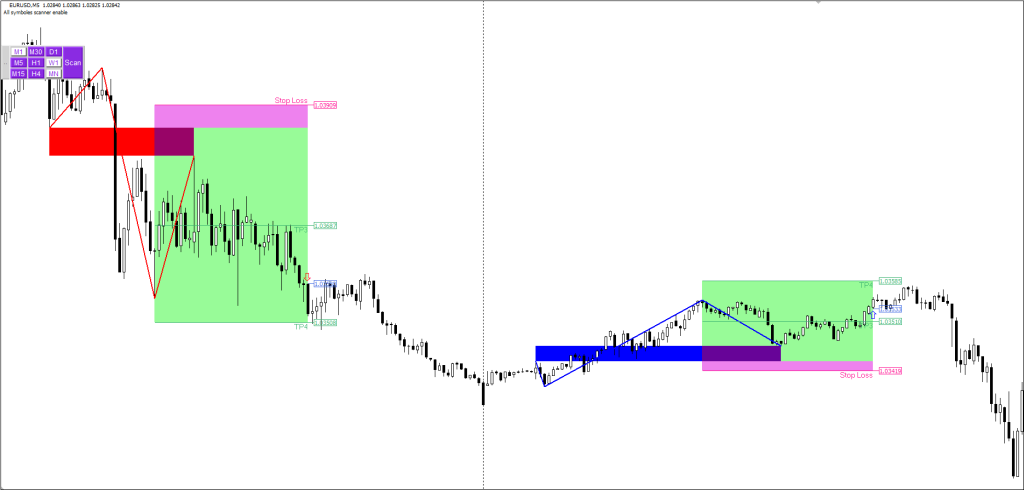
Every setup is drawn the same way:
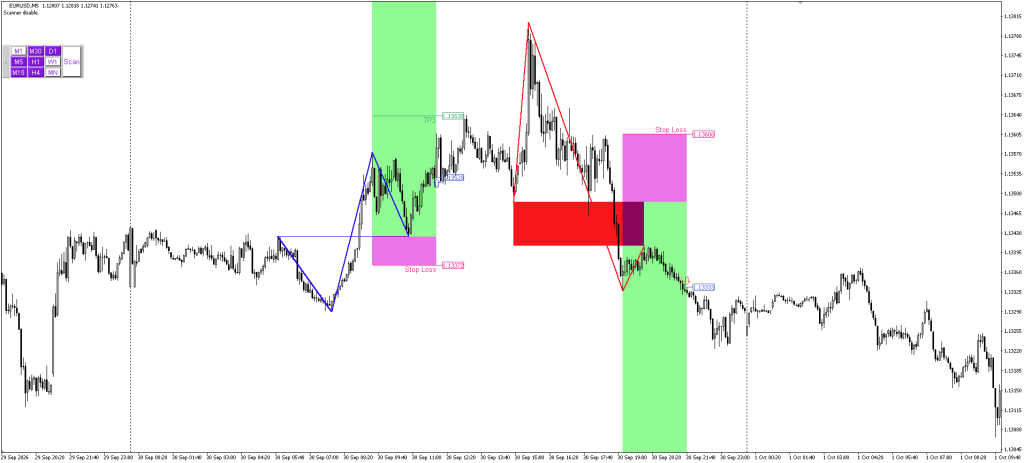
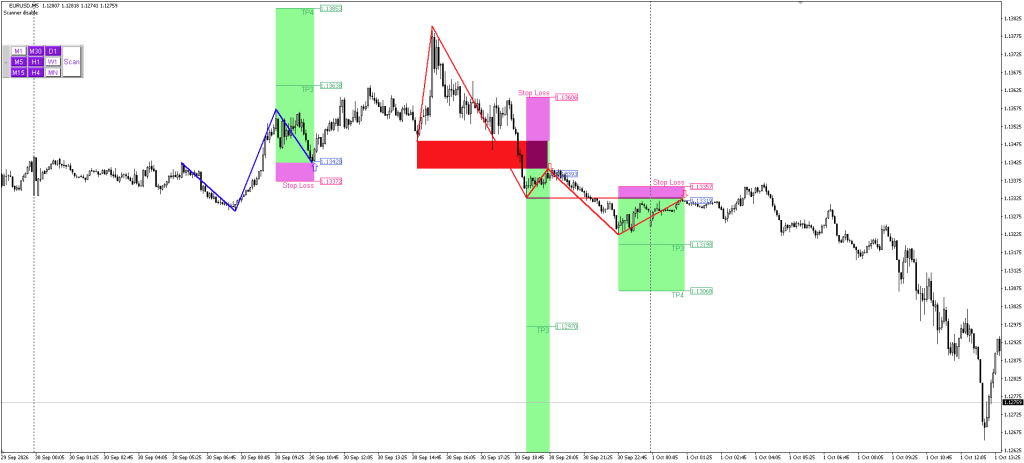
- Level zone – The broken support or resistance, drawn as a red block for a short and a blue block for a long. The darker overlap shows where the retest pushed back into it.
- Zigzag – Three lines tracing the swing before the break, the breakout leg and the retest leg.
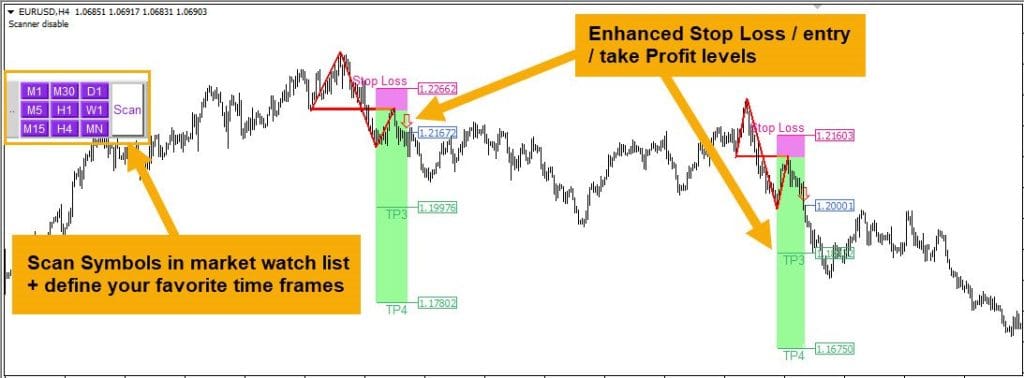
- Stop loss – The violet box above a short or below a long, with its price labelled.
- Targets – The green box. TP3 and TP4 sit at the 161.8% and 323.6% Fibonacci levels by default. TP1 and TP2 (38.2% and 61.8%) exist only in the Pattern method and are switched off.
- Entry – An arrow and a blue price label where the indicator treats the setup as triggered.
- Scan panel – Purple timeframe buttons are included in the scan. The Scan button turns scanning of every Market Watch symbol on and off, and the status line above the panel shows which state it is in.
The Method input decides when that entry arrow prints. Breakout, the default, waits for price to leave the retest and confirm the move. Pattern marks the entry as soon as the retest touches the level. Both use the same zone, stop and targets, so the only difference is how far price has already travelled when you are told about it. That difference turned out to be large.
If you only want breakout zones and test or retest markers on one chart, without a scanner or trade levels, the Auto Breakouts and Retests Indicator does that on MT4 and MT5.
The scanner works on any symbol in your Market Watch, so forex pairs, metals, indices and crypto CFDs are all fair game, from M5 up to D1. As with any signal tool, practise on an MT4 demo account until you know how its alerts behave before trading them live.
Settings and Customization
The download includes the indicator file and a general MT4 install guide, but no manual for the indicator itself. The table below covers every input that changes what it finds or how it alerts.
| Input | Default | What it does |
|---|---|---|
| Method | Breakout | Breakout waits for confirmation, Pattern enters at the retest |
| Auto scan Period | M5, M15, M30, H1, H4, D1 | Timeframes the scanner checks |
| Max Symbols | 50 | How many Market Watch symbols are scanned |
| Scanner Timer (Minute) | 15 | How often the scan repeats |
| Pattern History | 5000 | Bars searched for setups |
| Age Pattern (candles count) | 1 | How many candles old a setup can be and still trigger an alert |
| Just Perfect Pattern | false | Stricter pattern filter, fewer setups when on |
| Show Bullish\Bearish | Both | Longs, shorts or both |
| Fibo TP1 / TP2 (38.2% / 61.8%) | false | Extra near targets, Pattern method only |
| Fibo TP3 / TP4 (161.8% / 323.6%) | true | The two default targets |
| MA Filtering / period / method | false / 50 / Simple | Filters setups with a moving average |
| Display Alert / Push Notification / Send email | false | Alert channels, all off |
| Levels detail in signal | false | Adds entry, stop and target prices to the alert text |
The rest are display options: level labels, colours, arrow size, and a chart theme input set to White that should match your chart background.
Changes we would make. Several of them answer the issues traders raise most often when running the scanner day to day:
- Pick the method on purpose – The most common complaint from users is that the arrow arrives after the move has started, which is the Breakout method’s behaviour in our captures. Pattern gets you the retest price along with more failed setups, Breakout gets you confirmation and a later entry. One long-time user scans with Pattern only.
- Turn alerts on – Set Display Alert or Push Notification to true. Push also needs your MetaQuotes ID under Tools, Options, Notifications in MT4.
- Turn on Levels detail in signal – The alert then carries the entry, stop and targets, so you can judge a setup before opening the chart.
- Keep Age Pattern at 0 or 1 – Users report alerts for setups they could not find on the chart, or that were many candles old by the time they looked. Higher values alert on setups that formed several candles earlier, so keep this low.
- Favour H1 and above – Regular users say it works best from H1 up, which matches the cleaner H1 setups in our test. Remove M5 and M15 from Auto scan Period if you want fewer, cleaner alerts.
- Trim the scan if MT4 slows down – One user reported MT4 slowing down with the full scan running. 50 symbols on six timeframes is 300 combinations every 15 minutes, so lower Max Symbols or drop timeframes you do not trade.
- Test on your own broker first – One trader saw noticeably more false alerts on one broker’s price feed than on another’s. Run it on your broker’s demo before trusting the alerts.
What We Saw on EURUSD: Breakout vs Pattern Method
We loaded the indicator on EURUSD with default inputs, changed only the Method, and compared the two on H1 (late August to mid-September) and M5 (29 September to 1 October).
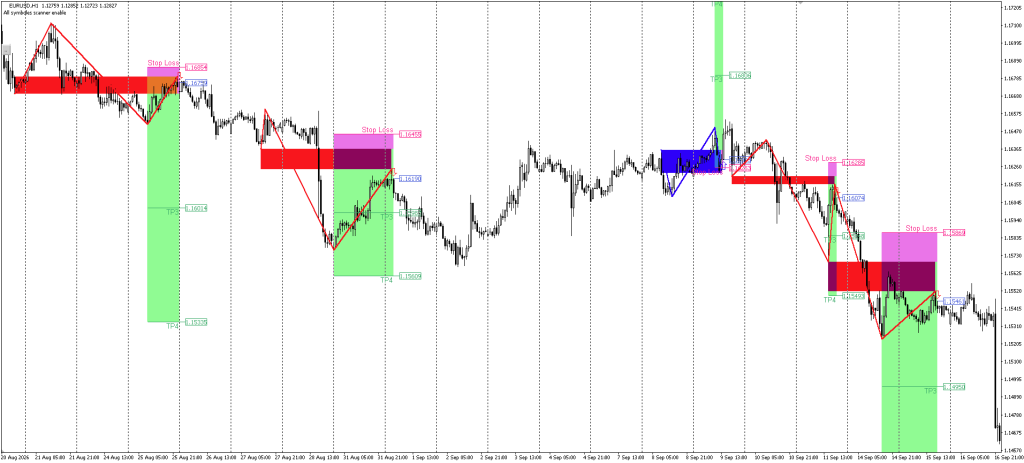
On the setups both methods drew, the zone, stop and targets were identical. Only the entry moved:
| Setup (EURUSD) | Stop | Pattern entry | Breakout entry | Risk to stop (Pattern / Breakout) | TP3 at entry (Pattern / Breakout) |
|---|---|---|---|---|---|
| H1 short, 31 Aug to 2 Sep | 1.16455 | 1.16190 | 1.15801 | 26.5 / 65.4 pips | 20.5 pips ahead / already passed |
| H1 short, 11 to 14 Sep | 1.16285 | 1.16074 | 1.15708 | 21.1 / 57.7 pips | 22.6 pips ahead / already passed |
| M5 long, 30 Sep | 1.13372 | 1.13428 | 1.13528 | 5.6 / 15.6 pips | 21.0 / 11.0 pips ahead |
| M5 short, 30 Sep | 1.13606 | 1.13393 | 1.13333 | 21.3 / 27.3 pips | 42.3 / 36.3 pips ahead |
On H1 the Breakout method printed its arrow a day or more after the retest. By then price had already passed TP3 on both shorts, which left a stop more than twice as far away and only TP4 as a target. On the first short, the Pattern entry reached TP3 within a day. The Breakout entry, 39 pips lower, never reached TP4, and price came back through the stop on 9 September.
On M5 the gap is smaller but points the same way: 10 pips later on the long and 6 pips later on the short.
The Pattern method also draws more. Across the shared H1 window it marked five setups against two for Breakout, and three of the five were setups the Breakout method never confirmed. Two of those reached TP3. The third, a long on 9 September with a stop about 5 pips away, was stopped out the same day. That is the trade-off: Pattern gets you in at the level and shows you more, including setups that fail quickly. Breakout shows fewer and shows them late.
Eight setups on one pair is a sample, not a statistic, and none of these figures include spread.
How to Use It
- Step 1: Load the symbols – Add the pairs you want scanned to Market Watch. The scanner reads that list, so the indicator only needs to sit on one chart.
- Step 2: Set alerts and method – Switch on the alerts you want and choose Breakout or Pattern.
- Step 3: Open the alerted chart – When an alert arrives, open that symbol and timeframe and check the drawing: the level, the retest, and where the entry sits against TP3.
- Step 4: Check the room left – If the entry is already past TP3, which happened with the Breakout method on H1, the stop is far away and only TP4 is left. Decide whether the remaining reward still covers the risk.
- Step 5: Size from the stop – The stop distance changes with every setup, so a fixed lot means a different risk each time. Size it with our Lot Size Optimizer.
As a standalone indicator, its effectiveness often depends on how it’s combined with other tools or strategies. A higher-timeframe trend check, either the built-in MA filter or a separate tool such as Trend Radar, keeps you from trading retests against the bigger move. If you hold for TP4, a Fibonacci based trailing stop is one way to lock in part of the move on the way.
Traders who would rather automate breakout trading can compare the Session Range Breakout EA, a robot that trades range breaks on five markets.
Breakout and Retest Scanner
An MT4 indicator that scans up to 50 symbols on six timeframes for breakout and retest setups and draws each one with an entry, a stop loss and Fibonacci take-profit levels, with optional pop-up, push and email alerts.
Pros
- Scans up to 50 Market Watch symbols on M5 to D1 from one chart
- Entry, stop loss, TP3 and TP4 drawn for every setup
- Pattern method enters at the retest with a tight stop
- Pop-up, push and email alerts, with prices in the alert text if enabled
Cons
- Default Breakout entries come late, and on both H1 shorts we checked TP3 was already passed
- All alert channels ship switched off
- Pattern method also draws setups the Breakout method filters out, some of which fail fast
Summary
The scanner does the slow part of this strategy, which is checking dozens of charts for the same structure, and every setup arrives with its levels already drawn. The Method input matters more than anything else in the settings. The default Breakout method waits for confirmation and enters well after the retest, while the Pattern method enters at the retest with the same stop and the same targets. Alerts are off by default.
 Built by ForexCrackedWe tested 1,200+ indicators. Then we built our own.Six years of reviewing EAs and indicators went into FXC Fusion: two engines, the seven-panel cockpit, MT4 and MT5, from the team behind this site.
How It Compares
| Breakout and Retest Scanner | Auto Breakouts and Retests | Support Resistance Breakout Arrows | |
|---|---|---|---|
| Main output | Full setup: level, retest, entry | Swing zones that change colour on a break, test and retest markers | Buy and sell arrows with support and resistance lines |
| Trade levels | Entry, stop, TP3 and TP4 | Zones only | Arrows only |
| Symbols | Up to 50 from one chart | The chart it is on | The chart it is on |
| Signal logic | Swing structure plus retest | Swing points plus zone tests | Fractals, CCI and RSI |
| Platform | MT4 | MT4 and MT5 | MT4 |
The scanner is the only one of the three that hands you a complete trade plan and watches more than one chart. The other two are lighter chart tools that leave entries and stops to you.
Frequently Asked Questions
Conclusion
The Breakout and Retest Scanner takes over the slow part of this strategy: checking dozens of charts for the same three-move structure and drawing the levels when it appears. The drawings are clear, and every setup arrives with its entry, stop and targets already marked.
However, results depend mostly on one input. With the default Breakout method, H1 entries came late enough that TP3 was already behind them. With the Pattern method, the same setups were entered at the retest with the same stop, along with extra setups that sometimes failed fast. Treat each alert as a candidate to check, not a trade to copy, and switch the alerts on before relying on it.


Discussion 4 comments
Is this still working?
nice explanations and god knowledge giving thank you broh.
bro i have a request i need a source code can please gimme on my mail id because is use EA5 and this was EA 4 so please
please i need the MT5 version
No alert sent for me couple of days. Anybody have the same issue?
Thanks admin looks good.