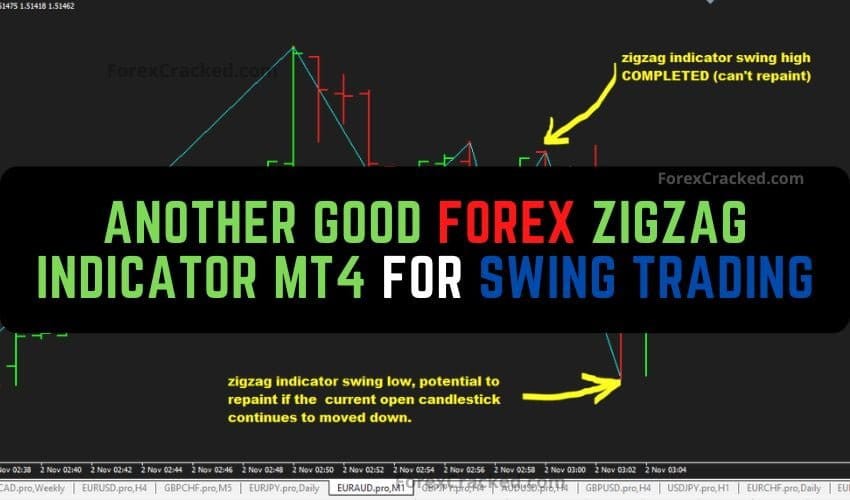
Another Good Forex Zigzag Indicator Mt4 For Swing Trading
If you are looking for the best forex swing trading indicator, mt4, that picks up most swing high and swing low...
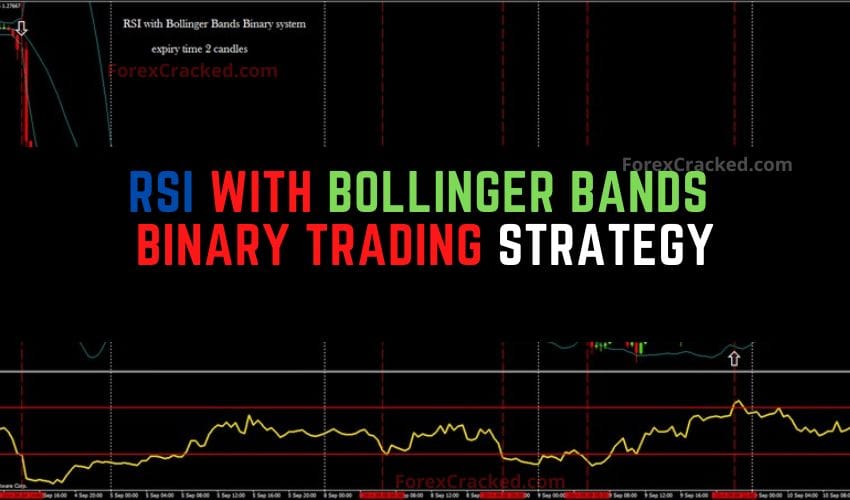
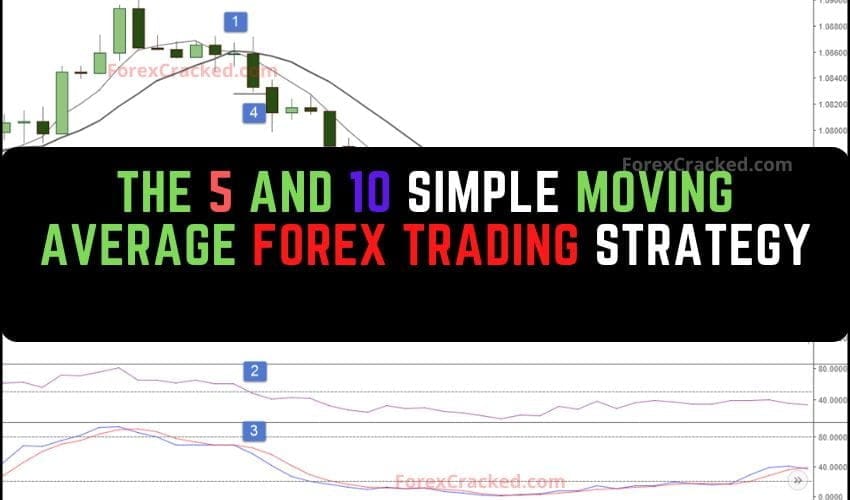
Trend indicators (like Moving Averages, SuperTrend) identify market direction and work best in trending markets. Oscillators (like RSI, Stochastic) measure momentum and identify overbought/oversold conditions, better for ranging markets.
Yes, combining 2-3 complementary indicators provides better confirmation. For example, use a trend indicator (SuperTrend) with an oscillator (RSI) and a volatility tool (ATR). Avoid using too many indicators that show the same thing.
Many analysis indicators in this category are non-repainting, meaning signals don't change after they appear. Check each indicator's description—we note repainting status in our reviews.
Start with classic indicators like MACD, RSI, or Moving Averages. These are well-documented, easy to understand, and form the foundation of technical analysis. Add more complex tools as you gain experience.
A forex analysis indicator is a technical tool that processes price data to help traders identify trends, momentum, volatility, and potential reversals. Examples include MACD, RSI, Bollinger Bands, and custom oscillators.