FXC Correlation Matrix
See what moves with your chart and against it in one correlation matrix, before you take the same trade twice.
MT4 and MT5 in one zip. No sign-up, the file downloads straight away.
- Use it on as many accounts as you like, demo or live
- Every update free, and your chart tells you when one is out
- Chart template in the zip, ready to load
Forex correlation indicator dashboard
FXC Correlation Matrix is a free forex correlation indicator for MT4 and MT5. It compares your chart with the 28 major pairs, gold, silver, oil, six stock indices, bitcoin and ether, and shows what moves with it and what moves against it.
The dashboard has two parts. The web joins your chart to the three symbols that move most with it and the three that move most against it. The correlation matrix below shows every symbol at once, coloured by how closely it moves with your chart.
It finds the symbols at your broker by itself, so there is no list to type. It reads closed bars only, it has no alerts and it does not place trades.
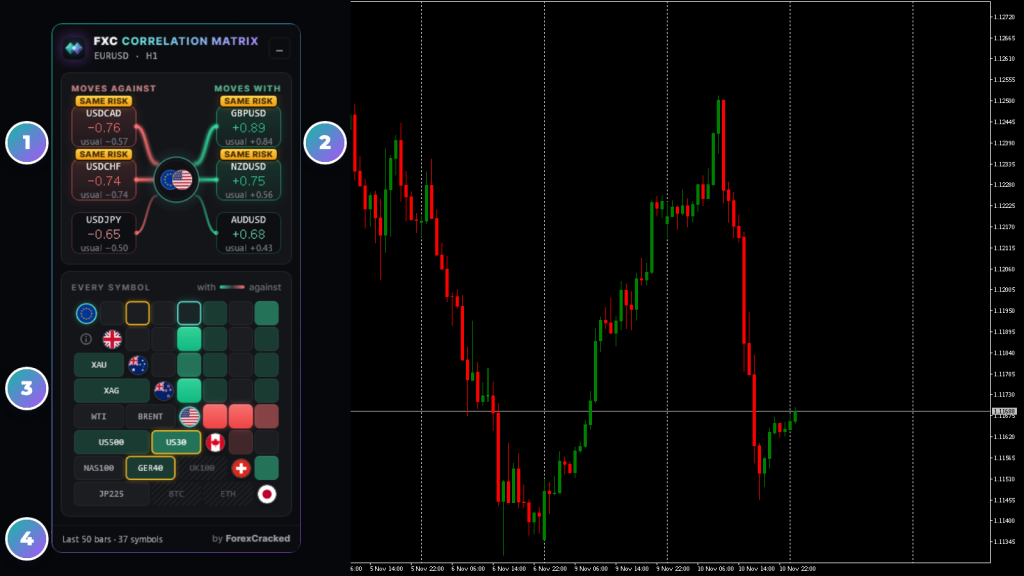
- 1Moves againstThe three symbols with the lowest correlation: r now, and its usual over 10 times as many bars.
- 2Moves withThe three with the highest. SAME RISK marks any link of 0.70 or more, either way.
- 3The correlation matrixEvery symbol against your chart. A pair sits where its two currencies' flags meet; metals, indices and crypto sit below.
- 4The footerThe window in bars and how many symbols are compared. Its tooltip names any your broker doesn't have.
Forex correlation indicator on real charts, every week
How to read the correlation colours
Each cell of the correlation matrix is one symbol read against your chart. Green moves with it, red moves against it, and the brighter the cell, the closer the link. Correlation runs from +1, always together, to −1, always opposite.
- 0.70 or moreA strong link. Its card in the web gets the SAME RISK tab.
- 0.50 to 0.70A clear link.
- 0.30 to 0.50A loose link.
- Under 0.30No real link: over 50 bars a number that small can be chance.
- RedThe same steps the other way: it moves against your chart.
- Mint ringYour chart itself.
- Amber ringChanged lately: the reading is 0.40 or more away from its usual.
- HatchedNot at your broker, switched off, or too few bars on this timeframe.
Where to find a pair: the 8 currencies' flags run down the diagonal. A pair sits where its first currency's row meets its second currency's column, so EURUSD is on the EUR row, under the USD flag. Gold, silver, oil, the indices and crypto fill the steps below the flags.
How to use FXC Correlation Matrix
Four steps, with a EURUSD H1 chart as the example.
- 1Add it to the chart you trade. It compares that chart on its own timeframe, so H1 and D1 each get their own readings.
- 2Let the history load. The footer says "Reading the history" while your broker sends each symbol's bars, then "Last 50 bars" and how many symbols are compared.
- 3Read the web. GBPUSD on the right with SAME RISK means a buy on both is close to one trade twice. USDCHF on the left with SAME RISK means a buy on EURUSD and a sell on USDCHF is the same.
- 4Check the usual. Each card shows the usual over 500 bars beside the reading over 50. In amber, the link is not what it usually is.
It's a reading, not an entry signal. The indicator shows how closely markets have moved with your chart. Your entries, stops and size stay your own call.
Correlation indicator features
Moves with, moves against
The three symbols that move most with your chart and the three most against it, each with its correlation.
A full correlation matrix
All 28 major pairs, gold, silver, WTI, Brent, six indices, BTC and ETH, coloured against your chart.
SAME RISK
A tab on any link of 0.70 or more: trading both is close to the same trade twice.
Now and usual
Each reading sits beside its usual over 10 times as many bars, in amber when the link has changed lately.
Finds your broker's names
Prefixes, suffixes and names like GOLD, USTEC or DE40 are found by themselves. Nothing to type.
Point to read a cell
Point at a cell and its two flags light up, a line joins them, and the reading shows above the matrix.
Read on closed bars
Bar-to-bar moves, matched by time, on your chart's timeframe. The numbers change when a bar closes.
Four switches
Forex, metals and oil, indices and crypto can each be left out.
FXC Correlation Matrix: questions, inputs and versions
Questions about FXC Correlation Matrix
Is it really free?
Yes. It is yours to keep, on MT4 and MT5.
Does it place trades for me?
No. It is an indicator. It shows you the picture, and you place the trade.
Do I need an account?
No. The download starts straight away. You need one to leave a review.
What does each cell of the matrix show?
That symbol against your chart, not the two currencies against each other. Point at a cell to read its correlation and its usual.
Why is a cell hatched?
Your broker doesn't have that symbol, its group is switched off, or it has too few bars on your chart's timeframe. The footer's tooltip names the missing ones.
Which timeframe does it use?
Your chart's. Each correlation is read over the last 50 closed bars of it, the usual over the last 500. Switch the timeframe to read another.
Can an EA read the correlations?
No. It has no buffers: the readings are in the dashboard only.
FXC Correlation Matrix inputs
FXC Correlation Matrix versions and changelog
- 1.0010 Nov 2026Latest
- New: first release.
Before you download: installing FXC Correlation Matrix
- A computer or a VPS. The MetaTrader phone apps can't run custom indicators.
- Allow DLL imports. The update check uses it. The chart template in the zip already has it on.
- In the zip: the MT4 and MT5 files and a chart template.
More help: How to install EAs and indicators in MT4 and MT5.
Download the zip and follow the guide. At the end, load the chart template FXC Correlation Matrix.
Install guideFXC Correlation Matrix reviews
Requests for FXC Correlation Matrix
Vote on what we build for FXC Correlation Matrix next, or add your own idea.
No requests for this one yet.
Adding a request takes a free account. We read every request first, so yours shows here once it's on the list.
An idea for a new indicator or EA? Ask on the roadmap
More dashboard tools

Fibonacci Levels
Wedge Patterns