FXC Wedge Patterns
A wedge pattern indicator and scanner: rising and falling wedges across your markets, and the side each usually breaks.
Card or PayPal. Your licence key shows on screen and comes by email.
- Use it on 5 MT4 or MT5 accounts
- MT4 and MT5 files on one licence
- Every update free
- 14-day refund, whichever way you pay
- Help within 24 hours, 24/7. Ask a question
- No sponsor messages on our free indicators
Wedge pattern indicator and scanner
FXC Wedge Patterns is a wedge pattern indicator for MT4 and MT5. It finds rising and falling wedges on your chart as they form, and scans up to 40 markets on three timeframes for the same.
A wedge is built from closed bars only: four swings, two highs and two lows, with both lines sloping the same way and closing in, and every bar between them. Once found, it never changes. The close that breaks it gets an arrow, and the break gets a stop on the other line and a target one pattern height away.
Each wedge's likely side is lit: down for a rising wedge, up for a falling one, as the textbooks have it and as the developer's study of past charts found. It's about the break, not the move after it. The dashboard shows this chart's wedge and its two break prices, the scanner's list nearest a likely break first, and how the last 50 breaks went. It doesn't place trades.
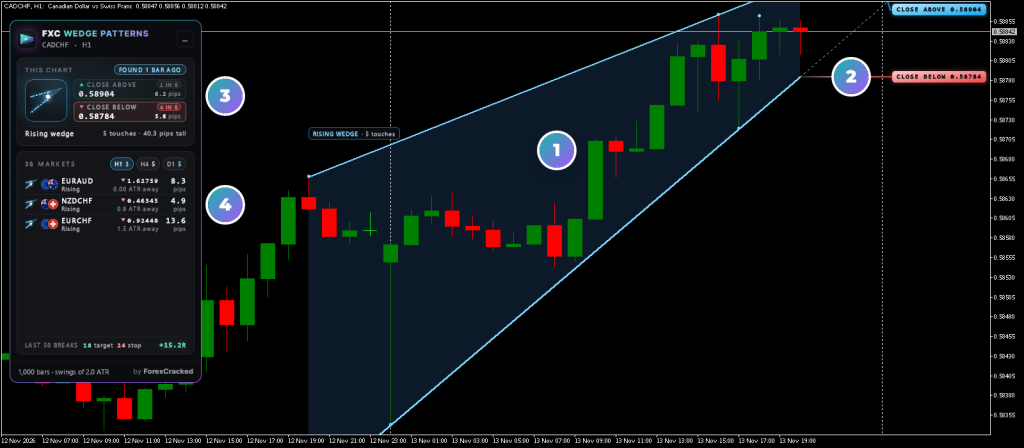
- 1The forming wedgeIts two lines from the first touch, a dot on each touch, and a dotted run to where the lines meet.
- 2The break pricesCLOSE ABOVE and CLOSE BELOW at the right edge. The likely side's tag is in its colour.
- 3This chartThe wedge's type and touches, and both break prices with the likely side lit.
- 4The scannerWedges forming on your timeframe and the next two, nearest a likely break first. A click opens one.
Wedge pattern indicator on real charts, every week
How to read the wedge dashboard
The card at the top is this chart. The list under it is the scanner, one tab per timeframe. Every part has a tooltip with the numbers.
How to use FXC Wedge Patterns
From the scanner to one wedge's break, on the chart you trade.
- 1Add it to your chart. It reads this chart's last 3,000 closed bars, and every market your broker has of its 40 on your timeframe and the next two.
- 2Pick a wedge from the list. Forming ones come first, nearest their likely break first: "1.4 ATR away" means the close is 1.4 ATR from the likely side's line. A click opens that market and timeframe on this chart.
- 3Read its two break prices. CLOSE ABOVE and CLOSE BELOW are the closes that would break it. The likely side is lit: below for a rising wedge, above for a falling one. A close past either line ends the wedge, and the arrow prints on that bar.
- 4Read the break as a trade. The entry is the break close, the stop the other line, the target one pattern height away. The box on the chart and the card show where price sits between them.
The likely side is about the break, not the move after it. The trade it draws is a reading, not an order: the decision stays yours.
Wedge scanner features
Rising and falling wedges
From four swings on closed bars, both lines sloping the same way. Triangles are left out.
The likely side lit
Down for a rising wedge, up for a falling one, from the developer's study of past charts. Not a forecast of the move.
Up to 40 markets
The 28 pairs, gold, silver, two oils, six indices, BTC and ETH, under your broker's own names.
Three timeframes at once
Your chart's timeframe and the next two, each a tab with its count of rows.
Nearest a likely break first
Forming wedges sorted by how far the close is from the likely side's line, in each market's ATR.
Decided on closed bars
The live bar never counts. Once found, a wedge and its arrow never change.
A stop and target on every break
The stop on the other line, the target in pattern heights from the break close. You set both.
Alerts
A new wedge with its likely side, and a break with its stop and target. Popup, sound, push or email.
FXC Wedge Patterns: questions, inputs and versions
Questions about FXC Wedge Patterns
Does it work on MT4 and MT5?
Yes. One licence gives you both files.
How many accounts can I use it on?
Five MT4 or MT5 accounts, demo or live. You can move a slot to a new account in My products.
Does it place trades for me?
No. It is an indicator. It shows you the picture, and you place the trade.
Do updates cost extra?
No. Every update is free, and the panel on your chart tells you when one is out.
What if it isn't for me?
Ask for a refund within 14 days of buying: ask us, or open a ticket from My products. No reason needed.
Does it say which way a wedge will break?
It lights the likely side: down for a rising wedge, up for a falling one, from the developer's study of past charts. It's a tendency, not a forecast, and it says nothing about how far price moves after the break. Both break prices are drawn, and a break the other way gets its arrow, stop and target too.
Can an EA read the wedges?
No. FXC Wedge Patterns is a premium indicator, and a hidden copy inside an EA gets no licence, so its buffers stay empty. It's made for the chart.
Why does it need Allow DLL imports?
The licence check uses it. The chart template in the download turns it on. Without it, MetaTrader 5 won't start the indicator, and MetaTrader 4 shows an alert saying so.
What happens if the licence can't be checked?
MetaTrader shows an alert with the reason, for example a key already on 5 accounts, and the indicator takes itself off the chart. A chart that was already licensed keeps working for 7 days without a check.
Not answered here? We reply within 24 hours, 24/7.Ask us
FXC Wedge Patterns inputs
FXC Wedge Patterns versions and changelog
- 1.0115 Nov 2026Latest
- Changed: the licence check is updated; nothing changes on the chart.
- 1.0013 Nov 2026
- New: first release.
Before you buy: installing FXC Wedge Patterns
- A computer or a VPS. The MetaTrader phone apps can't run custom indicators.
- Allow DLL imports. The licence check uses it. The chart template in the zip already has it on.
- In the zip: the MT4 and MT5 files and a chart template, on one licence.
More help: How to install EAs and indicators in MT4 and MT5, or open a support ticket.
Get the zip from your success screen or My products and follow the guide. At the end, load the chart template FXC Wedge Patterns. Your licence key is already in it, so the panel shows Licence active.
Install guideMoving to a new VPS or broker? Free up a slot in My products first.
Stuck installing or activating? Open a support ticket and pick this product.
FXC Wedge Patterns reviews
Requests for FXC Wedge Patterns
Vote on what we build for FXC Wedge Patterns next, or add your own idea.
No requests for this one yet.
Adding a request takes a free account. We read every request first, so yours shows here once it's on the list.
An idea for a new indicator or EA? Ask on the roadmap
More dashboard tools

Triangle Patterns
Super Bands