FXC Super Bands
See how quiet or wild the market is, and forecast how far price is likely to move.
MT4 and MT5 in one zip. No sign-up, the file downloads straight away.
- Use it on as many accounts as you like, demo or live
- Every update free, and your chart tells you when one is out
- Chart template in the zip, ready to load
A volatility indicator with a forecast
FXC Super Bands is a free volatility indicator for MT4 and MT5. It draws adaptive bands that turn amber in a squeeze, and forecasts how far price is likely to move in the next 20 bars. It never says which way.
The dashboard ranks the band width against its own last 120 bars, from SQUEEZE to WILD, and shows four lines ahead of price: the likely high and low, and the 8-in-10 high and low, the usual reach. They come from how far price went after past bars in the same state, on your chart's own history once it has enough bars.
The bands and the squeeze colour are worked out on closed bars and stay as they are once a bar closes. The forecast is redrawn from the price now. It has no arrows and no buy or sell signals, and it does not place trades.
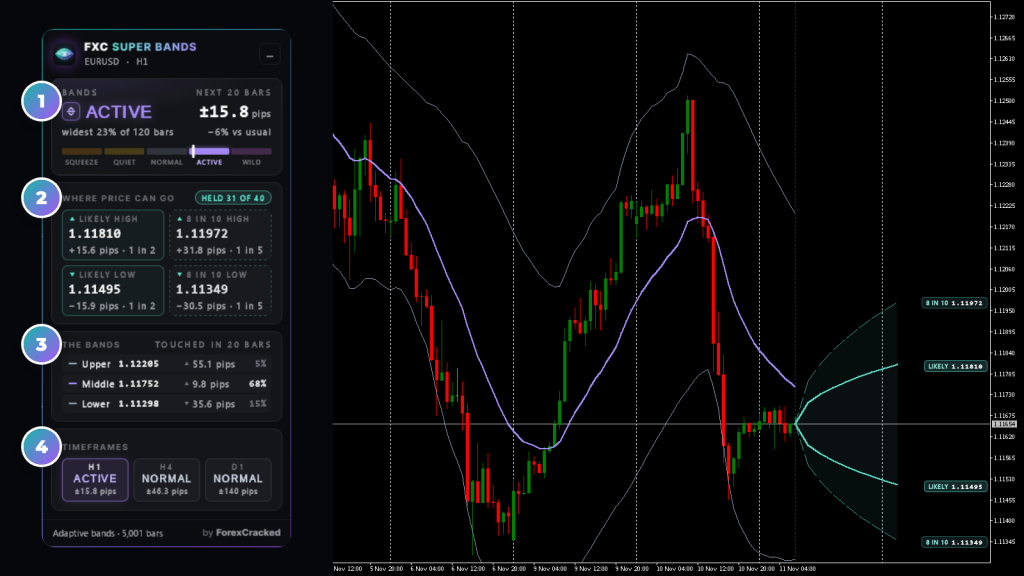
- 1The volatility stateSQUEEZE to WILD on a five-zone scale, the likely move in pips, and how it compares with the chart's usual move.
- 2Where price can goLIKELY and 8 IN 10, high and low, each with its price and distance. Point at one to light its line on the chart.
- 3The bandsUpper, middle and lower with their prices, and how often past moves from this state touched each within 20 bars.
- 4TimeframesThe state and the likely move on your chart's timeframe and the next two up.
Volatility indicator on real charts, every week
Volatility states, from squeeze to wild
The state is the band width's rank among its own last 120 bars: the share of them that were narrower. It's relative to your chart, so SQUEEZE is the narrowest tenth of its recent bars, on a quiet market or a busy one.
| State | Rank | Reads as |
|---|---|---|
| SQUEEZE | 0 to 10% | The narrowest tenth. The bands turn amber on the chart |
| QUIET | 10 to 25% | Narrower than usual |
| NORMAL | 25 to 75% | The usual width |
| ACTIVE | 75 to 90% | Wider than usual |
| WILD | 90 to 100% | The widest tenth |
Band Width doesn't change the state: a rank ignores scale, so only Middle EMA Period and Volatility Memory move it. The dashboard shows the state on your timeframe and the next two up.
The forecast: how far, never which way
For every past bar on your chart in the same state as now, it measures how far price went up and how far down in the next 20 bars, in ATR. From those moves it draws four lines ahead of price.
- LIKELY HIGH and LOW
- The middle of those moves: half went further, half stopped short. The boxes say 1 in 2.
- 8 IN 10 HIGH and LOW
- The usual reach: past moves went beyond it 1 time in 5. The boxes say 1 in 5.
- Measured in ATR
- So the lines follow today's volatility. With a short history they come from a built-in table from 9 markets, and the footer says so.
A range, never a direction. A high and a low are drawn every time, from the price now, on every tick. They show how far moves went before, not where this one stops.
How to use FXC Super Bands
Four steps, using an H1 chart as the example.
- 1Add it to the chart you trade. It reads that chart's timeframe, and the dashboard adds the next two up, so an H1 chart also shows H4 and D1.
- 2Read the state. SQUEEZE means the bands are in the narrowest tenth of their last 120 bars, and they turn amber on the chart. WILD is the widest tenth.
- 3Check the four lines before you set a stop or a target. They show how far past moves from this state went in the next 20 bars. A level beyond the 8-in-10 line is outside that usual reach.
- 4Turn on an alert if you want one. Alert When the Bands Squeeze tells you when an H1 bar closes in SQUEEZE, Alert When They Leave a Squeeze when one closes out. Both are off by default.
It's a range, not an entry signal. The lines say how far, never which way. Your direction, entry, stop and size stay your own call.
Volatility bands and dashboard features
How far, never which way
Four lines ahead of price for the next 20 bars: the likely high and low, and the 8-in-10 high and low. No arrows, no buy or sell signals.
Five volatility states
SQUEEZE, QUIET, NORMAL, ACTIVE or WILD, from the band width's rank among its own last 120 bars.
Adaptive volatility bands
An EMA middle with bands set by a volatility weighted to recent bars. In a squeeze the bands turn amber.
A forecast cone on the chart
The four lines open out from the last bar, each with a price tag at the right edge. Point at a box in the dashboard and its line lights up.
Three timeframes at once
The dashboard shows the state and the likely move on your chart's timeframe and the next two up.
Touch odds for each band
How often past moves from the same state touched the upper band, the middle and the lower band within 20 bars.
A record on every chart
A chip counts how often the 8-in-10 lines of the chart's last 20 forecasts held. It is counted again on every new bar.
Squeeze alerts
When a bar closes in a squeeze, and when one closes out of it. Popup, sound, email or a push to the MetaTrader app.
FXC Super Bands: questions, inputs and versions
Questions about FXC Super Bands
Is it really free?
Yes. It is yours to keep, on MT4 and MT5.
Does it place trades for me?
No. It is an indicator. It shows you the picture, and you place the trade.
Do I need an account?
No. The download starts straight away. You need one to leave a review.
Does it say which way price will go?
No. It forecasts how far price is likely to move, never which way. A high and a low are drawn every time, and it has no arrows and no buy or sell signals.
Does this volatility indicator repaint?
The bands and the squeeze colour are worked out on closed bars and stay as they are once a bar closes. While a bar forms, its bands and its amber can move with the price. The forecast lines are redrawn from the price now on every tick, by design, and no old forecast is left on the chart.
Why does the dashboard footer say 9 markets?
Your chart's history is too short for a forecast table of its own: that takes about 1,600 bars at the default settings. Until then the lines come from a built-in table from 9 markets. Once there are enough bars, the footer shows how many it learnt from instead. Under 300 bars it says needs 300 bars and the cone waits.
Can an EA read the bands?
Yes. Buffers 0, 1 and 3 hold the upper band, the middle and the lower band, and buffer 10 the state, 0 for SQUEEZE to 4 for WILD. Buffers 6 to 9 hold a forecast per bar, but they are worked out again on history with the latest table, so they are not a backtest.
FXC Super Bands inputs
FXC Super Bands versions and changelog
- 1.0011 Nov 2026Latest
- New: first release.
Before you download: installing FXC Super Bands
- A computer or a VPS. The MetaTrader phone apps can't run custom indicators.
- Allow DLL imports. The update check uses it. The chart template in the zip already has it on.
- In the zip: the MT4 and MT5 files and a chart template.
More help: How to install EAs and indicators in MT4 and MT5.
Download the zip and follow the guide. At the end, load the chart template FXC Super Bands.
Install guideFXC Super Bands reviews
Requests for FXC Super Bands
Vote on what we build for FXC Super Bands next, or add your own idea.
No requests for this one yet.
Adding a request takes a free account. We read every request first, so yours shows here once it's on the list.
An idea for a new indicator or EA? Ask on the roadmap
More dashboard tools

Ultra Trend Pro
Wedge Patterns