FXC Fibonacci Levels
A Fibonacci levels indicator that finds the trend's leg for you, and shows how deep the pullback has gone.
Card or PayPal. Your licence key shows on screen and comes by email.
- Use it on 5 MT4 or MT5 accounts
- MT4 and MT5 files on one licence
- Every update free
- 14-day refund, whichever way you pay
- Help within 24 hours, 24/7. Ask a question
- No sponsor messages on our free indicators
Fibonacci levels indicator
FXC Fibonacci Levels is a Fibonacci levels indicator for MT4 and MT5. It finds the trend's current leg on your chart, draws its retracement levels and the 127.2% and 161.8% targets, and shows how deep the pullback has gone.
The leg comes from swings measured in ATR, read on closed bars, so it follows the trend's real moves rather than the last small wiggle. When a closed bar makes a new high for an up leg (a new low for a down leg), the leg's end, its levels and its targets move with it. A close past the turn starts a new leg.
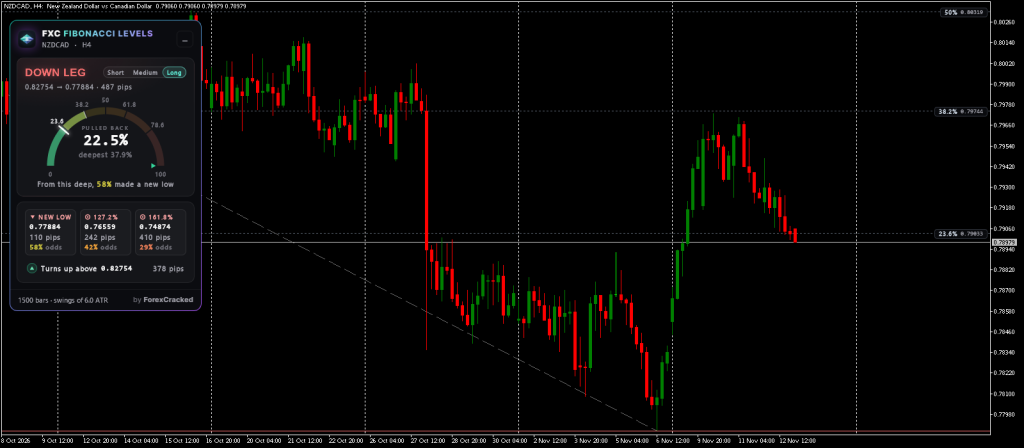
The dashboard shows the leg, a dial of how far price has pulled back and the deepest point so far, the new extreme and the two targets with their distances, and the close that would turn the trend. It draws levels. It doesn't place trades.
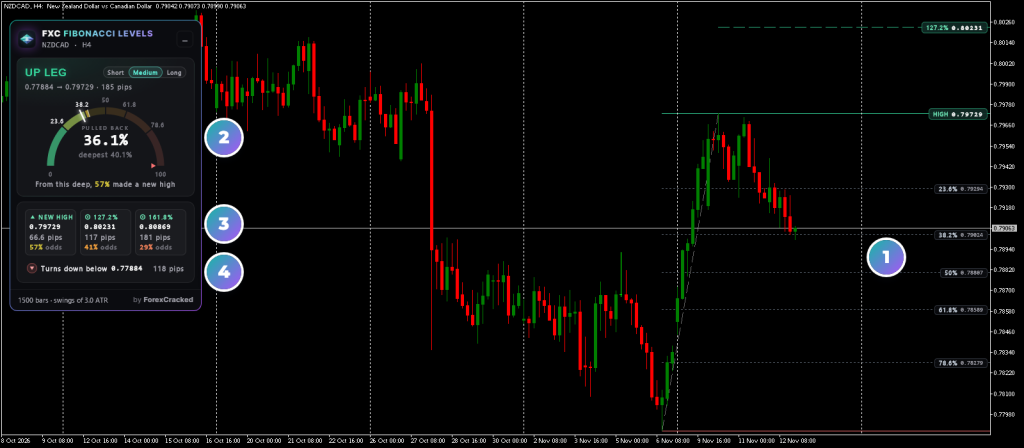
- 1The leg and its levelsThe leg dashed from its start to its high or low, and its retracement levels at the price scale.
- 2The pullback dialHow far price is back from the extreme, 0 to 100%, with the deepest point so far marked.
- 3The planThe new high or low, 127.2% and 161.8% of the leg, each with its price and distance.
- 4The turnThe last swing on the other side: a close past it turns the trend and starts a new leg.
Fibonacci levels indicator on real charts, every week
How to read the Fibonacci dashboard
The card at the top is this chart's leg. Every part has a tooltip with its prices and dates.
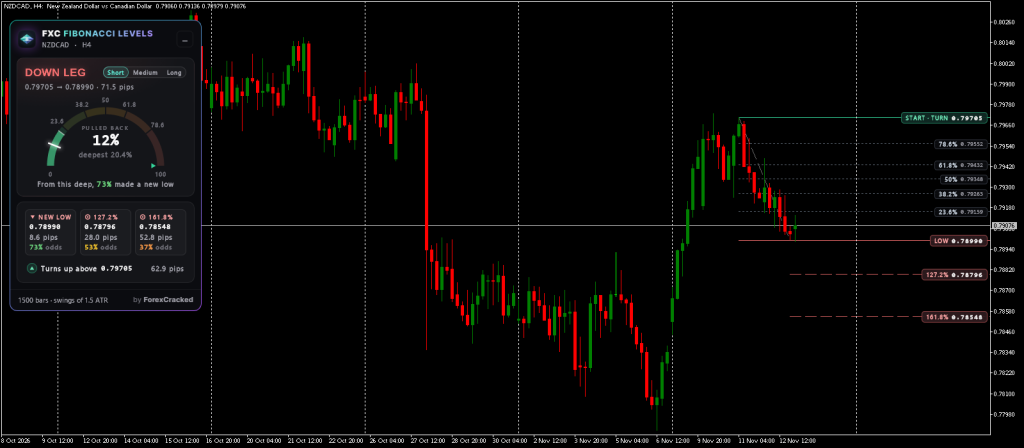
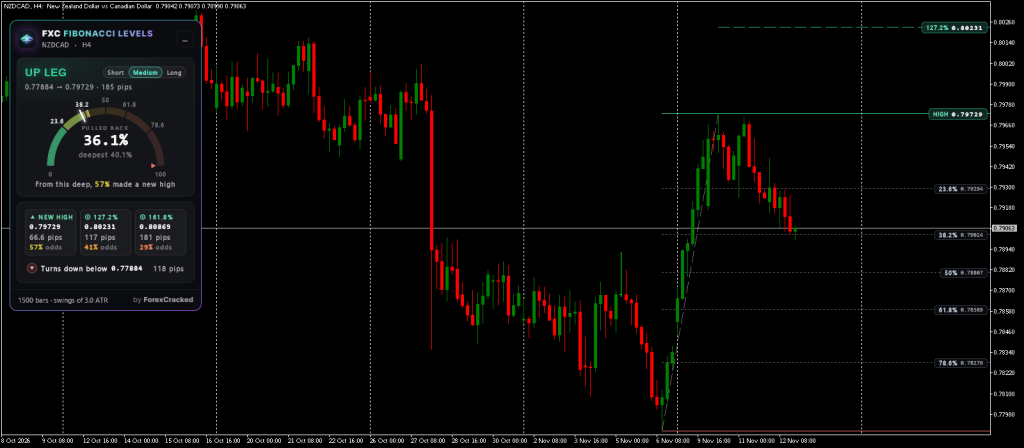
Short, Medium and Long swing sizes
One input, Swing Size, sets how far price must come back before a swing counts. The dashboard switches it on the chart. The same chart, three sizes:
How to use FXC Fibonacci Levels
From the trend's leg to the price that would turn it, on the chart you trade.
- 1Add it to your chart. It reads the last 1,500 closed bars of this chart, finds the swings and the trend, and draws the current leg with its levels.
- 2Read the leg. UP LEG or DOWN LEG on the dashboard, the leg's start and its high or low, and how many pips it covers. NO TREND means there's no leg to measure yet.
- 3Watch the pullback. The dial shows how far price is back from the extreme, the deepest point so far, and the levels it has passed. The same levels sit on the chart with their prices.
- 4Know both sides. The plan shows the new extreme and the 127.2% and 161.8% targets if the trend carries on, and the turn row the close that would end it. Switch Short, Medium or Long to read a smaller or bigger leg.
It measures the leg, not the future. The levels, the targets and the odds line are readings, not orders: the decision stays yours.
Fibonacci retracement features
The leg found for you
From swings of Swing Size x ATR(14) and the close that broke the last one. No tool to drag, no points to pick.
Retracements and targets
23.6, 38.2, 50, 61.8 and 78.6% on by default, 88.6% if you want it, and the 127.2% and 161.8% targets past the extreme.
The pullback dial
How far price has come back in the leg, the deepest point so far, and the levels marked on the track.
The turn line
The close that would turn the trend, with its price and distance, on the chart and on the dashboard.
Three swing sizes
Short, Medium and Long, switched from the dashboard on each chart. A changed Swing Size input wins over the last click.
Read on closed bars
The leg and its lines don't move while a bar forms. The dashboard's price, depth and deepest point follow the live bar.
FXC Fibonacci Levels: questions, inputs and versions
Questions about FXC Fibonacci Levels
Does it work on MT4 and MT5?
Yes. One licence gives you both files.
How many accounts can I use it on?
Five MT4 or MT5 accounts, demo or live. You can move a slot to a new account in My products.
Does it place trades for me?
No. It is an indicator. It shows you the picture, and you place the trade.
Do updates cost extra?
No. Every update is free, and the panel on your chart tells you when one is out.
What if it isn't for me?
Ask for a refund within 14 days of buying: ask us, or open a ticket from My products. No reason needed.
Do the Fibonacci levels move?
Not while a bar forms: the leg is read on closed bars. When a closed bar makes a new high for an up leg (a new low for a down leg), the leg's end, its levels and targets move with it. A close past the turn starts a new leg.
Where do the odds on the dashboard come from?
From one fixed table in the indicator, made from the developer's study of past pullbacks on 9 markets and three timeframes. They say how often past pullbacks this deep went on to a new high or low, not what this chart will do.
Can an EA read the levels?
No. FXC Fibonacci Levels draws chart lines, not buffers, and as a premium indicator a hidden copy inside an EA gets no licence. It's made for the chart.
Why does it need Allow DLL imports?
The licence check uses it. The chart template in the download turns it on. Without it, MetaTrader 5 won't start the indicator, and MetaTrader 4 shows an alert saying so.
Not answered here? We reply within 24 hours, 24/7.Ask us
FXC Fibonacci Levels inputs
FXC Fibonacci Levels versions and changelog
- 1.0115 Nov 2026Latest
- Changed: the licence check is updated; nothing changes on the chart.
- 1.0012 Nov 2026
- New: first release.
Before you buy: installing FXC Fibonacci Levels
- A computer or a VPS. The MetaTrader phone apps can't run custom indicators.
- Allow DLL imports. The licence check uses it. The chart template in the zip already has it on.
- In the zip: the MT4 and MT5 files and a chart template, on one licence.
More help: How to install EAs and indicators in MT4 and MT5, or open a support ticket.
Get the zip from your success screen or My products and follow the guide. At the end, load the chart template FXC Fibonacci Levels. Your licence key is already in it, so the panel shows Licence active.
Install guideMoving to a new VPS or broker? Free up a slot in My products first.
Stuck installing or activating? Open a support ticket and pick this product.
FXC Fibonacci Levels reviews
Requests for FXC Fibonacci Levels
Vote on what we build for FXC Fibonacci Levels next, or add your own idea.
No requests for this one yet.
Adding a request takes a free account. We read every request first, so yours shows here once it's on the list.
An idea for a new indicator or EA? Ask on the roadmap
More trend tools

Ultra Trend Pro
MA Crossovers