FXC Trend Radar
See which way each timeframe is trending, and how strong it is, in one panel.
MT4 and MT5 in one zip. No sign-up, the file downloads straight away.
- Use it on as many accounts as you like, demo or live
- Every update free, and your chart tells you when one is out
- Chart template in the zip, ready to load
What the forex dashboard shows
FXC Trend Radar is a free forex dashboard for MT4 and MT5. It reads the trend and its ADX strength on every timeframe you turn on, for your chart's pair, and lines them up on one multi-timeframe ladder.
A timeframe reads up or down only when its moving averages and its DI lines agree and its ADX is high enough. Anything else reads range, and the row says why.
It draws nothing on the chart and it does not place trades. The dashboard shows you the picture, and you decide.
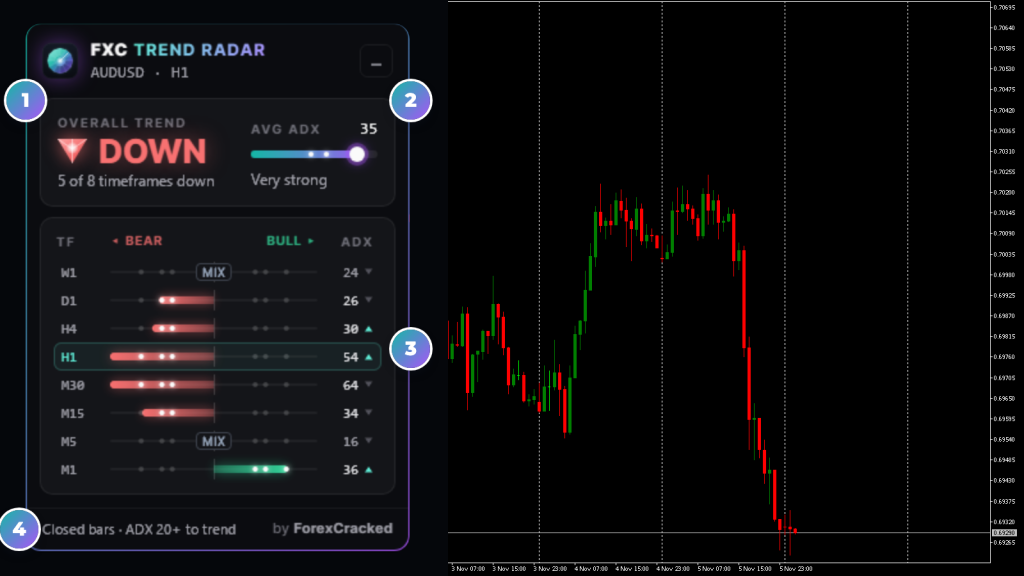
- 1Overall trendThe side with the most timeframes, and how many it has.
- 2Average ADXThe average strength across the timeframes, with its class and a slider.
- 3The ladderOne row per timeframe, highest first: a bar for direction and strength, and the ADX.
- 4The footerWhat decides every reading: closed or live bars, the ADX gate, the 200 SMA filter.
Forex dashboard on real charts, every week
How to read the trend dashboard
Each row of the ladder is one timeframe. Green runs right, red runs left, and a longer bar means a higher ADX. Every row has a tooltip with the numbers.
How to use FXC Trend Radar
Four steps, using an M15 chart as the example.
- 1Add it to the chart you trade. The dashboard reads that pair on every timeframe you have on, and edges your chart's timeframe in mint.
- 2Read the overall trend. UP or DOWN names the side with the most timeframes. A dash means no side leads.
- 3Check the timeframes above yours. On M15, look at H1 and H4. Bars on the same side as M15 mean those timeframes agree. A bar the other way, or a range pill, means they don't.
- 4Let an alert do the watching. Your chart's timeframe gives a popup when it changes direction. Turn on any other timeframe in its own settings.
It's a reading, not an entry signal. The dashboard shows where the timeframes stand. Your entry, stop and size stay your own call.
Default settings per timeframe
Each timeframe runs on its own moving averages, so a fast chart and a weekly chart aren't read with the same settings. Every value is an input you can change. All timeframes use ADX 14, with strength levels at 20, 25 and 35.
| Timeframe | Fast MA | Slow MA | At the start |
|---|---|---|---|
| M1 | EMA 10 | EMA 30 | On |
| M5 | EMA 12 | EMA 34 | On |
| M15 | EMA 20 | EMA 50 | On |
| M30 | EMA 21 | EMA 55 | On |
| H1 | EMA 34 | EMA 89 | On |
| H4 | EMA 50 | EMA 100 | On |
| D1 | SMA 50 | SMA 200 | On |
| W1 | SMA 50 | SMA 200 | On |
| MN1 | SMA 50 | SMA 200 | Off |
MT5's 12 extra timeframes start off. M2 and M3 use M1's averages, M4 and M6 use M5's, M10 and M12 use M15's, M20 uses M30's, H2 uses H1's, H3 and H6 use H4's, and H8 and H12 use D1's.
Multi-timeframe trend features
Every timeframe at once
A multi-timeframe dashboard with 8 timeframes on by default, M1 to W1. MT4 has 9 and MT5 has 21, and you turn each one on or off.
Two checks for direction
A fast and a slow moving average, and the +DI and -DI lines, have to agree.
Strength on every row
The bar's length is the ADX, with dots at the Moderate, Strong and Very strong levels, and a mark for rising or falling.
An ADX gate
Under the level you pick, a timeframe reads range, so weak trends don't count. It's on by default at 20, and it can be turned off.
Range says why
WEAK, MIX or BIAS on the row, so you know what's holding that timeframe back.
Settings per timeframe
Each timeframe has its own moving averages, ADX period and strength levels.
Does not repaint on closed bars
Closed bars are the default, so a row changes only when that timeframe's bar closes. Switch to live bars to read the bar that's forming.
Popup alerts
A popup when your chart's timeframe changes direction, or any timeframe you switch on.
FXC Trend Radar: questions, inputs and versions
Questions about FXC Trend Radar
Is it really free?
Yes. It is yours to keep, on MT4 and MT5.
Does it place trades for me?
No. It is an indicator. It shows you the picture, and you place the trade.
Do I need an account?
No. The download starts straight away. You need one to leave a review.
Does this dashboard scan other pairs?
No. It reads the chart's own symbol on every timeframe. For another pair, add it to that pair's chart.
Why does a row show a dash?
That timeframe doesn't have enough bars yet. A row needs its slow period plus 2 bars, so W1 needs 202 weeks at the defaults. On MT5 the dashboard asks for them, which can take a few minutes the first time on a pair.
Does it repaint?
Not on closed bars, the default: a row changes only when that timeframe's bar closes, and nothing is drawn on past bars. On live bars a row can change inside the bar, and the footer says Live bars.
Can an EA read it?
No. It has no buffers, so the readings live only in the panel.
FXC Trend Radar inputs
FXC Trend Radar versions and changelog
- 1.005 Nov 2026Latest
- New: first release.
Before you download: installing FXC Trend Radar
- A computer or a VPS. The MetaTrader phone apps can't run custom indicators.
- Allow DLL imports. The update check uses it. The chart template in the zip already has it on.
- In the zip: the MT4 and MT5 files and a chart template.
More help: How to install EAs and indicators in MT4 and MT5.
Download the zip and follow the guide. At the end, load the chart template FXC Trend Radar.
Install guideFXC Trend Radar reviews
Requests for FXC Trend Radar
Vote on what we build for FXC Trend Radar next, or add your own idea.
No requests for this one yet.
Adding a request takes a free account. We read every request first, so yours shows here once it's on the list.
An idea for a new indicator or EA? Ask on the roadmap
More trend tools
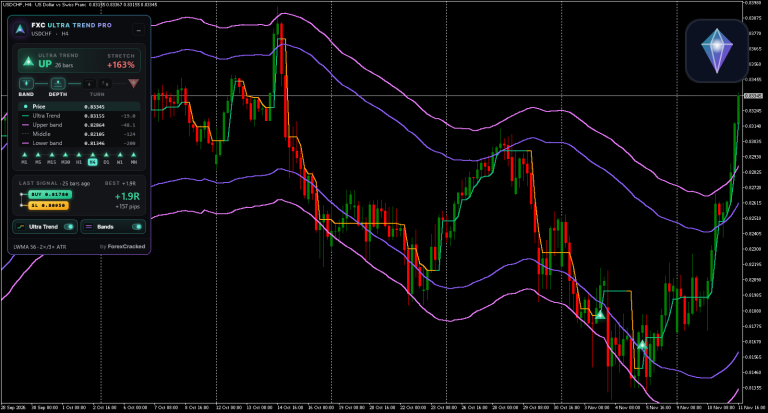

Ultra Trend Pro
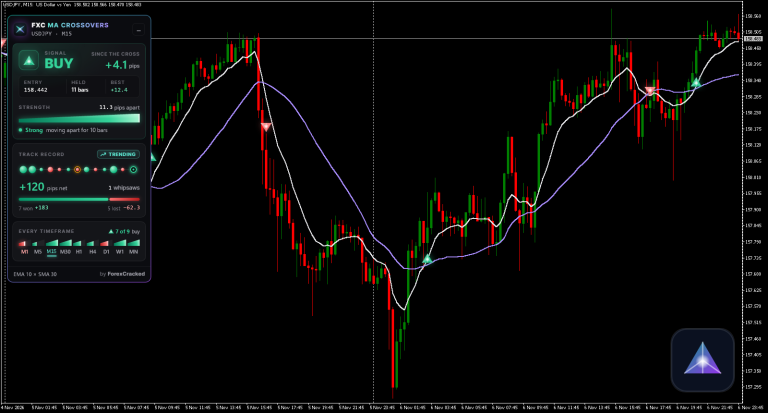
MA Crossovers