FXC Super RSI
See the RSI on every timeframe at once, each with its own settings.
MT4 and MT5 in one zip. No sign-up, the file downloads straight away.
- Use it on as many accounts as you like, demo or live
- Every update free, and your chart tells you when one is out
- Chart template in the zip, ready to load
A multi timeframe RSI in one panel
FXC Super RSI is a multi timeframe RSI indicator for MT4 and MT5. The RSI line sits in its own window and changes colour in each zone, and a panel on the chart shows the RSI on all nine timeframes, from M1 to monthly.
Each timeframe has its own settings. At the defaults the RSI period is 7 on M1, 21 on H1 and 50 on the monthly, with overbought at 70 and oversold at 30 on each, and you can change any of them. Move the chart to another timeframe and the line uses that timeframe's period.
The panel also shows how long RSI has held its zone, how far it moved since the last bar, and the two closes that would put this bar's RSI at overbought and oversold. It does not place trades. It shows you the reading, and you decide.
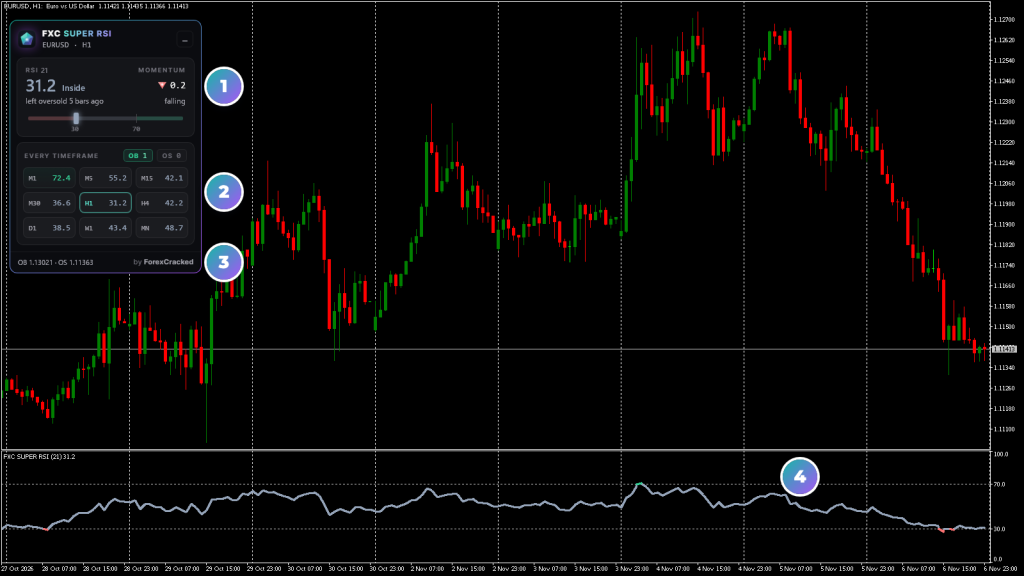
- 1The RSI nowThis timeframe's value, its zone, and how long it has been there.
- 2Every timeframeNine cells, each coloured by its own levels, and how many are overbought or oversold.
- 3The RSI lineGreen at or above overbought, red at or below oversold, slate between.
Multi timeframe rsi on real charts, every week
How to read the Super RSI panel
Read the top card first, then the timeframes. Hover a cell for its period and levels.
How to use FXC Super RSI
Four steps, on the chart you trade. The line and the top of the panel read that chart's timeframe, and the nine cells read every other one.
- 1Add it to your chart. The RSI line opens in its own window, and the panel sits on the main chart.
- 2Read this timeframe first. The big number is the RSI now, with its zone and how many bars it has held that zone.
- 3Look across the timeframes. Each cell is coloured by its own levels, and the two chips count how many are overbought and oversold.
- 4Watch for the amber line. RSI has crossed a level on this bar, and it counts down to the close. The alert comes then, if RSI is still across.
Overbought and oversold are readings, not signals. It places no trades, and the decision stays yours.
Multi timeframe RSI features
All nine timeframes at once
M1 to monthly on one panel, for the chart's own pair, so you don't have to flip through them.
A period for each timeframe
Each timeframe has its own RSI period and levels. The defaults run from 7 on M1 to 50 on the monthly, and all are yours to change.
A line that changes colour
Green at or above overbought, red at or below oversold, slate between, and the colour changes exactly on the level.
Overbought and oversold counts
Two chips count how many timeframes are in each zone, each by its own levels.
How long it has been there
The status counts the bars in the zone, or how long ago RSI left one, up to 1000 closed bars back.
The prices at the levels
The footer shows the two closes that would put this bar's RSI at overbought and oversold.
Alerts on closed bars
Entering overbought, oversold or neutral, once per closed bar. Popup by default, with sound, email and push as options.
Does not repaint on closed bars
Closed bars of the line and the alerts stay as they are. The live bar and the panel move until the bar closes, as any RSI does.
FXC Super RSI: questions, inputs and versions
Questions about FXC Super RSI
Is it really free?
Yes. It is yours to keep, on MT4 and MT5.
Does it place trades for me?
No. It is an indicator. It shows you the picture, and you place the trade.
Do I need an account?
No. The download starts straight away. You need one to leave a review.
Does it repaint?
Not on closed bars: the line's closed bars and the alerts stay as they are. The live bar and the panel move until the bar closes, as any RSI does, and each timeframe's cell reads that timeframe's own forming bar.
Why do the timeframes use different RSI periods?
Each timeframe has its own preset, from 7 on M1 to 50 on the monthly at the defaults. They're fixed inputs, not adaptive, so you can set any timeframe to any period, or all of them to 14.
Why does a timeframe show a dash?
It doesn't have enough bars yet: its RSI period plus 2. On MT5 the panel asks for them. The monthly cell needs 52 months at the default, so the first time on a pair it can take a while.
What are the two prices in the footer?
The closes that would put this bar's RSI exactly at overbought and at oversold. They're worked out from RSI's own averages through the last closed bar, and they move with each new bar.
FXC Super RSI inputs
FXC Super RSI versions and changelog
- 1.007 Nov 2026Latest
- New: first release.
Before you download: installing FXC Super RSI
- A computer or a VPS. The MetaTrader phone apps can't run custom indicators.
- Allow DLL imports. The update check uses it. The chart template in the zip already has it on.
- In the zip: the MT4 and MT5 files and a chart template.
More help: How to install EAs and indicators in MT4 and MT5.
Download the zip and follow the guide. At the end, load the chart template FXC Super RSI.
Install guideFXC Super RSI reviews
Requests for FXC Super RSI
Vote on what we build for FXC Super RSI next, or add your own idea.
No requests for this one yet.
Adding a request takes a free account. We read every request first, so yours shows here once it's on the list.
An idea for a new indicator or EA? Ask on the roadmap
More dashboard tools

Supply and Demand
RSI Flow