FXC Supply and Demand
Supply and demand zones on your chart, and a dashboard that shows where price sits between them.
MT4 and MT5 in one zip. No sign-up, the file downloads straight away.
- Use it on as many accounts as you like, demo or live
- Every update free, and your chart tells you when one is out
- Chart template in the zip, ready to load
The supply and demand zones indicator
FXC Supply and Demand is a free supply and demand zones indicator for MT4 and MT5. It draws the latest unbroken supply and demand zones on your chart and shows where price sits between them, in a dashboard and a pressure window.
Each zone starts at a big candle: a body bigger than the ATR at the default Zone Candle Size. The dashboard gives each level's price and distance in pips, whether price has come back to it, and the same reading on three more timeframes. It alerts when a bar closes with the pressure crossing 80, into supply, or 20, into demand.
It does not repaint on closed bars: once a bar closes, its reading is fixed, even when a zone breaks later. The forming bar's reading moves with the price until it closes. The zones on the chart are the current reading; when a close breaks one, the next bar draws the one that takes over. It does not place trades.
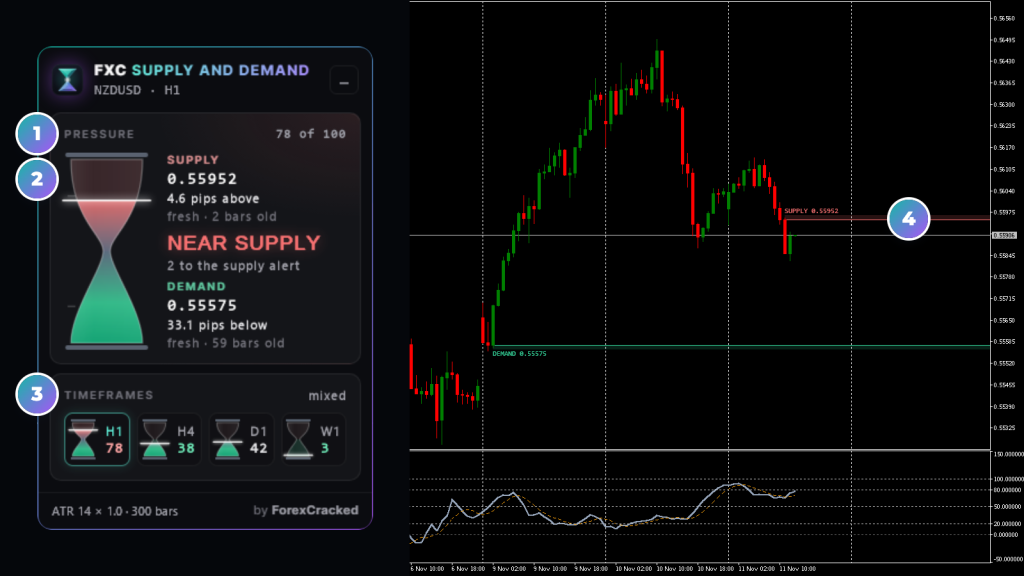
- 1The pressureWhere price sits between the demand level, 0, and the supply level, 100. The hourglass fills to it and the word names the band.
- 2Supply and demandEach level's price, its distance in pips, and whether the zone is fresh or tested, with its age in bars.
- 3The timeframes rowYour chart's timeframe and the three above it (H4 to MN on D1 and up), each with its own pressure, and how many agree.
- 4The zones on the chartThe red supply box and the green demand box, each with its level line and price tag.
Supply and demand zones indicator on real charts, every week
How it finds supply and demand zones
It looks back over Lookback History, 300 bars by default, for big candles: a body bigger than that bar's ATR times Zone Candle Size, 1.0 by default.
- Supply: a big red candle The most recent big red candle whose open no close has gone above since. That open is the supply level.
- Demand: a big green candle The most recent big green candle whose open no close has gone below since. That open is the demand level.
- Wicks test it, closes end it Price can wick into a zone and back: the dashboard counts each visit as a test. A close beyond the level ends the zone, and the next older one takes over.
No unbroken big candle in the lookback? The 50-bar high or low stands in, drawn fainter with a dashed line, and the dashboard marks it in amber.
Reading the supply and demand dashboard
The pressure says where price sits between the demand level, 0, and the supply level, 100, averaged over the last 3 bars by default. The hourglass fills to it, and the word beside it names the band.
- ABOVE SUPPLY100 and over. Past the supply level. A close above it ends the zone.
- AT SUPPLY80 to 100. The top fifth of the range. A bar closing into it sends the supply alert.
- NEAR SUPPLY60 to 80. Nearer supply than demand.
- MID-RANGE40 to 60. Around halfway between the two.
- NEAR DEMAND20 to 40. Nearer demand than supply.
- AT DEMAND0 to 20. The bottom fifth. A bar closing into it sends the demand alert.
- BELOW DEMAND0 and under. Past the demand level. A close below it ends the zone.
The timeframes row holds your chart's timeframe and the three above it (H4 to MN on D1 and up), each with its own pressure. When three or more read 60 and over, the caption counts them, such as 3 of 4 near supply; the same for demand at 40 and under; otherwise it says mixed.
Amber means price is past a level, or a 50-bar high or low is standing in for a missing zone.
How to use FXC Supply and Demand
Four steps, using a EURUSD H1 chart as the example.
- 1Add it to the chart you trade. The zones and the pressure are read on that chart's timeframe. On H1 the dashboard's row adds H4, D1 and W1.
- 2Find the two zones. The red box is supply and the green box is demand, each tagged with its price. The dashboard gives each level's distance in pips and whether price has come back to it since.
- 3Read the pressure. NEAR SUPPLY means it's 60 to 80: price sits nearer the supply level than the demand level. The row shows whether H4, D1 and W1 read the same way.
- 4Use the alerts. With Popup Alert on, the default, you get one alert when an H1 bar closes with the pressure crossing 80 into supply or 20 into demand.
It's a location, not an entry signal. It shows where price sits between the current zones. Your entry, stop and size stay your own call.
Zones, dashboard and alerts
The latest supply and demand zones
One supply and one demand, each from the most recent big candle whose open no close has gone beyond. Drawn as boxes, tagged with their price.
Where price sits between them
The pressure: 0 at the demand level, 100 at the supply level, averaged over the last 3 bars by default. An hourglass fills to it.
Four timeframes in one row
Your chart's timeframe and the three above it (H4 to MN on D1 and up), each the same reading on its own bars, and how many agree.
Fresh or tested
Each zone's distance in pips, its age in bars, and how many times price has come back to it since.
A pressure window
Under the chart: the pressure as a slate line and its 5-bar average as a dotted amber signal line, with levels at 0, 20, 50, 80 and 100.
Alerts on the close
When a bar closes with the pressure crossing 80 into supply or 20 into demand. Popup, sound, email or push.
Fixed on closed bars
Does not repaint on closed bars: a closed bar's reading stays, even when a zone breaks later. The forming bar moves with the price.
Four zone and pressure settings
ATR Period, Zone Candle Size, Lookback History and Pressure Smoothing set what counts as a zone and how smooth the pressure is.
FXC Supply and Demand: questions, inputs and versions
Questions about FXC Supply and Demand
Is it really free?
Yes. It is yours to keep, on MT4 and MT5.
Does it place trades for me?
No. It is an indicator. It shows you the picture, and you place the trade.
Do I need an account?
No. The download starts straight away. You need one to leave a review.
Does this supply and demand indicator repaint?
Not on closed bars. Once a bar closes its pressure is fixed, and a zone broken later doesn't change it. The forming bar's reading moves with the price until it closes. The zones on the chart are the current reading: when a close breaks one, the next bar draws the zone that takes over.
Why did a zone disappear or move?
A bar closed beyond it. Only closes end a zone; wicks into it count as tests. The next bar draws the next older unbroken big candle on that side, or the 50-bar high or low when there is none within Lookback History.
Does it give buy or sell signals?
No. It has no arrows. It shows where price sits between the current supply and demand zones, and alerts when a bar closes with the pressure crossing 80 or 20.
Can an EA read the zones?
An EA can read the pressure (buffer 0) and its signal line (buffer 1) through iCustom. The supply and demand prices are in no buffer, so an EA can't read the levels themselves.
FXC Supply and Demand inputs
FXC Supply and Demand versions and changelog
- 1.0011 Nov 2026Latest
- New: first release.
Before you download: installing FXC Supply and Demand
- A computer or a VPS. The MetaTrader phone apps can't run custom indicators.
- Allow DLL imports. The update check uses it. The chart template in the zip already has it on.
- In the zip: the MT4 and MT5 files and a chart template.
More help: How to install EAs and indicators in MT4 and MT5.
Download the zip and follow the guide. At the end, load the chart template FXC Supply and Demand.
Install guideFXC Supply and Demand reviews
Requests for FXC Supply and Demand
Vote on what we build for FXC Supply and Demand next, or add your own idea.
No requests for this one yet.
Adding a request takes a free account. We read every request first, so yours shows here once it's on the list.
An idea for a new indicator or EA? Ask on the roadmap
More dashboard tools

London Breakout
Pivot Points