FXC Pivot Points
An automatic pivot point calculator for MT4 and MT5 that shows where price sits against every level.
MT4 and MT5 in one zip. No sign-up, the file downloads straight away.
- Use it on as many accounts as you like, demo or live
- Every update free, and your chart tells you when one is out
- Chart template in the zip, ready to load
The pivot point calculator on your chart
FXC Pivot Points is a free pivot point calculator for MT4 and MT5. It works out the day's, week's or month's pivot levels from the last period's high, low and close, draws them on your chart, and shows where price sits against each one.
Pick Classic, Fibonacci, Woodie or Camarilla. The panel shows whether price is above or below the pivot, the nearest level each way, and how many of the last 20 periods reached each level on this chart.
The levels are set when the period opens and stay until the next one. It has optional alerts, gives the levels to EAs, and does not place trades.
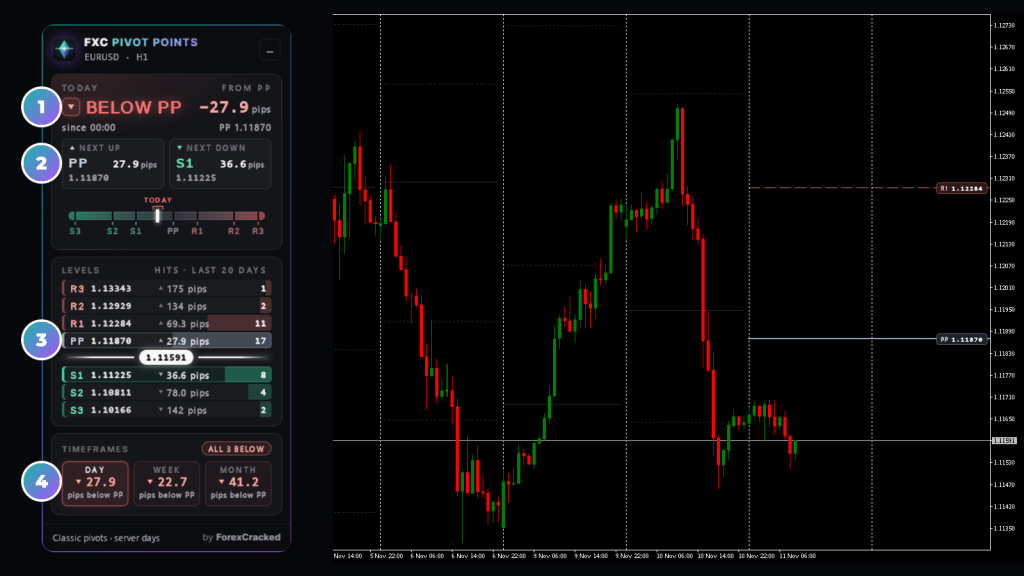
- 1Above or below the pivotABOVE PP or BELOW PP, the distance in pips, and since when price has stayed on that side.
- 2The nearest level each wayThe nearest level above and below price, with its distance and its price.
- 3The levels and their hitsEvery level in price order, with how many of the last 20 periods reached it on this chart.
- 4Day, week and monthThe daily, weekly and monthly pivots. Click one to show those levels on the chart.
Pivot point calculator on real charts, every week
Classic, Fibonacci, Woodie, Camarilla
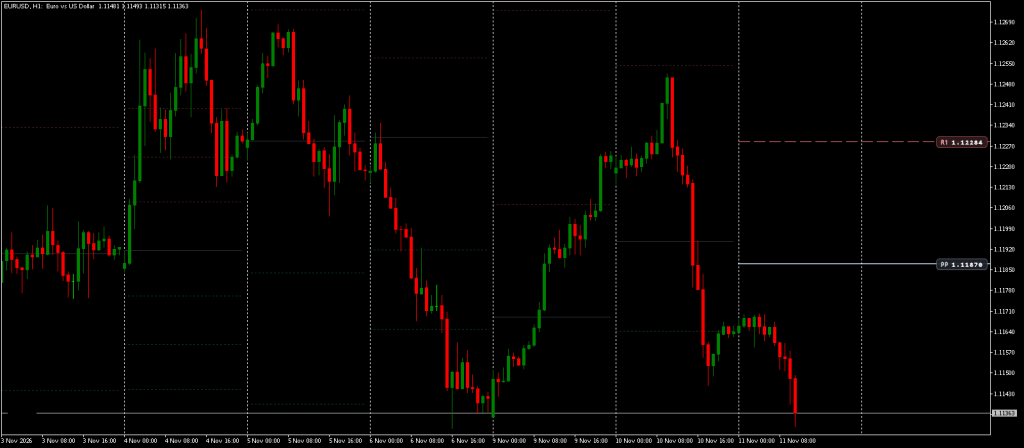
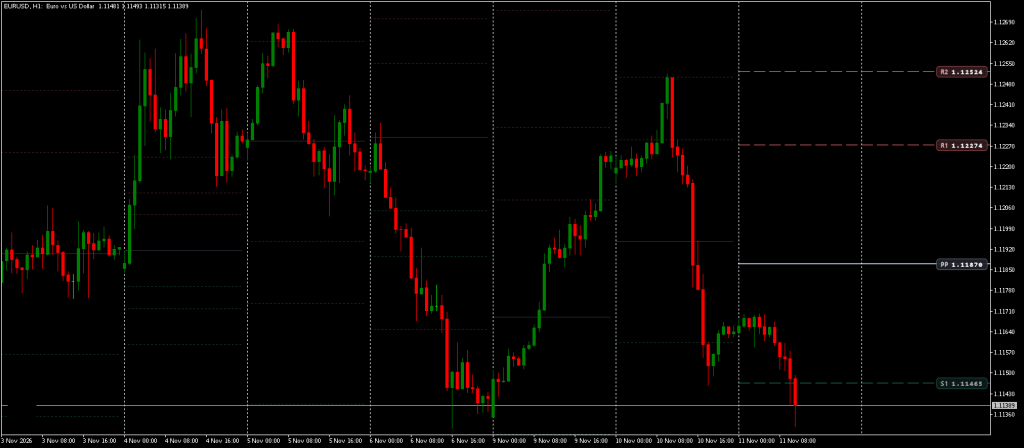
One input, Calculation Method, picks the formula. The same EURUSD H1 chart, its levels worked out four ways.
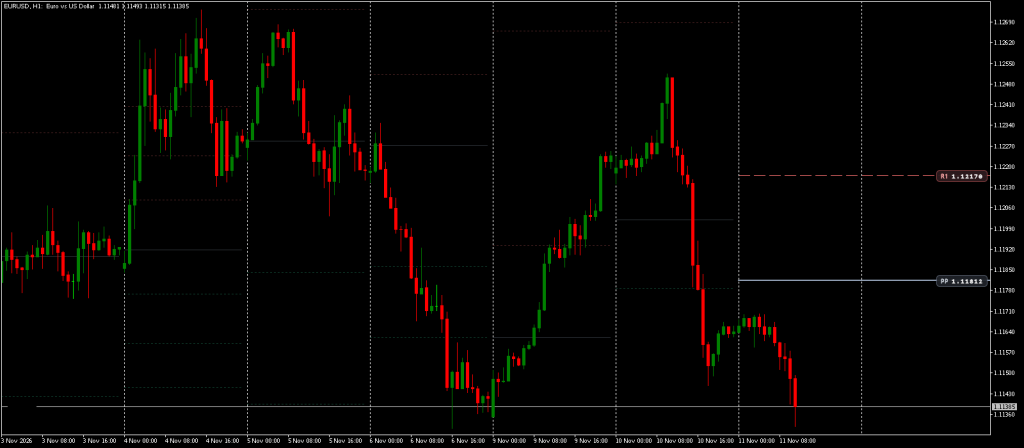
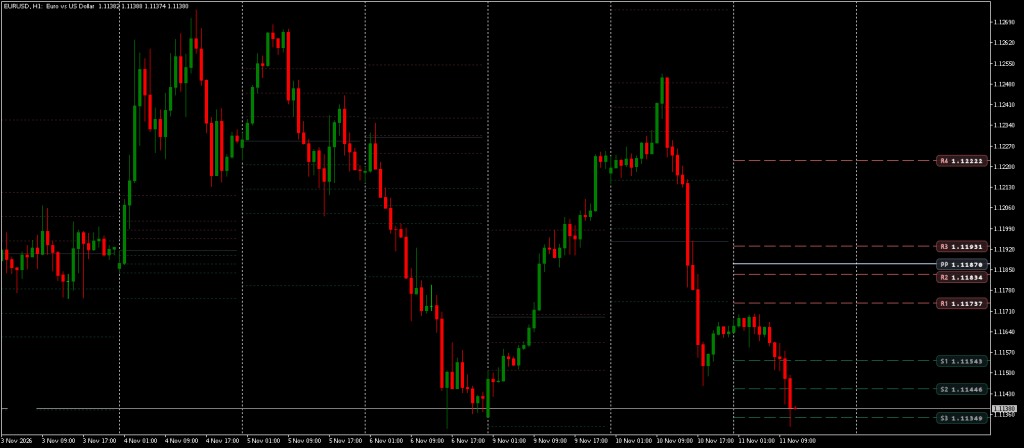
How to read the pivot panel
The panel reads the live price against this period's levels. Every part has a tooltip with the prices.
The pivot point formulas
H, L and C are the last complete day's high, low and close (the week's or month's with weekly or monthly pivots). The levels are worked out once, when the period opens.
| Method | Pivot (PP) | Levels |
|---|---|---|
| Classic | (H + L + C) / 3 | R1 = 2PP − L, S1 = 2PP − H R2, S2 = PP ± (H − L) R3 = H + 2(PP − L), S3 = L − 2(H − PP) |
| Fibonacci | (H + L + C) / 3 | R1 to R3, S1 to S3 = PP ± 0.382, 0.618 and 1.0 × (H − L) |
| Woodie | (H + L + 2C) / 4 | Classic's formulas, from this PP |
| Camarilla | (H + L + C) / 3 | R1 to R4, S1 to S4 = C ± (H − L) × 1.1/12, 1.1/6, 1.1/4 and 1.1/2 |
Camarilla's levels sit around the close, not the pivot, so its PP can fall between other levels. The panel always lists them by price.
How to use FXC Pivot Points
Four steps, using a EURUSD H1 chart with the daily Classic pivots as the example.
- 1Add it to the chart you trade. On Auto the period follows the timeframe: the day's pivots on M15 or H1, the week's on H4, the month's on D1. Or set Pivot Period yourself.
- 2Read the top of the panel. ABOVE PP or BELOW PP says which side of the day's pivot price is on, how many pips away, and since when.
- 3Look at the nearest level each way. NEXT UP and NEXT DOWN name the nearest levels, R1 and S1 for example, with their distance and price. Point at one to light its line on the chart.
- 4Check the hits. Each row counts how many of the last 20 days reached that level on this chart. Click WEEK or MONTH to see the weekly or monthly pivots the same way.
The levels are a ruler, not an entry signal. They show where the day's pivot levels are and how often price reached them. Your entry, stop and size stay your own call.
Pivot levels, panel and alerts
Four pivot methods
Classic, Fibonacci, Woodie or Camarilla, from the last period's high, low and close. Camarilla adds R4 and S4.
Day, week or month
Auto picks the period from your chart's timeframe, or choose one. A period shorter than the chart's candles steps up.
Every level with its price
Each level drawn from the period's start, with its name and price at the right edge of the chart. Past periods sit faint behind.
Hits over 20 periods
How many of the last 20 days, weeks or months reached each level on this chart. It counts reaching a level, not holding it.
Click a timeframe
Click DAY, WEEK or MONTH in the panel to show those pivots on the chart and in the panel.
Your broker's day
A short Sunday candle counts as Monday, and Day Starts At can begin each day at the New York close.
Touch and cross alerts
The first touch of each level, or a bar closing across the pivot. Popup, sound, email or push. Both are off until you turn them on.
Levels for EAs
Nine hidden buffers hold PP, R1 to R3, S1 to S3 and Camarilla's R4 and S4, for an EA to read.
FXC Pivot Points: questions, inputs and versions
Questions about FXC Pivot Points
Is it really free?
Yes. It is yours to keep, on MT4 and MT5.
Does it place trades for me?
No. It is an indicator. It shows you the picture, and you place the trade.
Do I need an account?
No. The download starts straight away. You need one to leave a review.
Do the pivot levels change during the day?
No. They are worked out from the last day's high, low and close when the day opens and stay until the next day, as long as the broker's history for that day doesn't change. The panel's distances move with price.
Which period does Auto use?
On MT4: the day's pivots up to H1, the week's on H4, the month's on D1 and above. On MT5: daily up to H3, weekly up to H8, monthly above.
Can an EA read the pivot levels?
Yes, through iCustom. Buffer 0 is PP, 1 to 3 are R1 to R3, 4 to 6 are S1 to S3, and 7 and 8 are Camarilla's R4 and S4. They follow the Pivot Period input, not a clicked tab.
My broker's days start at midnight GMT. What should I set?
Day Starts At 22 (21 in summer) starts each day at the New York close. At 0 it uses the broker's own days, with a short Sunday candle counted as Monday.
FXC Pivot Points inputs
FXC Pivot Points versions and changelog
- 1.0010 Nov 2026Latest
- New: first release.
Before you download: installing FXC Pivot Points
- A computer or a VPS. The MetaTrader phone apps can't run custom indicators.
- Allow DLL imports. The update check uses it. The chart template in the zip already has it on.
- In the zip: the MT4 and MT5 files and a chart template.
More help: How to install EAs and indicators in MT4 and MT5.
Download the zip and follow the guide. At the end, load the chart template FXC Pivot Points.
Install guideFXC Pivot Points reviews
Requests for FXC Pivot Points
Vote on what we build for FXC Pivot Points next, or add your own idea.
No requests for this one yet.
Adding a request takes a free account. We read every request first, so yours shows here once it's on the list.
An idea for a new indicator or EA? Ask on the roadmap
More dashboard tools

London Breakout
Supply and Demand