
Key Takeaways
- The Solar Wind Joy Histogram indicator is a trend-following oscillator for MT4 and MT5 that detects trend direction and potential reversal zones using color-coded histogram bars.
- Green histogram bars above the zero line indicate bullish momentum; red bars below indicate bearish momentum.
- A golden signal line appears at inflection points, providing an early warning of a potential trend direction change before the histogram fully reverses.
- Best results come from combining the golden signal line with price action confluence (e.g., bullish/bearish engulfing patterns) to filter false signals.
- Works on all timeframes and all instruments — suitable for scalpers (M5–M15), day traders (H1), and swing traders (H4–D1).
Table of Contents
Introduction: Catch Trend Reversals Before They Happen
Identifying when a trend is about to reverse is the holy grail of forex trading — and one of the hardest things to get right. Most traders either enter too late after the reversal is already underway, or jump in too early and get stopped out by the final push of the dying trend.
The Solar Wind Joy Histogram indicator for MT4 and MT5 tackles this exact problem. It uses a momentum-tracking algorithm that analyzes past price action data to pinpoint potential trend reversal zones — and presents the information through clean, color-coded histogram bars and a golden signal line that makes reading the market almost effortless.
We tested the Solar Wind Joy Histogram indicator across multiple currency pairs and timeframes, from M15 scalping setups to H4 swing trades, and found it delivers reliable trend direction signals with clear reversal warnings. Available for both MetaTrader 4 and MetaTrader 5, here is our complete review, a practical trading strategy, and free download links.
What Is the Solar Wind Joy Histogram Indicator?
The Solar Wind Joy Histogram indicator is a trend-following oscillator that displays in a separate window below your price chart. Its core algorithm processes historical price action data to determine the current market trend and, more importantly, to flag moments when that trend is likely to change direction.
The indicator consists of three visual components:
- Lime Green Histogram Bars — Appear when the market is in a bullish (upward) trend. The taller the bars, the stronger the bullish momentum.
- Red Histogram Bars — Appear when the market is in a bearish (downward) trend. Deeper bars indicate stronger bearish pressure.
- Golden Signal Line — A short gold-colored line that appears at inflection points, signaling a potential change in trend direction. This is the early warning signal.
- Zero Line — The dividing line between bullish and bearish territories. Histogram bars above zero indicate bullish bias; bars below zero indicate bearish bias.
Unlike many histogram indicators that simply lag behind price, the Solar Wind Joy Histogram indicator’s golden signal line provides an early warning before the full color change occurs — giving traders time to prepare for the reversal rather than chasing it.
Solar Wind Joy Histogram vs. MACD Histogram — Comparison
| Feature | Solar Wind Joy Histogram | MACD Histogram |
|---|---|---|
| Signal Type | Color-coded bars + golden signal line | Histogram bars + signal line crossover |
| Trend Detection | Visual color change (green/red) | Above/below zero line |
| Reversal Warning | Golden line appears before reversal | Signal line crossover (slightly delayed) |
| Ease of Reading | Very easy — instant color recognition | Moderate — requires crossover interpretation |
| Best Timeframes | All timeframes (M1–MN1) | H1 and above |
| False Signal Rate | Low to moderate (use with confluence) | Moderate |
| Repaint | No | No |
While the MACD indicator remains the industry standard for momentum analysis, the Solar Wind Joy Histogram indicator offers a more visually intuitive approach with its color system and dedicated golden reversal line. For traders who struggle to quickly interpret MACD crossovers, the Solar Wind Joy Histogram indicator provides a faster read.
Review: Pros and Cons
✅ PROS
- Clear, color-coded visual signals — no ambiguity in reading trend direction
- Golden signal line provides early reversal warnings before the histogram fully changes
- Works across all timeframes — effective for scalping (M5/M15), day trading (H1), and swing trading (H4/D1)
- Available for both MT4 and MT5 platforms
- Suitable for all experience levels — novice, intermediate, and advanced traders
- Does not repaint — signals are final once the bar closes
- Compatible with all currency pairs, gold (XAUUSD), indices, and crypto
❌ CONS
- Performs best in trending markets — can generate false signals during sideways/ranging conditions
- Should not be used as a standalone indicator — always combine with price action or another confirmation tool
- Golden signal line can occasionally trigger during minor retracements, not true reversals
- No built-in alert system for push notifications (manual monitoring required on default version)
The Strategy: How to Trade with the Solar Wind Joy Histogram Indicator
Here is a complete trading strategy using the Solar Wind Joy Histogram indicator with price action confluence for higher-probability setups.
Buy (Long) Setup
- Trend Confirmation: The Solar Wind Joy Histogram bars are green and positioned above the zero line, confirming bullish momentum.
- Reversal Signal: After a bearish pullback (red bars), the golden signal line appears, indicating a potential shift back to bullish.
- Price Action Confluence: Wait for a bullish candlestick pattern on the price chart — a bullish engulfing, pin bar, or hammer — coinciding with the golden signal line.
- Entry: Enter long on the close of the confirmation candle.
- Stop Loss: Place SL below the most recent swing low, or 10–20 pips below the entry candle (pair-dependent).
- Take Profit: Target the nearest resistance level or use a 1:1.5 to 1:2 risk-to-reward ratio.
Sell (Short) Setup
- Trend Confirmation: The Solar Wind Joy Histogram bars are red and positioned below the zero line, confirming bearish momentum.
- Reversal Signal: After a bullish retracement (green bars), the golden signal line appears, indicating a potential shift back to bearish.
- Price Action Confluence: Wait for a bearish candlestick pattern — bearish engulfing, shooting star, or evening star — coinciding with the golden signal line.
- Entry: Enter short on the close of the confirmation candle.
- Stop Loss: Place SL above the most recent swing high, or 10–20 pips above the entry candle.
- Take Profit: Target the nearest support level or use a 1:1.5 to 1:2 risk-to-reward ratio.


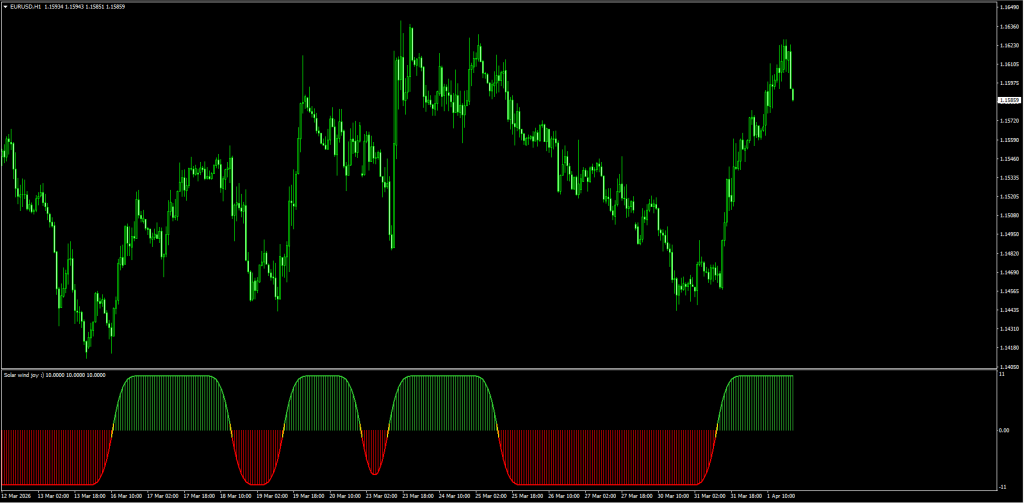
Trading Example
In the chart example below, the Solar Wind Joy Histogram indicator is applied to EURUSD on the H1 timeframe. The green histogram bars confirm an uptrend, and after a brief pullback where the bars turned red, the golden signal line appears — coinciding with a bullish engulfing candlestick pattern on the price chart. This double confluence of the Solar Wind Joy Histogram indicator’s golden line and the price action reversal pattern confirms a high-probability long entry.
Best Practices
For optimal results with the Solar Wind Joy Histogram indicator, combine it with:
- Bollinger Bands to identify volatility squeezes and breakout zones
- RSI or Stochastic for additional overbought/oversold confirmation
- Fibonacci retracement levels to pinpoint optimal entry zones during pullbacks
- Higher timeframe analysis to ensure your trades align with the dominant trend direction
Indicator Settings
| Parameter | Default | Scalping (M5–M15) | Swing (H4–D1) |
|---|---|---|---|
| Period | 10 | 8 | 15–20 |
| Smooth | 10 | 6 | 14 |
| Do Alert | false | true | true |
| Alert Mail | false | false | true |
- Lower Period + Lower Smooth = More sensitive signals, faster response — ideal for scalping but increases false signals.
- Higher Period + Higher Smooth = Smoother output, fewer signals — ideal for swing trading with higher accuracy per signal.
How to Install the Solar Wind Joy Histogram Indicator (MT4 & MT5)
Installing the Solar Wind Joy Histogram indicator follows the standard MetaTrader indicator process:
- Download the
.ex4(MT4) or.ex5(MT5) file from the links below. - Open your MetaTrader platform and navigate to File → Open Data Folder.
- Go to MQL4 → Indicators (MT4) or MQL5 → Indicators (MT5).
- Copy the downloaded file into the Indicators folder.
- Restart MetaTrader or refresh the Navigator panel.
- Drag the Solar Wind Joy Histogram indicator onto any chart from the Navigator panel.
For a detailed step-by-step guide with screenshots, see our full How to Install Indicators & EAs in MT4/MT5 tutorial.
Key Features
- Trend Direction Detection — Instantly identifies bullish or bearish bias through color-coded histogram bars (green = bullish, red = bearish).
- Early Reversal Warning — Golden signal line appears before the full trend change, providing advance notice to prepare entries.
- Zero Line Reference — Clean trend bias separation — bars above/below zero for quick directional reading.
- All Timeframes — Works from M1 to Monthly charts. Scalpers, day traders, and swing traders can all benefit.
- All Instruments — Forex pairs, gold, indices, stocks, and crypto.
- Non-Repaint — Completed bar signals do not change retroactively.
- Both MT4 and MT5 — Download for either MetaTrader platform.
- Customizable Settings — Adjustable period, smoothing, and alert parameters to suit any trading style.
The Solar Wind Joy Histogram indicator can be used on any Forex currency pair and other assets such as stocks, commodities, cryptos, precious metals, oil, and gas. It can be applied on any timeframe from 1-minute to Monthly charts. Practicing on an MT4 demo account is highly recommended before going live.
Frequently Asked Questions
Download Solar Wind Joy Histogram Indicator
Solar Wind Joy Histogram Indicator
The Solar Wind Joy Histogram indicator for MT4 & MT5 detects trend reversals with color-coded histogram bars and a golden signal line.
✓ Pros
- Clear, color-coded visual signals
- early reversal warnings
- Works across all timeframes
- MT4 and MT5 platforms
- Suitable for all experience levels
- Does not repaint
- Compatible with all currency pairs
✗ Cons
- Performs best in trending markets
- Should not be used as a standalone indicator
- occasionally trigger during minor retracements
- No built-in alert system for push notifications
Summary
The Solar Wind Joy Histogram indicator earns a solid place in any MetaTrader trader's toolkit. Its clean, color-coded histogram combined with the early-warning golden signal line makes trend direction and reversal detection straightforward — even for traders who are new to technical indicators.
Mirror Link: Alternative Download
Final Verdict
The Solar Wind Joy Histogram indicator earns a solid place in any MetaTrader trader’s toolkit. Its clean, color-coded histogram combined with the early-warning golden signal line makes trend direction and reversal detection straightforward — even for traders who are new to technical indicators.
Where it truly shines is in trending markets, where the green/red histogram bars accurately track momentum direction and the golden line provides timely heads-up before reversals materialize. In ranging markets, however, the signal reliability drops, which is why we strongly recommend using it alongside price action analysis or complementary tools like Bollinger Bands or the Stochastic oscillator.
The Solar Wind Joy Histogram indicator is recommended for novice, intermediate, and advanced forex traders alike. It is equally effective for scalpers (M5–M15), day traders (M30–H1), and swing traders (H4–D1). Download it free for MT4 and MT5 below.
This indicator pairs well with indicators from our Top 10 Best Free MT4 Indicators — read the full comparison with expert reviews and trading strategies.