FXC Boll Bands Trader
Arrows at the Bollinger Bands, and a panel that shows what's holding the next one back.
MT4 and MT5 in one zip. No sign-up, the file downloads straight away.
- Use it on as many accounts as you like, demo or live
- Every update free, and your chart tells you when one is out
- Chart template in the zip, ready to load
Bollinger Bands and RSI in one indicator
FXC Boll Bands Trader combines Bollinger Bands and RSI: it draws the bands at 2 and 3 deviations and prints an arrow when a closed bar reaches a band and the RSI, trend and squeeze filters let it. Each arrow has a stop and two targets.
A dashboard on the chart shows where price sits in the bands, how far the next arrow is, and which filter is stopping it, so you can see why a bar at the band printed nothing.
It does not place trades. It shows you the picture, and you decide.
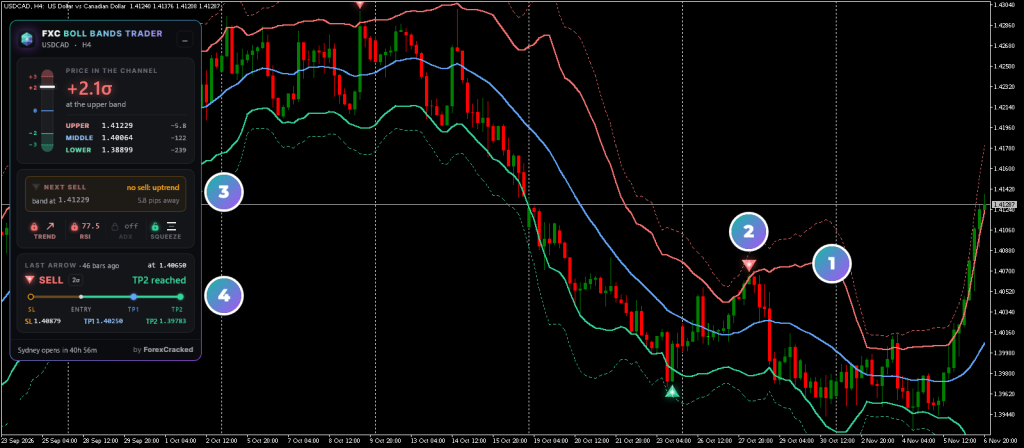
- 1The bandsRose above, green below, blue in the middle, and dotted at 3 deviations.
- 2The arrowOn the closed bar that reached a band, with every filter letting it through.
- 3Next buy or sellThe nearest band, how far it is, and what would stop an arrow there.
- 4Last arrowIts entry, stop and two targets, and how far it has gone.
Bollinger bands and rsi on real charts, every week
Touch or rejection at the band
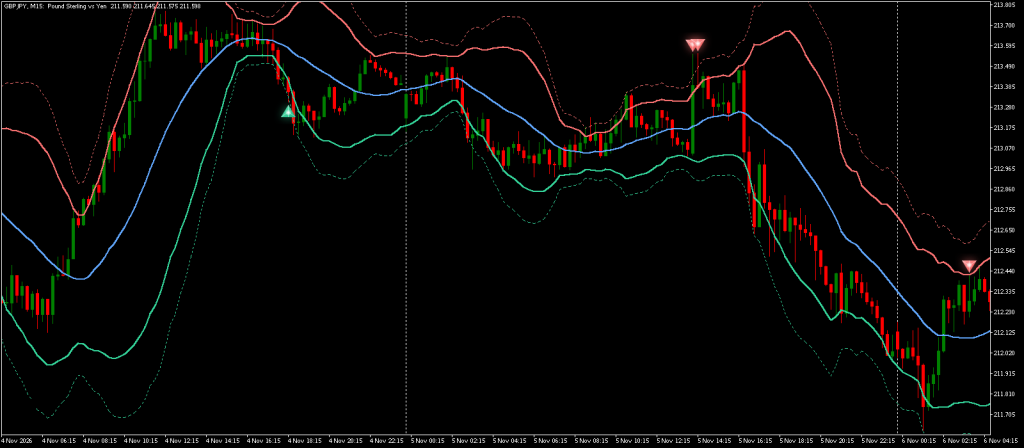
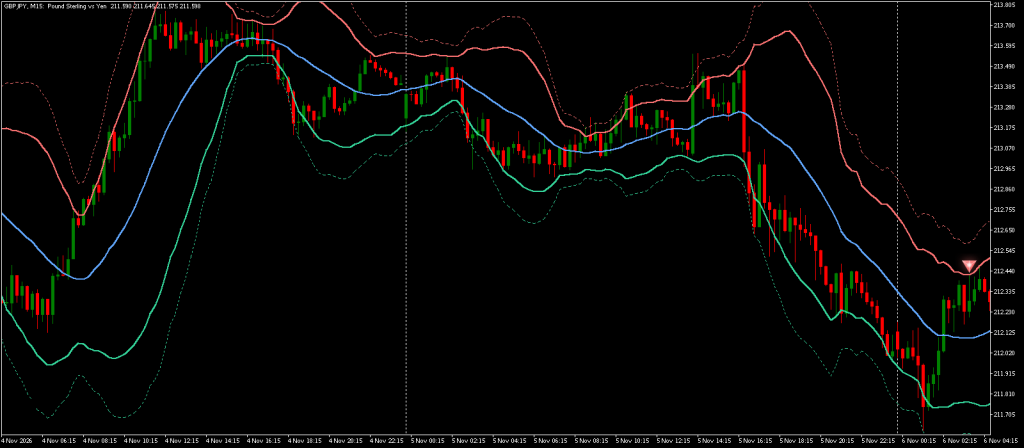
One input, Signal Trigger Mode, decides what counts as reaching a band. These are the same GBPJPY M15 bars with that one setting changed.
How to read the Boll Bands Trader panel
The top of the panel says where price is, the tile says what happens next, and the locks say which filter decides it.
How to use FXC Boll Bands Trader
Five steps, on the chart you trade. It reads only that chart's timeframe.
- 1Add it to your chart. The Bollinger Bands appear with the dashboard top left. RSI, trend and squeeze filters are on, ADX is off.
- 2Read the next arrow tile. It shows the nearest band, how far it is, and which filter would stop an arrow there.
- 3When an arrow prints, the entry is that bar's close. Click the arrow to show the entry, stop, TP1 and TP2 on the chart for 8 seconds.
- 4If price stretches further, a bar at the 3 deviation band prints the add-on arrow, with a new stop for the trade.
- 5The trade ends at the middle band or the stop. After the cooldown the next arrow can print. The last arrow card keeps following it on to TP2.
These are levels to read. It places no trades, so the decision stays yours.
What stops a Bollinger Bands arrow
A bar can reach a band and print nothing, so arrows are few: about one per 80 bars at the defaults, on the 40 charts we counted. These are the rules that hold one back, and each can be changed in the inputs.
| Filter | Default | An arrow waits while |
|---|---|---|
| RSI | On, 30 and 70 | RSI 14 is at or past the level on the arrow's side |
| Trend | On | EMA 50, RSI 14 and MACD all point against it |
| Squeeze | On, 20% | the bands are in the narrowest 20% of the last 120 bars |
| ADX | Off | ADX 14 is under 20 |
| Room to TP1 | On, 0.25 | the middle band is under a quarter of the stop's distance away |
An open trade holds arrows back too. While one runs, the only arrow is its add-on, and that asks ADX alone. A cooldown follows each trade.
Bollinger Bands and RSI features
Two sets of Bollinger Bands
Bands at 2 and 3 deviations, the sell side in rose and the buy side in green, so the chart reads the way the arrows do.
RSI, trend and squeeze filters
Each can be changed or turned off. There's an ADX filter too, off by default, and a rule that keeps TP1 far enough from the entry for the stop.
A stop and two targets on each arrow
The stop sits beyond the last swing plus 1 ATR. TP1 is the middle band, TP2 the opposite band. Click an arrow to see them on the chart.
A dashboard for the next arrow
Price in deviations, how far each band is, the nearest band and what's stopping the arrow, with the last arrow's stop and targets.
Arrows on closed bars
Does not repaint on closed bars: an arrow is decided when its bar closes. The bands and the dashboard read the live bar, so they move until then.
Alerts with the whole trade
One alert per arrow when its bar closes, by popup, sound, email or push, with the entry, stop and both targets.
FXC Boll Bands Trader: questions, inputs and versions
Questions about FXC Boll Bands Trader
Is it really free?
Yes. It is yours to keep, on MT4 and MT5.
Does it place trades for me?
No. It is an indicator. It shows you the picture, and you place the trade.
Do I need an account?
No. The download starts straight away. You need one to leave a review.
Do the arrows repaint?
Not on closed bars, at the default ZigZag Backstep: an arrow is decided once, when its bar closes. The bands and the panel read the live bar, so "prints at the close" can fall away before then. A reload works the arrows out again from your chart's bars: on the 40 charts we checked, none moved.
Why did a bar touch the band with no arrow?
A filter stopped it, a trade was still open, or the cooldown was running. While the bar is live, the panel's next arrow tile names the reason.
Can I use only the extreme 3 deviation arrows?
No. The extreme arrow is an add-on to a standard arrow's open trade, so it needs Entry 1 on. With Entry 1 off, no arrows print.
Can an EA read the arrows?
Yes. Buffers 3 and 4 hold the entry on an arrow bar, and buffers 0, 1, 2, 5 and 6 are the bands. A copy loaded by an EA draws nothing and sends no alerts.
FXC Boll Bands Trader inputs
FXC Boll Bands Trader versions and changelog
- 1.007 Nov 2026Latest
- New: first release.
Before you download: installing FXC Boll Bands Trader
- A computer or a VPS. The MetaTrader phone apps can't run custom indicators.
- Allow DLL imports. The update check uses it. The chart template in the zip already has it on.
- In the zip: the MT4 and MT5 files and a chart template.
More help: How to install EAs and indicators in MT4 and MT5.
Download the zip and follow the guide. At the end, load the chart template FXC Boll Bands Trader.
Install guideFXC Boll Bands Trader reviews
Requests for FXC Boll Bands Trader
Vote on what we build for FXC Boll Bands Trader next, or add your own idea.
No requests for this one yet.
Adding a request takes a free account. We read every request first, so yours shows here once it's on the list.
An idea for a new indicator or EA? Ask on the roadmap
More volatility tools

Super Bands
Ultra Trend Pro