FXC VWAP Bands
VWAP bands that flag when price has gone too far, and point back to VWAP.
MT4 and MT5 in one zip. No sign-up, the file downloads straight away.
- Use it on as many accounts as you like, demo or live
- Every update free, and your chart tells you when one is out
- Chart template in the zip, ready to load
What the VWAP arrow indicator shows
FXC VWAP Bands is a free VWAP arrow indicator for MT4 and MT5. It draws VWAP with a band each side and puts an arrow on the closed bar that first reaches a band. A panel shows how far price has stretched from VWAP.
VWAP here is typical price weighted by tick volume. It starts again each day, or runs from a date you pick.
It does not place trades. It shows you the picture, and you decide.
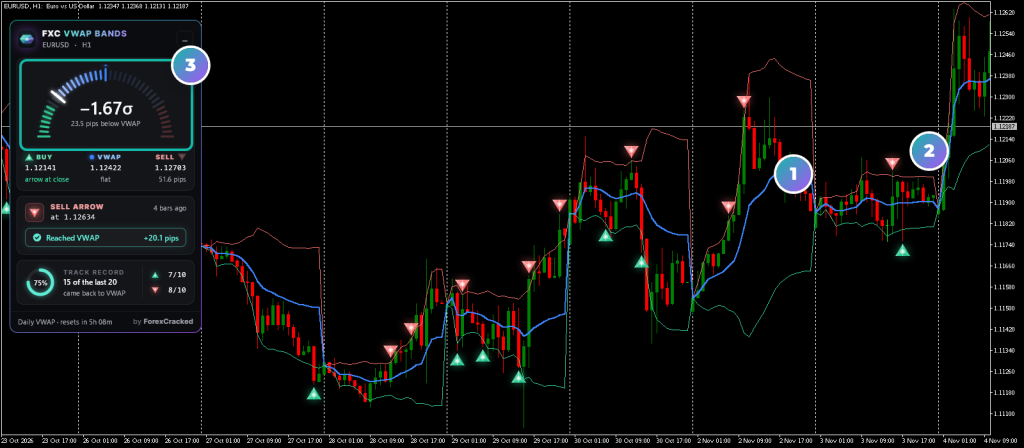
- 1VWAP and the bandsVWAP in blue, the upper band rose, the lower band green.
- 2The arrowOn the closed bar that first reaches a band. Its target is VWAP.
- 3The gaugeHow far price is from VWAP, in standard deviations and pips.
Vwap arrow indicator on real charts, every week
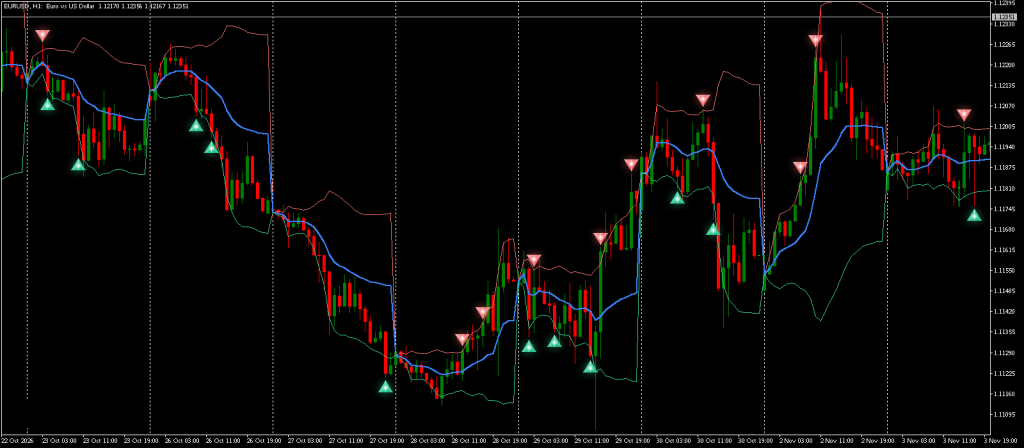
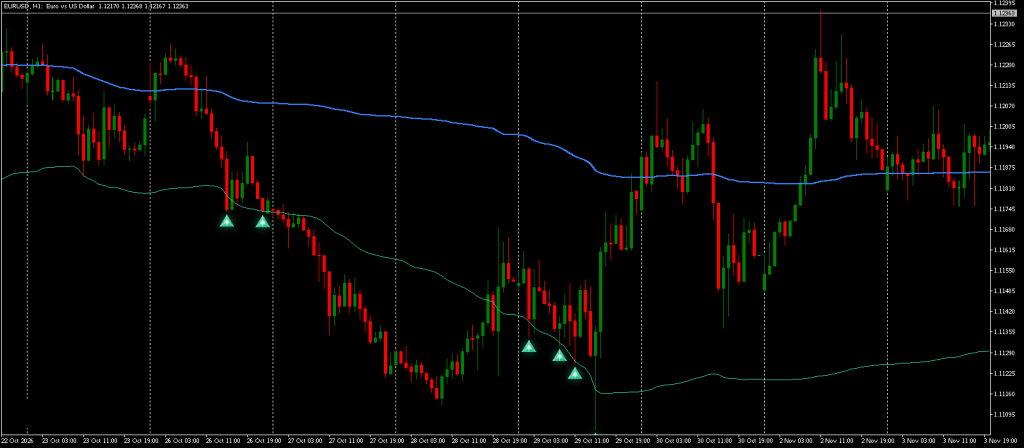
Daily or anchored VWAP
One input, Anchor, decides where VWAP starts. These are the same chart with that one setting changed.
How to read the VWAP panel
The gauge sits on top. Under it the panel says where each arrow would print and how the last one went.
How to use FXC VWAP Bands
Four steps, using an M15 chart as the example.
- 1Add it to an intraday chart. A daily VWAP draws below H4. For H4 and above, set an anchor date.
- 2Read the stretch. The gauge shows how far price sits from VWAP, in standard deviations and in pips.
- 3Watch the BUY and SELL lines. "Arrow at close" means this bar touched a band. "Riding the band" means the next arrow needs a clear bar first. "Paused" means the bands are squeezed.
- 4Click an arrow. The chart shows its entry and its target, VWAP, for 8 seconds. The arrow's tooltip has the rest.
An arrow is a first touch, not a confirmed turn. Nothing tests that price rejected the band, so the decision stays yours.
Where VWAP draws
A day is too few bars on H4 and above, so a daily VWAP pauses there and the panel says why. An anchored VWAP runs from your date on any timeframe.
| Timeframe | Daily VWAP | Anchored VWAP |
|---|---|---|
| Below H4 | Draws | Draws |
| H4 and above | Paused | Draws |
VWAP bands and arrow features
Daily or anchored VWAP
A new VWAP at your broker's midnight, or one VWAP from a date and time you pick.
A band each side
Standard deviations from VWAP, weighted the same way. You set the width; the default is 2.
Arrows at the first touch
An arrow on the closed bar that first reaches a band, so live ticks can't repaint it. A bar has to clear the band before the next one.
Stretch gauge
An arc from the lower band to the upper band, with a bar at the price and the distance in standard deviations and pips.
Squeeze pause
When the bands are narrow against their last 50 widths, both arrows wait. You can turn this off.
Click an arrow
Its entry and its target, VWAP, show on the chart for 8 seconds. The tooltip gives the rest of the trade.
Alerts
Popup, push, email or sound once an arrow's bar has closed, with the band's price and the VWAP target.
Readable by EAs
VWAP, both bands and the arrows are in buffers. A hidden copy in an EA draws nothing and sends no alerts.
FXC VWAP Bands: questions, inputs and versions
Questions about FXC VWAP Bands
Is it really free?
Yes. It is yours to keep, on MT4 and MT5.
Does it place trades for me?
No. It is an indicator. It shows you the picture, and you place the trade.
Do I need an account?
No. The download starts straight away. You need one to leave a review.
Why does it draw nothing on H4 and above?
A day is too few bars there, so a daily VWAP pauses and the panel says why. Use H1 or lower, or set an anchor date, which draws on any timeframe.
Does it use real volume?
It uses tick volume, the count MetaTrader gives for each bar. There is no real volume option.
Do the arrows repaint?
Not on live ticks: an arrow is decided once, when its bar closes. VWAP and the bands on the live bar keep moving until that bar closes. A chart reload works everything out again from your broker's stored bars, so an arrow on a very near touch could differ.
Can an EA read the signals?
Yes. Buffers 0 to 2 are the upper band, VWAP and the lower band. Buffer 6 is a buy arrow and buffer 7 a sell arrow, 0 when there is none.
FXC VWAP Bands inputs
FXC VWAP Bands versions and changelog
- 1.004 Nov 2026Latest
- New: first release.
Before you download: installing FXC VWAP Bands
- A computer or a VPS. The MetaTrader phone apps can't run custom indicators.
- Allow DLL imports. The update check uses it. The chart template in the zip already has it on.
- In the zip: the MT4 and MT5 files and a chart template.
More help: How to install EAs and indicators in MT4 and MT5.
Download the zip and follow the guide. At the end, load the chart template FXC VWAP Bands.
Install guideFXC VWAP Bands reviews
Requests for FXC VWAP Bands
Vote on what we build for FXC VWAP Bands next, or add your own idea.
No requests for this one yet.
Adding a request takes a free account. We read every request first, so yours shows here once it's on the list.
An idea for a new indicator or EA? Ask on the roadmap
More volatility tools
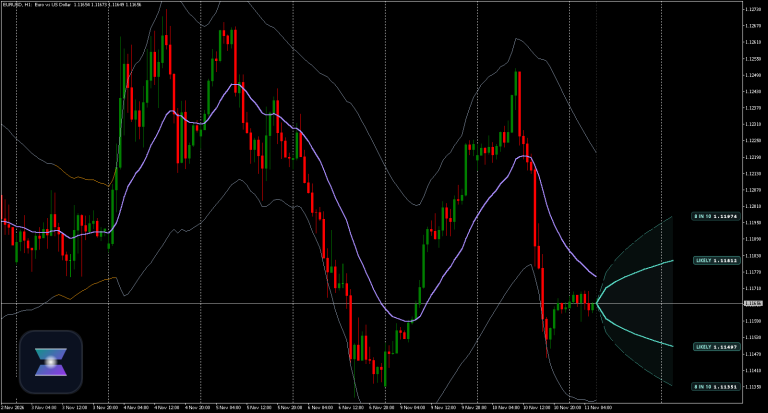

Super Bands
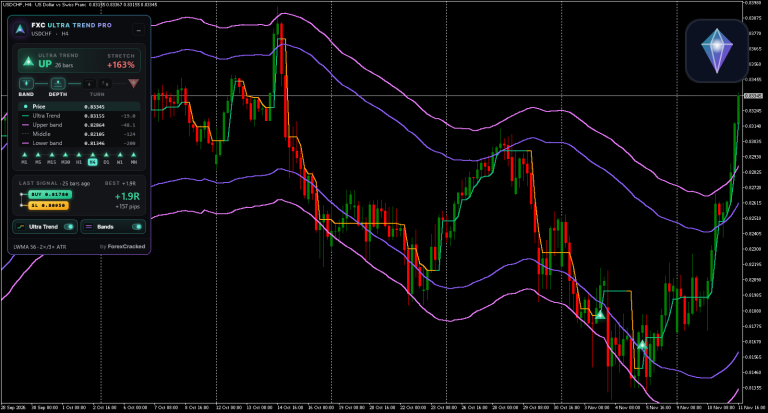
Ultra Trend Pro