FXC Support and Resistance
Support and resistance drawn from the trend's own swings, with the close that would turn it.
MT4 and MT5 in one zip. No sign-up, the file downloads straight away.
- Use it on as many accounts as you like, demo or live
- Every update free, and your chart tells you when one is out
- Chart template in the zip, ready to load
Support and resistance from the trend
FXC Support and Resistance is a free support and resistance indicator for MT4 and MT5. It reads the trend from its swings and draws the levels that shape it: the last swing high and low, where the trend turned and where it started.
A swing counts once price has come back 3 ATR from it, so each timeframe has its own picture. A close beyond the last swing turns the trend or carries it on, and the panel shows both of those prices with their distance.
It reads closed bars only, so the lines don't move while a bar forms. It has no alerts and it does not place trades.
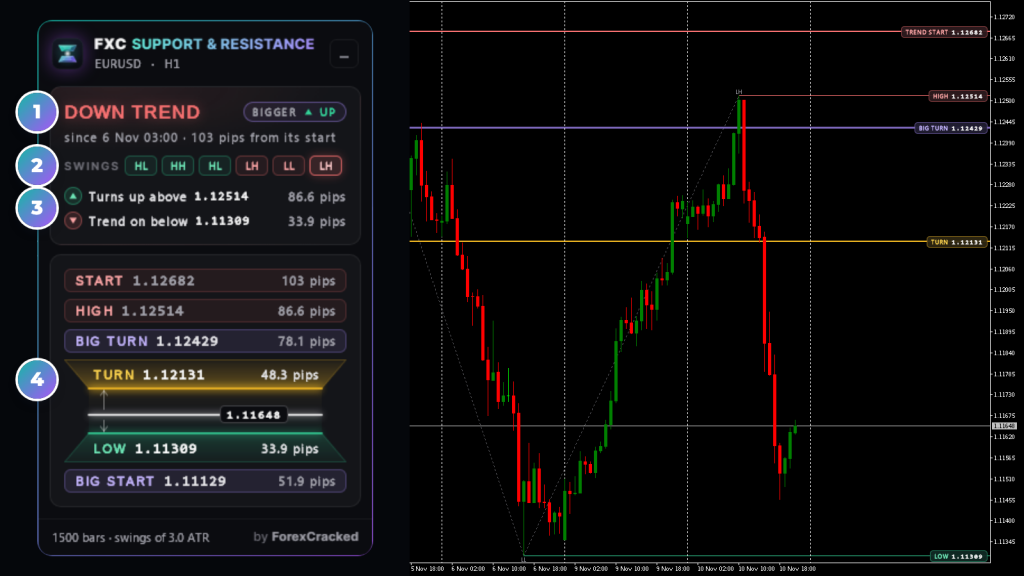
- 1The trendUP TREND, DOWN TREND or NO TREND, since when, and the bigger picture's trend beside it.
- 2The last six swingsEach swing as HH, HL, LH or LL, the newest at the right.
- 3The two closesThe closes above and below that would turn the trend or carry it on, with price and distance.
- 4The levelsEvery line in price order. The nearest above price is the ceiling, the nearest below the floor.
Support and resistance indicator on real charts, every week
How to read the trend card
The top card says where the trend stands. Every part of it has a tooltip with the prices and dates.
The support and resistance levels
Every level is a swing the trend depends on. Up to seven lines, one per price; two roles at the same price share one line, named for both. Each line starts at the swing that made it and has its price tag at the right edge of the chart.
| Line | What it is | On the chart |
|---|---|---|
| HIGH | The last swing high, until a close goes above it | Down Colour |
| LOW | The last swing low, until a close goes below it | Up Colour |
| BREAK | The latest swing the trend closed beyond and carried on | Dashed, the trend's colour |
| TURN | The swing whose break turned the trend | Amber, thicker |
| TREND START | The low an up-trend started from, or the high a down-trend started from | The trend's colour, thicker |
| BIG START | Where the bigger picture's trend started | Violet, thickest |
| BIG TURN | The swing whose break turned the bigger picture | Violet, thickest |
In the panel the same lines sit in price order. The nearest above price is the ceiling, the nearest below it the floor, each with its distance in pips.
How to use FXC Support and Resistance
Four steps, using an H1 chart as the example.
- 1Add it to the chart you trade. It reads that chart's timeframe, so H1 and H4 each get their own swings and levels.
- 2Read the trend card. UP TREND or DOWN TREND says which way it stands and since when. The BIGGER chip says whether the bigger swings agree.
- 3Check the two closes. In a down-trend, "Turns up above" is the price an H1 close has to clear to turn it. "Trend on below" is the low a close under would break.
- 4Use the ceiling and the floor. They're the nearest levels above and below price. Point at a row in the panel to light its line on the chart.
It's a reading, not an entry signal. The indicator shows where the trend's levels are. Your entry, stop and size stay your own call.
Support and resistance features
The trend from its swings
Up, down or no trend, read from closes beyond the last swing high and low.
Levels with a reason
Each line is a swing the trend depends on: the last high and low, the turn, the start and the latest break.
The close that would turn it
The panel shows the price a close must clear to turn the trend, and the one that carries it on.
A bigger picture
The same reading with swings 3 times bigger, over 4 times the bars, with its own two lines.
The swing path
A dotted line through the last 40 swings, each marked HH, HL, LH or LL. It can be turned off.
Point to find it
Point at a level in the panel and its line and price tag light up on the chart.
Read on closed bars
Nothing moves while a bar forms. A swing is marked once price has come back 3 ATR from it.
Two settings
Bars to Read and Swing Size set how much history and how big a swing has to be.
FXC Support and Resistance: questions, inputs and versions
Questions about FXC Support and Resistance
Is it really free?
Yes. It is yours to keep, on MT4 and MT5.
Does it place trades for me?
No. It is an indicator. It shows you the picture, and you place the trade.
Do I need an account?
No. The download starts straight away. You need one to leave a review.
Does this support and resistance indicator repaint?
The lines are read from closed bars, so nothing moves while a bar forms. A swing is marked once price has come back 3 ATR from it, so it appears some bars after its high or low, at that bar and price.
Why is the HIGH or LOW line missing?
A close went beyond it, so it became a break or a turn. The next swing high or low shows once price has come back far enough to make one.
Does it have alerts?
No. It draws the levels and the panel shows how far price is from each one.
Can an EA read the levels?
No. It has no buffers: the levels are lines on the chart and rows in the panel.
FXC Support and Resistance inputs
FXC Support and Resistance versions and changelog
- 1.0010 Nov 2026Latest
- New: first release.
Before you download: installing FXC Support and Resistance
- A computer or a VPS. The MetaTrader phone apps can't run custom indicators.
- Allow DLL imports. The update check uses it. The chart template in the zip already has it on.
- In the zip: the MT4 and MT5 files and a chart template.
More help: How to install EAs and indicators in MT4 and MT5.
Download the zip and follow the guide. At the end, load the chart template FXC Support and Resistance.
Install guideFXC Support and Resistance reviews
Requests for FXC Support and Resistance
Vote on what we build for FXC Support and Resistance next, or add your own idea.
No requests for this one yet.
Adding a request takes a free account. We read every request first, so yours shows here once it's on the list.
An idea for a new indicator or EA? Ask on the roadmap
More from FXC Foundry

Fibonacci Levels
London Breakout