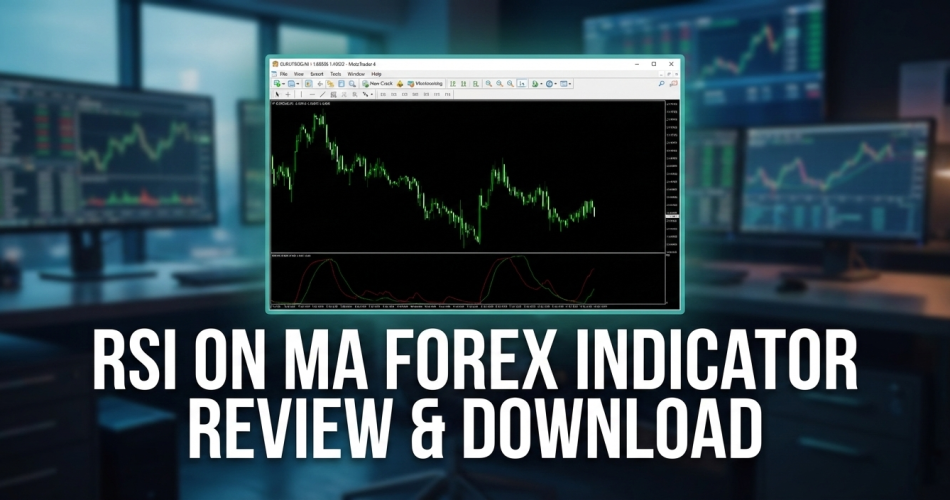

Introduction: The “Smoother” Relative Strength Index
The standard Relative Strength Index (RSI) is one of the most popular indicators in the world, but it has a fatal flaw: It is jittery. In volatile markets, the RSI line spikes up and down, giving you false “Overbought” signals constantly.
The RSI on MA Indicator solves this by applying a Moving Average (MA) calculation directly to the RSI data.
Instead of a single jagged line, you get two smooth lines (Fast and Slow) that interact gracefully. This creates a “Crossover” system that filters out the market noise and only alerts you when real momentum is shifting.
If you like the idea of trading momentum but hate the false signals of standard oscillators, this indicator is your upgrade.
Table of Contents
What is the RSI on MA Indicator?
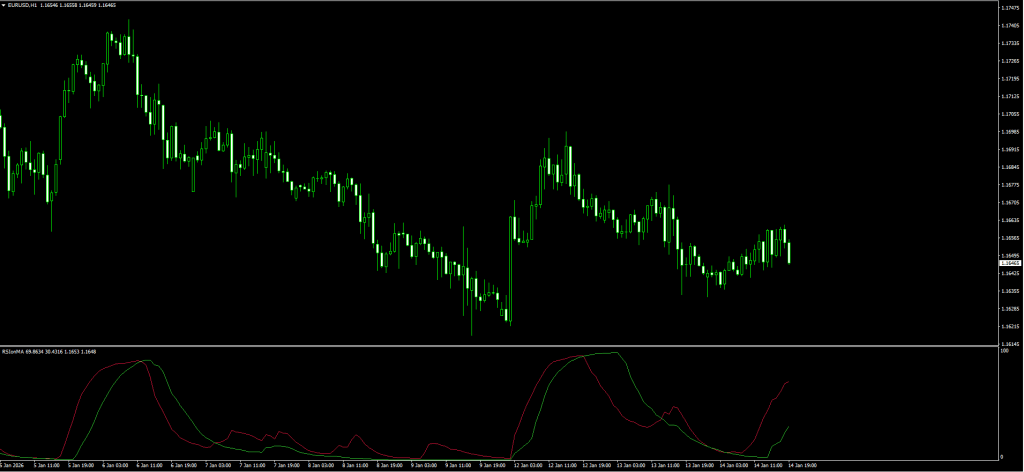
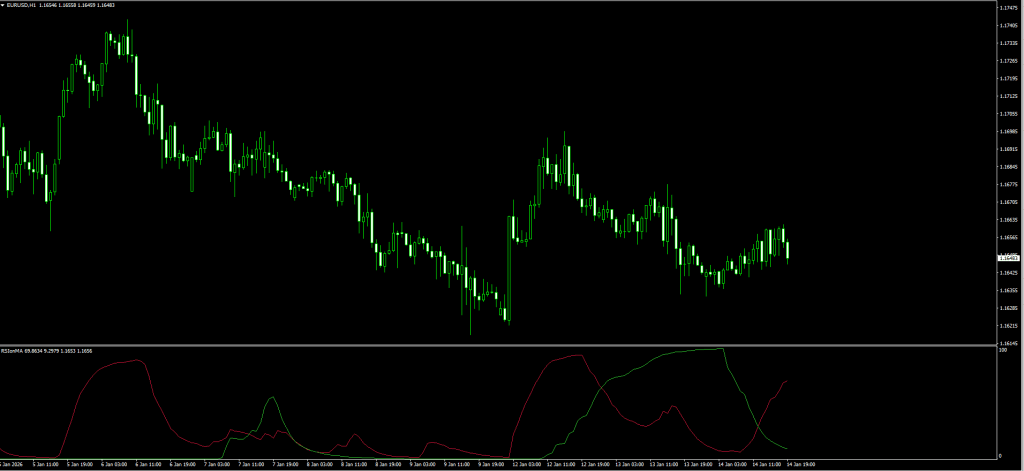
This indicator sits in a separate window below your main chart. It essentially calculates the RSI, and then plots two Moving Averages of that RSI value.
How to Read Your Screenshot:
As seen in the image you will download, the indicator is composed of two oscillating lines:
- The Crimson Line (Red): This is the Fast Moving Average of the RSI. It reacts quickly to price changes.
- The Lime Line (Green): This is the Slow Moving Average of the RSI. It acts as the “Baseline” or trend direction.
- The Signal:
- Buy: When Red crosses ABOVE Green.
- Sell: When Red crosses BELOW Green.
The Logic: Standard MA crossovers (like on a price chart) often lag too much. By running the crossover on the RSI itself, you get the speed of an oscillator with the smoothness of a Moving Average.
Review: Pros and Cons
Is smoothing the RSI actually better? Here is our verdict for 2026.
✅ PROS (The Good)
- Less Noise: It ignores the tiny “wiggles” that cause traders to exit trades too early.
- Clear Entries: The “Red vs. Green” crossover is objective. You don’t have to guess if the line is “kind of” turning.
- Dual Purpose: It shows both Direction (Slope of lines) and Momentum (Gap between lines).
- Versatile: Works excellently on Gold (XAUUSD) and volatile pairs like GBP/JPY.
❌ CONS (The Bad)
- Lag: Any Moving Average adds lag. This indicator will signal an entry after the absolute bottom or top has formed.
- Ranging Markets: In a tight sideways market, the lines will crisscross repeatedly (whipsaw). You need a Trend Filter (see Strategy below).
The Strategy: The “Momentum Shift” System
The sample post suggests trading every crossover. Do not do this. In a sideways market, you will lose money.
To rank this strategy among the best, we add a Trend Filter to ensure we only trade with the dominant flow.


Setup & Settings
- RSI on MA Indicator: Default Settings.
- 50 EMA (Exponential Moving Average): Applied to Close (Main Chart).
- Timeframe: H1 or H4 (Best results).
1. The “Smooth” Buy Setup
We want to catch a new uptrend while momentum is fresh.
- The Filter: Price must be ABOVE the 50 EMA. (This confirms the trend is UP).
- The Setup: Wait for price to pull back towards the EMA.
- The Trigger: Look at the RSI on MA window. Wait for the Crimson (Red) Line to cross ABOVE the Green Line.
- Bonus: It is stronger if this crossover happens below the 50 level (Oversold territory).
- Entry: Buy at the candle close.
- Stop Loss: Below the recent swing low.
- Take Profit: Hold until the Red line crosses back BELOW the Green line.
2. The “Smooth” Sell Setup
We want to short the market when momentum rolls over.
- The Filter: Price must be BELOW the 50 EMA. (This confirms the trend is DOWN).
- The Setup: Wait for price to rally up towards the EMA.
- The Trigger: Wait for the Crimson (Red) Line to cross BELOW the Green Line.
- Bonus: It is stronger if this crossover happens above the 50 level (Overbought territory).
- Entry: Sell at the candle close.
- Stop Loss: Above the recent swing high.
- Take Profit: Hold until the Red line crosses back ABOVE the Green line.
Pro Tip: If the two lines are wide apart, the trend is strong. If they are pinched close together, the market is chopping, stay out!
Indicator Settings: Customizing the Smoothness
When you open the indicator inputs, you can tweak the sensitivity.
- RSI_Period (Default: 14):
- The standard lookback period. Lowering this (e.g., to 9) makes it faster but noisier.
- MA_Period (Default: Various):
- You can often adjust the smoothing period of the two lines.
- Tweak: If you find the signals are too late, reduce the “Slow MA” period slightly.
Read More Moving Average Crossover Strategy for Forex
How to Install (MT4)
- Download the
.ex4file from the link below. - Open MetaTrader 4.
- Go to File > Open Data Folder > MQL4 > Indicators.
- Paste the file.
- Restart MT4 or Right-Click “Navigator” and hit Refresh.
- Drag the indicator onto your chart.
FAQ: Frequently Asked Questions
Does this indicator repaint?
No. Once the candle closes, the crossover is fixed. However, while the candle is forming, the “Red” line might dance up and down. Always wait for the candle Close.
Can I use this for Scalping?
Yes, on the M5 or M15 timeframe. However, for scalping, you must stick strictly to the 50 EMA Filter rule, or the noise will stop you out.
Is this better than the Stochastic Oscillator?
It is different. Stochastic is better for ranges. RSI on MA is better for trending moves because the Moving Averages smooth out the false reversals.
Final Verdict: Is it Worth Using?
Score: 4.5/5 Stars ⭐⭐⭐⭐🌗
The RSI on MA Indicator is a fantastic tool for traders who struggle with “Trigger Discipline.”
Standard indicators often look messy, making you second-guess your trade. This indicator gives you a clean, binary signal: Red is above Green (Buy) or Red is below Green (Sell). Simple, effective, and powerful.