

Oil Breakout EA is a free MetaTrader 5 (MT5) expert advisor for crude oil (XTIUSD, also listed as USOIL or USOUSD) that runs 20 breakout strategies from one chart, with a stop loss on every trade. For this 2026 review we ran a 22-month backtest on the defaults, matched two live accounts with our own runs, and rebuilt all 600 trades to see which exits and which strategies made the money. Free download at the bottom.
Our tests trade the way the live accounts do. The part worth reading is when the profit was made, and on what data.
TL;DR – Free MT5 crude oil EA: 20 breakout strategies, one position each, a stop on every trade and a forced Friday close. Our 22-month default test made +$366 on $1,000 (profit factor 1.41, 19.6% equity drawdown). Most of it came from strategies tested on their own build data.
What is the Oil Breakout EA?
Oil Breakout EA is an MT5 expert advisor that trades crude oil with 20 breakout strategies at once. Each one places pending stop orders beyond recent swing highs and lows on its own timeframe (D1, H12, H8, H4 or H1), and each trade carries a stop loss, a target, break-even and trailing rules, and a forced Friday close.
Core Strategy and Logic
The rules below come from our 22-month test log (2 January 2025 to 2 November 2026, default settings).
- Bracket orders on swing levels – Each strategy places a buy stop above a recent swing high and a sell stop below a swing low, refreshing the levels on its own entry bar. Over 22 months the EA placed 17,599 pending orders and 600 of them filled. The rest were moved or cancelled before price got there.
- One position per strategy – No strategy ever held two trades at once, and no trade was ever added to. There is no grid and no martingale.
- Wide stops, smaller targets – The stop is capped at 9% of the entry price, and 430 of the 600 trades used that full 9% (about $5 to $10 a barrel at our test prices). The H8 and H12 strategies aim for a target about a third of the stop distance. The H1 and D1 strategies aim for about 1:1.
- Stops that move – A break-even stop and a trailing stop pull the stop up behind a winning trade. 112 trades closed on a stop that had already moved into profit.
- Friday close – Every trade and pending order is closed at 22:50 server time on Friday, and nothing reopens until 01:10 on Monday. 161 of the 600 trades ended this way, so the D1 and H12 “swing” strategies rarely run their full course. The median trade lasted 17 hours and the longest about 117.
- News windows – The EA carries its own calendar of US NFP, CPI and FOMC release dates, and it worked in the Strategy Tester. On NFP days (7 February and 7 March 2025, 2 October 2026) positions were closed at 15:20 server time, ten minutes before the 15:30 release. Each strategy has its own window, so some close hours earlier.
- A false-breakout exit – The EA also closes a trade when the confirmation candle closes back inside the range. This, the news windows and per-strategy session hours account for the 193 trades the EA closed itself during the week.
Bracketing price with stop orders is the classic breakout entry. The Session Range Breakout EA uses the same idea on one daily range per market. Here 20 sets of levels on five timeframes overlap on a single market.
Please test in a demo account first for at least a week. Also, please familiarize yourself and understand how this MT5 Crude Oil Trading EA works, then only use it in a real account.
Oil Breakout EA Settings
These are the inputs worth knowing. Our tests left everything at its default except the preset where stated.
| Input | Default | Notes |
|---|---|---|
| SomaOilPortfolio | V2.1 Conservative | Four lot-allocation presets for the same 20 strategies: V2.1 Conservative, V2.2 Medium, V2.3 High Risk and V1.0. In a .set file they are 0, 2, 3 and 1, in that order |
| StrategiesToRun | 1-20 | Comma list to run a subset |
| Risk | LotSizeStep | Lot from balance, per strategy. ManualLotSize uses StartLots instead |
| RiskMultiplier | 1.0 | Multiplies every calculated lot |
| OnlyUp | true | Lots rise with the account’s peak and do not shrink during a drawdown |
| MaxLots | 0 | No cap from the EA |
| MarginCallProtection | true | Holds back lot size so all same-side pending orders could fill on your margin |
| UseTradingTimeZones | true | Monday 01:10 open, Friday 22:50 close, closes trades and pendings outside it |
| EnableNFP / IR / CPI_Filter | true | Each closes trades and cancels pendings around the release |
| MaxSpreadPips | 80 | No new pending orders while the spread is above about $0.08 |
| AutoGMT | true | Reads the broker’s time offset from worldtimeserver.com (see Download) |
| EnablePropFirmCompliance | false | Daily loss lockout, no-hedge rule and pending cap |
| Magic numbers | 8 digits per strategy | Each strategy has its own, and the digits encode its timeframe and swing width. Override them if another EA uses the same range |
Please test in a demo account first for at least a week. Also, please familiarize yourself and understand how this Oil Breakout EA works, then only use it in a real account.
Recommendations for the Oil Breakout EA
- Deposit – $1,000 works at default settings. A bigger account is not safer in percentage terms (§6).
- Symbol – US crude only: XTIUSD, USOIL, USOUSD, WTI, SpotCrude or CRUDE, with any broker suffix. The chart timeframe does not matter.
- Contract size – Check yours before comparing lots. On our Tickmill test account 1 lot is one barrel, the same exposure as 0.01 lot on brokers with 100-barrel contracts.
- Broker – Low oil spreads and a hedging account. In our test 143 trades opened while a position in the other direction was still open.
- VPS – Pending orders are refreshed on every entry bar and closed on Fridays, so MT5 has to stay running (FXVM).
- Size it against the 9% stops with the lot size optimizer and the drawdown calculator (Find the Perfect Broker For You Here).
Performance Review: Two Live Accounts and Our Own Backtests
1. The live accounts
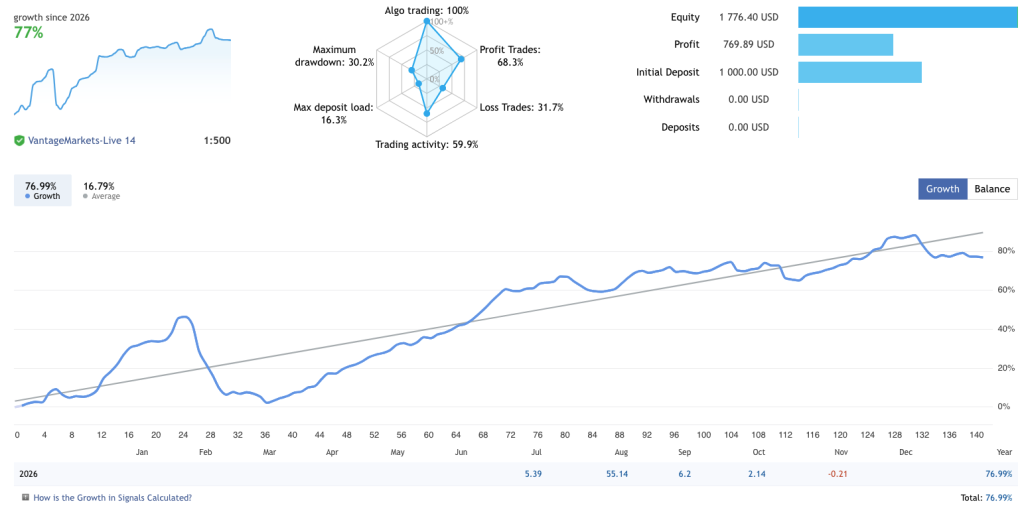
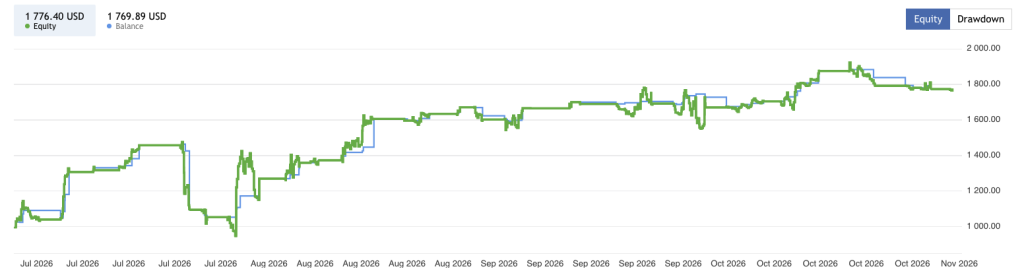
Most of this account’s growth came in August. The rest of the record is a slow climb with long flat spells. The late-July losing streak took the balance from about $1,460 back to $1,050, which is where its 30% balance drawdown comes from.
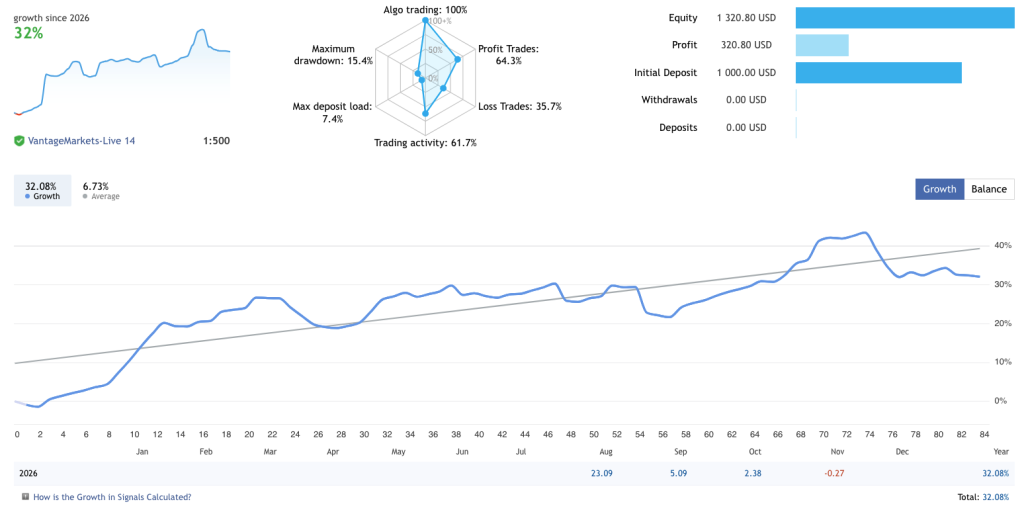
It started five weeks later and runs smaller lots, and again August carried most of its profit.
2. Our test over the same months
We ran each live account’s preset over its own dates on a Tickmill demo with 100% real ticks, $1,000 and 1:500.
| Live, V1.0 | Our test, V1.0 | Live, V2.1 | Our test, V2.1 | |
|---|---|---|---|---|
| Dates | 3 Jul – 2 Nov 2026 | Same | 10 Aug – 2 Nov 2026 | Same |
| Trades | 142 | 125 | 84 | 80 |
| Share of trades that were buys | 67% | 78% | 73% | 81% |
| Profit factor | 1.81 | 1.75 | 1.76 | 2.63 |
| Net profit | +$769.89 | +$288.10 | +$320.80 | +$124.39 |
| Max equity drawdown | 23.41% | 12.03% | 15.37% | 4.86% |
Trade count and direction line up on both, and so does profit factor on the longer V1.0 record. The short V2.1 window came out better in our test than live. Most V1.0 months match too: July +5.4% in our test against +5.39% live, September +7.0% against +6.2%. August was +16.3% against +55.1%, which is the size gap below. Apart from size, the tests reproduce how the live accounts trade.
The dollar figures do not, and the reason is size. On the same $1,000, the live accounts’ gross profit was 2.6 times ours on V1.0 and 3.7 times on V2.1, so their trades were that much bigger. We ruled out leverage (1:100 and 1:500 gave identical results on Tickmill) and the margin protection (switching it off changed nothing). That leaves a difference in how the EA sizes positions on Vantage’s oil contract compared with Tickmill’s, or a higher risk setting on the live accounts. Either way, judge the EA on profit factor and drawdown, and expect your own broker’s dollar results to differ from both.
3. 22 months on default settings
Our main run: Tickmill demo, XTIUSD, 2 January 2025 to 2 November 2026, $1,000 at 1:500, every input at its default. Tickmill has no real tick history for oil before January 2026, so this run uses generated ticks. Over January to November 2026, where both exist, the two models gave 360 and 361 trades, profit factors of 1.21 and 1.20, and equity drawdowns of 19.98% and 20.10%. That is close enough to trust the generated 2025.
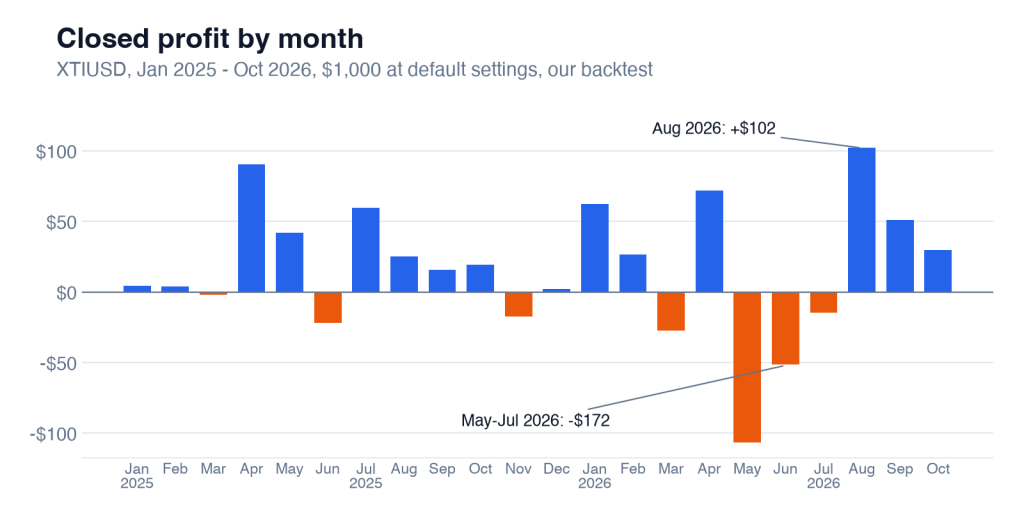
The run made +$365.79 with a profit factor of 1.41, a 14.89% balance drawdown and a 19.55% maximum equity drawdown. 2025 was the better year (profit factor 1.93, +$221.78). 2026 to 2 November made +$144.01 at 1.22.
The worst stretch ran from 24 April to 31 July 2026, when the balance fell from $1,390 to $1,183. In May, long trades opened between $99 and $107 hit their 9% stops as oil fell back, and the month’s buys lost $109. The single worst trade bought at $106.52 on 30 April and was stopped at $96.84 for -$48.32. The two best months were April 2025, when sell stops caught the tariff sell-off as oil fell from about $72 to $57, and August 2026 (+$102), mostly on long trades.
4. Where the profit comes from: the exits
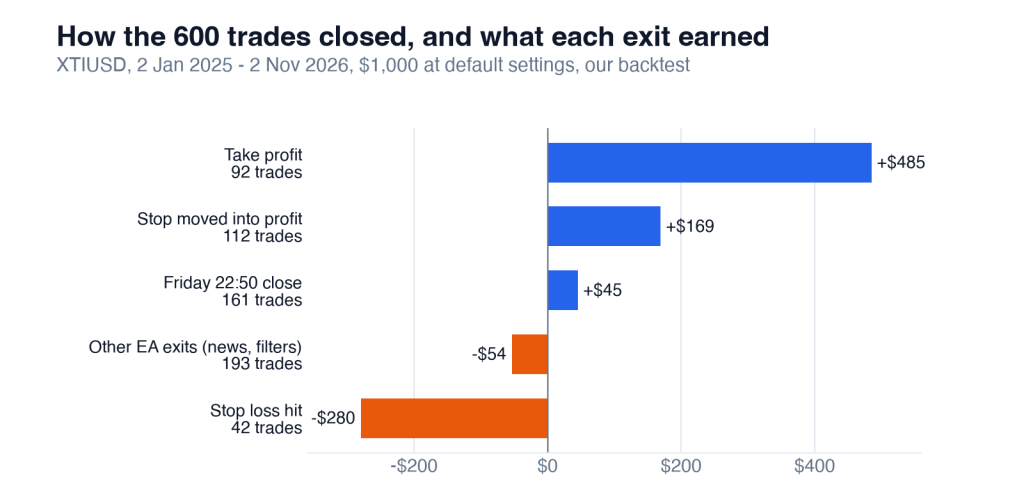
The whole edge is the 92 trades that reached their target. They made +$485, more than the run’s entire net profit. The trailing and break-even stops added +$169. Everything the EA closes on its own schedule, Fridays and news included, nets out close to zero.
The 42 full stop losses averaged -$6.66 against +$5.27 for a target, so the EA needs targets to outnumber stop-outs by a wide margin. In our run they did, about two to one. If a market keeps reversing after the breakout, that ratio is what breaks first.
5. Does the Oil Breakout EA work on data it was not built on?
The 20 strategies were chosen from two optimisation runs. Seven were built on October 2018 to October 2024 data, so our whole 22-month window is new to them. The other 13 were built on June 2020 to 26 June 2026, so most of our window is data they were selected on. That gives a clean test of curve-fitting.
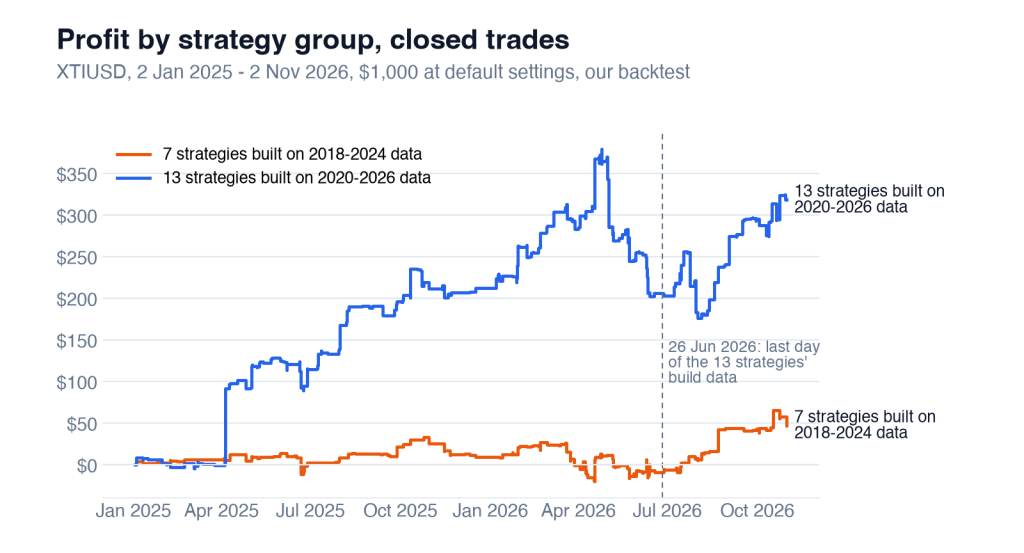
| Before 26 Jun 2026 | After 26 Jun 2026 | |
|---|---|---|
| 7 strategies built on 2018-2024 data | -$8.87, 171 trades (data new to them) | +$56.12, 40 trades |
| 13 strategies built on 2020-2026 data | +$206.62, 300 trades, PF 1.45 (their build data) | +$111.92, 89 trades, PF 1.70 |
Before July 2026, the strategies seeing new data broke even, and the profit came from strategies trading their own build data. That is the pattern over-fitting leaves. Since 26 June, when every strategy is on new data, both groups have made money, and that matches the two live accounts. Four months is too short to call it either way.
By strategy, the H12 narrow-swing strategy #12 (+$93.96) and the D1 strategy #9 (+$60.39) led. The H1 strategy #4 lost the most (-$32.93). Sell trades did better than buys (profit factor 1.62 against 1.29), even though 58% of trades were buys.
Twenty strategies on one market are less diversified than they sound. All trade the same oil price, and at the busiest moment 14 positions were open at once, all in the same direction. We saw the same effect in the FX Portfolio EA, where three of the five pairs moved as one currency bloc.
6. Presets and account size
All four presets trade the same 20 strategies and only change each strategy’s lot. Over the V1.0 live account’s dates (3 July to 2 November 2026, real ticks, $1,000):
| Preset | Net profit | Profit factor | Max equity drawdown |
|---|---|---|---|
| V2.1 Conservative (default) | +$139.55 | 1.84 | 7.30% |
| V2.2 Medium | +$208.41 | 1.83 | 9.49% |
| V2.3 High Risk | +$266.09 | 1.94 | 8.76% |
| V1.0 | +$288.10 | 1.75 | 12.03% |
All four placed the same 125 trades at the same prices, so the preset only sets how big each one is. High Risk roughly doubled the default’s profit for a little more drawdown. These four months had no stretch like May to July 2026, so every drawdown here is lower than the 19.55% the default reached over 22 months. Expect the larger presets to go deeper than that in a bad run.
Account size does not change the risk. On $1,000, 333 of the 600 trades in our 22-month run sat at the smallest lot the broker allows. We reran the same window on $10,000: profit factor 1.41 again and a 20.09% equity drawdown against 19.55%, with every trade scaled up. A $1,000 account carries the same percentage risk as a large one.
Oil Breakout EA
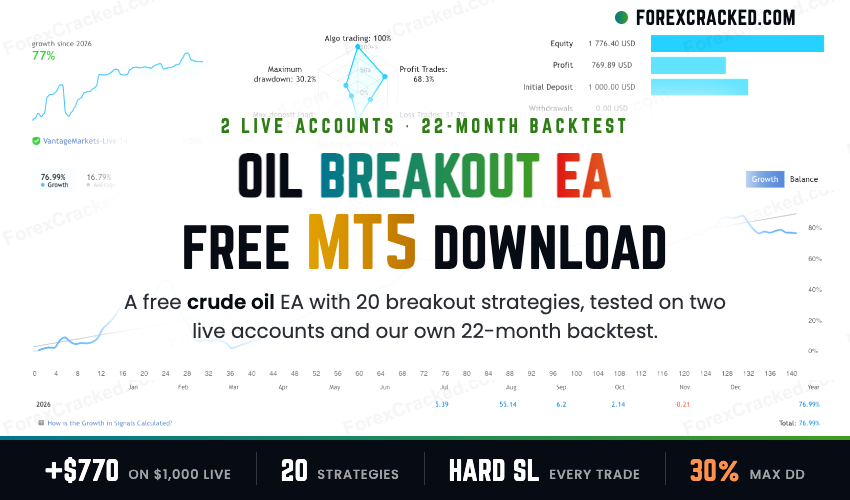
An MT5 crude oil robot that brackets price with stop orders from 20 breakout strategies on five timeframes, caps each stop at 9% of price and closes everything on Friday evening. Our 22-month default test on $1,000 made +$365.79 with a 1.41 profit factor.
Pros
- A stop loss on every trade, one position per strategy, no grid or martingale
- Our matched tests took nearly the same trades as two live accounts, and the profit factor on the longer record matched within 0.06
- Friday 22:50 close and built-in NFP, CPI and FOMC windows keep it out of weekend gaps and the biggest releases
- Risk scales evenly with balance: $1,000 and $10,000 runs had the same profit factor and drawdown
Cons
- Stops sit at up to 9% of the oil price, so one losing trade can wipe out several winners
- The seven strategies built on older data made -$8.87 over 171 trades before July 2026
- Up to 14 positions were open at once, all in the same direction
- Profit comes in bursts: one month in 22 made more than a quarter of it, and May to July 2026 lost $172
Summary
The mechanics are clean, and our tests take nearly the same trades as two live accounts. However, the profit is lumpy and the seven strategies tested only on data they were not built on broke even for 18 months. Treat it as a small, slow oil portfolio, not a steady earner.

 Built by ForexCrackedWe tested 1,200+ indicators. Then we built our own.Six years of reviewing EAs and indicators went into FXC Fusion: two engines, the seven-panel cockpit, MT4 and MT5, from the team behind this site.

Your download will start automatically. If it doesn’t, click here.Right now a download can take up to a minute to start. Please wait a moment, or use click here.
How it compares to other breakout and oil robots we have tested
| Oil Breakout EA | Crude Oil Robot MT4 | Session Range Breakout EA | |
|---|---|---|---|
| Platform | MT5 | MT4 | MT5 |
| Markets | Crude oil only | Crude oil only | Gold, USDJPY, BTCUSD, US30, DE40 |
| Entry | 20 swing-breakout strategies | Volatility filter with a news buffer | One daily range per market |
| Position sizing | One position per strategy | Lot steps up within a sequence | One trade per market per day |
| Profit factor in our test | 1.41 (22 months) | 2.58 (2024-2025) | 1.17-1.30 (23 months) |
| Max drawdown in our test | 19.55% equity | 11.73% | 24% |
The three tests cover different windows and account sizes, so read them as a rough guide.
Frequently Asked Questions (FAQ)
Conclusion
Oil Breakout EA is an honestly built oil robot: real stops, no averaging, and out of the market at weekends and around the biggest US releases. However, its edge is thin and comes in bursts, and the four months where all 20 strategies faced new data are too few to prove it holds. If you run it, start on demo with the V2.1 default, judge it over months rather than weeks, and stop if the equity drawdown passes 20%, the worst our 22-month run reached.


Discussion no comments yet
Is this still working?
Nothing here yet
No one has asked anything about Oil Breakout EA yet. First question gets answered.