

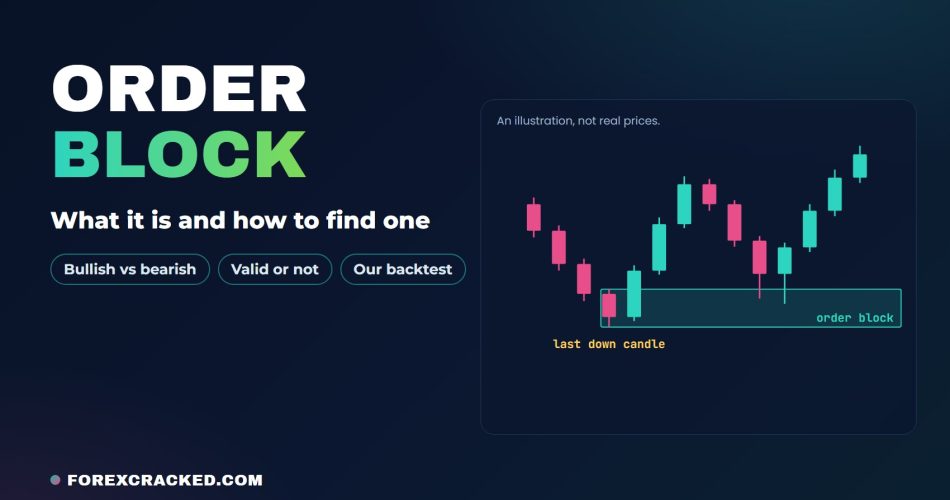
You mark the last down candle before a rally, wait for price to come back to it, and buy the retest. Sometimes price turns right there. Sometimes it slices straight through and your stop goes with it.
That candle is an order block, one of the main ideas in smart money trading. This guide explains how order blocks in trading work: what they are, how a bullish one differs from a bearish one, how to find and mark them, and what traders check before they call one valid. You’ll also see how they compare with breaker blocks, fair value gaps and supply and demand zones. Then comes the part most guides skip: we tested a rule-based version on EURUSD and gold, with data from 2019 into 2026, and the numbers are below.
Key Takeaways
- An order block (OB) is the last candle against a strong move: the last down candle before a rally, or the last up candle before a drop. Traders treat that candle’s range as a zone price may react to when it returns.
- A bullish order block sits below price as possible support, and a bearish order block sits above price as possible resistance.
- The common checks for a valid zone are a strong move away from it, a break in structure, and no return visit yet. Once price has come back and traded into a zone, it’s mitigated. Once price goes through the far side, it’s broken.
- In our own backtest on EURUSD and gold, taking every confirmed retest lost after costs: from 2024 on, about 43% of 1,141 trades won when about 50% was needed to break even. A stricter version was about break-even on 238 trades in the same period, and it lost on gold in the older data. Treat the zone as a place to look, not as a signal.
Table of Contents
What is an order block in trading?
An order block is the last candle that closes against a strong move, right before that move begins. Before a rally it’s the last down candle. Before a sell-off it’s the last up candle. Traders mark that candle from its high to its low and treat the area as a zone where price may react if it comes back.
ICT (Inner Circle Trader) teaching made the term popular, and it’s a core part of smart money concepts (SMC). The story behind it goes like this: banks and funds can’t build a large position in one go, so they build it in a tight area before price takes off, and part of their order is still waiting there. When price returns, the rest gets filled and price reacts.
Treat that story as a theory. A price chart doesn’t show who traded or what is still waiting, and nobody outside those firms can check it. What you can check is how price has behaved at zones like these.
You’ll see the term shortened to OB, as in OB trading. An order block in forex trading is found and drawn the same way as one on gold, indices, crypto or stocks. The examples section shows forex order blocks on real EURUSD prices.
One mix-up to avoid: a block order, also called a block trade, is a single very large trade, usually arranged away from the open market. Same two words, different thing.
Bullish and bearish order blocks
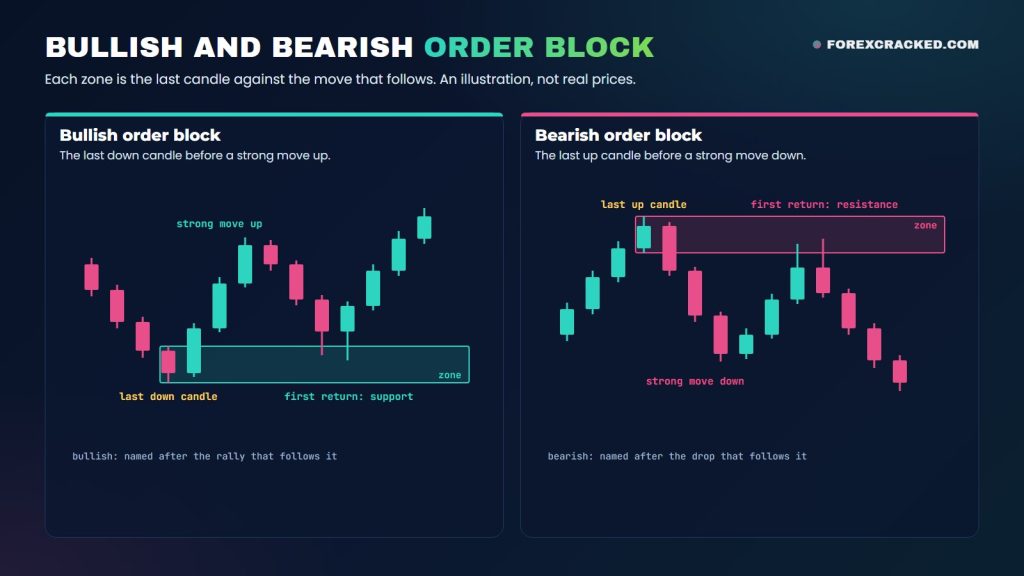
A bullish order block is the last down candle before a strong move up. It sits below the current price, and traders watch it as possible support. If price drops back into it, they look for buys.
A bearish order block is the reverse: the last up candle before a strong move down. It sits above price, and traders watch it as possible resistance for sells.
The candle color trips up beginners. A bullish zone is a down candle and a bearish zone is an up candle, because the zone is named after the move that follows it, not after the candle. Those are the two basic types of order block.
Some guides also sort them by where they form. A reversal order block sits at the turn that ends a trend. A continuation order block forms on a pullback inside a trend, just before the next leg. Breaker, mitigation and rejection blocks come up after the examples.
How to identify order blocks on a chart
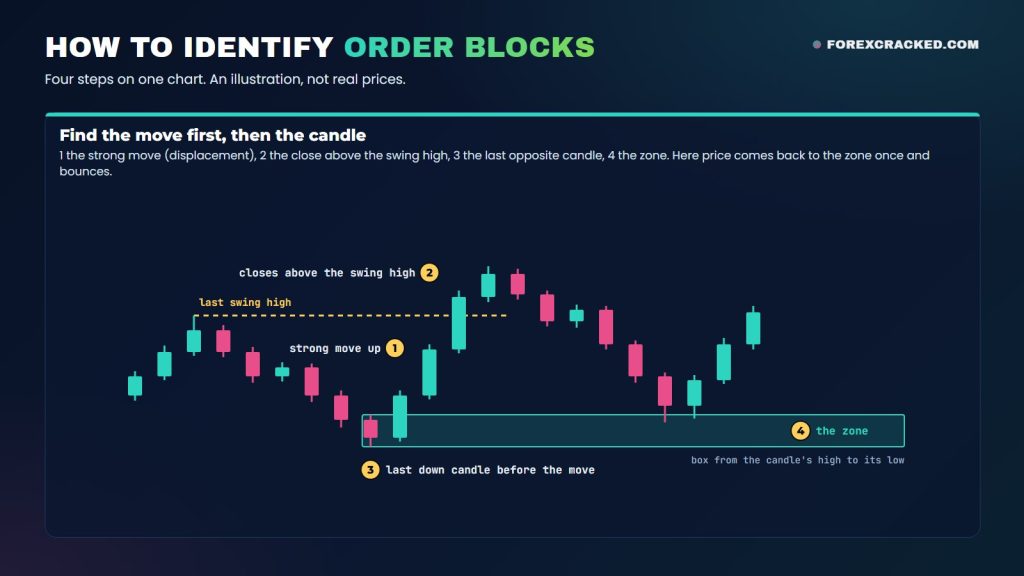
Finding order blocks takes four steps:
- Start with the strong move. Look for a run of large candles in one direction that clearly outpaces the candles before it. SMC traders call this displacement.
- Check what the move broke. Traders rate a candidate higher when the move closes beyond the last swing high or swing low, the most recent clear peak or dip. With the trend, that close is a break of structure (BOS). Against the trend, as in a turn off a low, it’s a change of character (CHoCH). Either one can leave an order block behind.
- Find the last opposite candle. Before a move up, that’s the last down candle before the run began. Before a move down, it’s the last up candle.
- Mark the zone. Draw a box from that candle’s high to its low and extend it to the right.
Which candle counts if two or three small opposite candles sit in a row? The usual choice is the last one before the move. Some traders mark the whole cluster as one zone. Both are common, so pick one rule and keep to it.
Wick or body? A box drawn from the high to the low includes the wicks. It’s wider, so price reaches it more often and the stop sits further away. A box on the body alone is tighter and gets missed more often. Neither is the official version, because there isn’t one.
What makes an order block valid?
Not every last opposite candle deserves a box. These are the checks traders use most to pick out a valid order block, and they are rules of thumb, not laws:
- Displacement. The move away is strong and fast. A slow drift away counts for little.
- A break in structure. The move closes beyond a swing high or low: a break of structure with the trend, or a change of character against it.
- A fair value gap. The move leaves a gap between candle wicks, a sign of one-sided trading.
- Volume. Heavy volume on the move away adds weight to the zone. On a forex chart that’s usually tick volume, a count of price changes rather than the amount traded, so treat it as a rough hint.
- Unmitigated. An unmitigated order block is one that price hasn’t come back to yet. Traders usually wait for its first return.
- With the bigger trend. A bullish zone inside a higher-timeframe uptrend gets more trust than one against it.
- A liquidity sweep first. Some traders want the zone to form right after price ran the stops beyond an old high or low.
Zones that pass are what some traders call tradable order blocks. Each check you add leaves fewer trades, though. In our test further down, the stricter rules took about a fifth as many trades as the basic ones.
Mitigation: when is an order block used up?
Mitigation means price has come back and traded into the zone. After that, the usual view is that the orders waiting there have been filled and the zone has done its job.
Traders disagree on the details. For some, a single touch mitigates the zone. For others it takes a move through the midpoint, sometimes called the mean threshold. Many indicators, including our TradingView script and the MT4/MT5 indicator, both linked further down, use the word more narrowly: a zone counts as mitigated only once price has gone all the way through it.
On the end point there’s less argument. Once price goes through the far side, on a candle close for some traders and on a wick for others, the zone is broken as an order block.
Can one be used twice? A zone can hold more than once, but in theory each visit uses up more of the waiting orders, so later tests get less trust. Many traders only take the first return.
Order block examples
Here are the two basic cases in words, then a real chart. None of them are trades we took.
A bullish order block example
Price is falling and prints a last down candle near the low. The next three candles are large and close higher, and the third closes above the previous swing high. After a fall, that close is a change of character. The last down candle is the bullish zone. Later price drifts back, trades into the top half of the zone, and prints a candle that closes back above it. A trader using the zone would look for a long there, with the stop under the low of the zone.
A bearish order block example
Flip it. Price is rising and prints a last up candle near the high. A burst of down candles follows and closes below the last swing low, a change of character to the downside. The up candle is the bearish zone. When price climbs back into it and gets rejected, that’s the short setup, with the stop above the top of the zone.
A real example: bearish order blocks on EURUSD
Here’s what our FVG + Order Block Toolkit for TradingView draws on real prices (more on it further down). It’s EURUSD on the 15-minute chart, FXCM prices, at the script’s default settings, captured at 18:29 UTC on Monday 16 November 2026, so the last candle was still forming. The chart’s clock is UTC+5:30: Friday’s last hours sit just after the 14 on the time axis, and the new week’s candles, from 22:00 UTC on Sunday, run from there to the 17. Times below are UTC, and each names a candle by its opening time, as TradingView does.
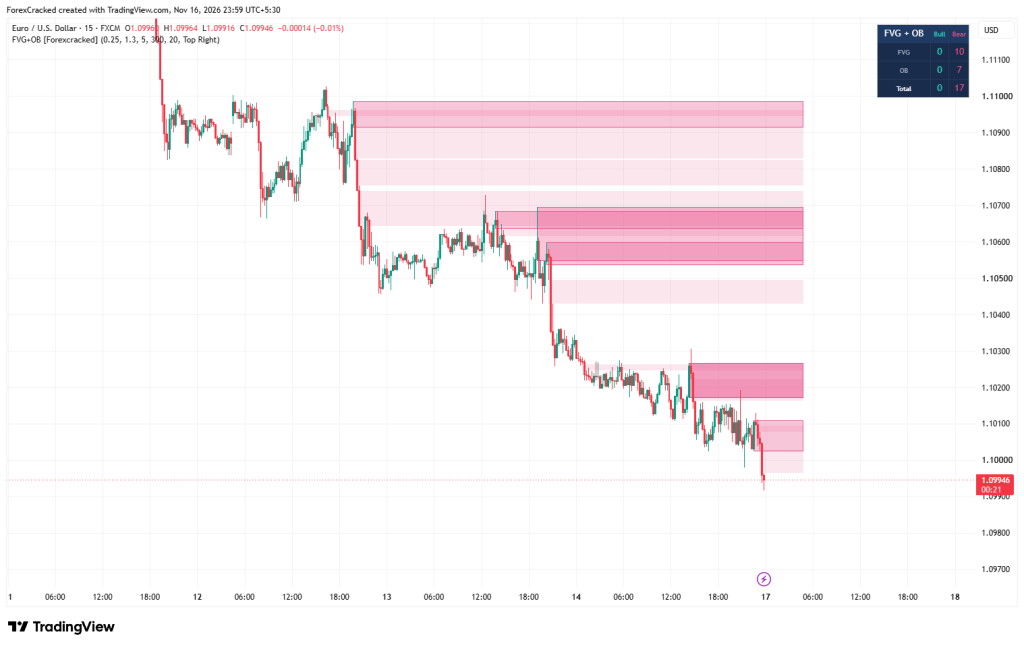
Read it from the top left:
- Thursday’s drop. On 12 November, the 14:15 UTC candle closed up at about 1.1096. The next candle fell 13.5 pips, and price was about 40 pips lower within the hour. That last up candle is the top bordered box, about 1.1092 to 1.1099: a bearish order block. The three soft bands under it are fair value gaps from the same fall. Price never came back up to the box.
- Friday’s drops. On 13 November, three more falls left three more boxes, between about 1.1054 and 1.1069. The last of those falls was a single 20-pip down candle at 15:15 UTC, and the soft band under the boxes is the gap it left.
- Monday’s first return. On 16 November, the 08:45 UTC candle closed up at about 1.1026. The next candle spiked to about 1.1031 and closed lower, and two strong down candles followed, so the script boxed the up candle: about 1.1017 to 1.1027. The 15:15 UTC candle’s wick reached back into the bottom of the box, to about 1.1019, and the candle closed at about 1.1005. In the broad sense used earlier in this guide, that touch mitigated the box. The script still draws it because it only removes a zone once a candle closes through it.
- Monday evening. The lower box under it is the newest: the 18:00 UTC drop boxed the 17:00 UTC up candle, about 1.1003 to 1.1011.
None of this proves anything. Even Monday’s touch is unfinished: a short at the 15:15 UTC close, with the stop above the box, would have been about 11 pips ahead when the screenshot was taken, with more than 21 pips at risk.
The panel in the corner counts the zones still alive: 17 bearish and no bullish, made up of 10 gaps and 7 order blocks. You can see only six bordered boxes because Monday’s box is drawn twice on the same candle, once for each strong down candle, which is why it looks darker.
On a chart that has fallen for days, no bullish zones is what you’d expect, because the script deletes a bullish zone once a candle closes below it, or after 300 bars. So a chart like this shows the zones that survived, not the ones that failed. Whether trading them pays is a different question, and our test further down looks at that.
Order block vs breaker block
A breaker block is an order block that failed. Take a bullish zone: price comes back, and instead of holding, a candle closes below it. The zone is broken. If price later climbs back up to that same area from underneath, traders watch it as resistance. That flipped zone is the breaker block.
In the strict ICT version there’s one more condition: the zone only counts as a breaker if the move it launched first ran the stops beyond an old high or low.
So the two are the same area at different moments. One is expected to hold. The other already gave way, and traders expect it to do the opposite job.
| Order block | Breaker block |
|---|---|
| The last candle against a strong move | A zone that price closed through |
| Expected to hold on the first return | Expected to flip: old support acts as resistance |
| Traded with the move that created it | Traded the opposite way to the original zone |
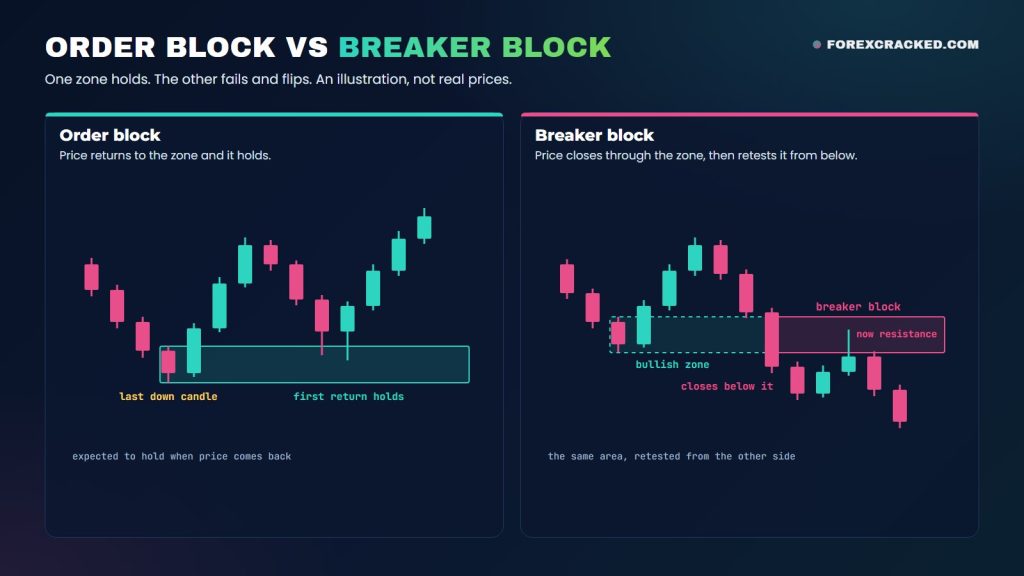
Two more labels come up in ICT material:
- Mitigation block: close to a breaker. It’s a zone that failed and gets retested from the other side, but without the stop run beyond an old high or low first.
- Rejection block: drawn on the long wicks at a swing high or low, not on a whole candle.
If you’d rather have breakers marked for you, there’s a free breaker blocks indicator for MT4 and MT5.
Order block vs fair value gap
A fair value gap (FVG) is a three-candle pattern. The wick of the first candle and the wick of the third don’t overlap, which leaves a gap the middle candle jumped across. An order block is usually a single candle, the last one against the move.
They tend to show up together. The strong move that leaves an order block behind often leaves a gap just beyond it, so price coming back has to cross the gap before it reaches the order block. That’s why some traders enter at the gap and others wait for the deeper order block.
Neither is better. They do different jobs. When the gap sits in front of the order block, price reaches the gap first. The order block sits deeper, so an entry there is closer to the stop. Our order block and FVG indicator for TradingView draws both, so you can watch how each behaves on your symbol.
Order block vs supply and demand zones
They’re close relatives. A demand zone is the base where a rally started, and a supply zone is the base where a drop started, usually drawn around a small cluster of candles. An order block narrows that down to one candle and adds SMC conditions on top, such as the break in structure and the first return.
In practice a bullish order block usually sits inside a demand zone. The labels come from different schools, and the charts overlap far more than the arguments suggest. Support and resistance is the broader idea behind both: a price area where buyers or sellers showed up before.
How to trade an order block
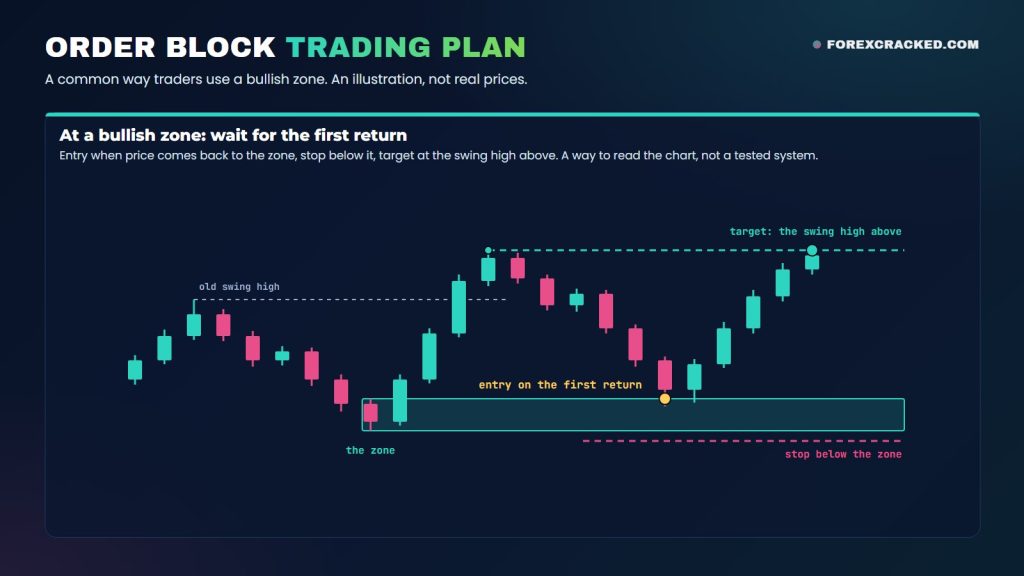
Order block trading is mostly waiting. The zone is marked after the move, and the order block trade is the return to it. A common plan runs like this:
- Pick the direction first. Use zones that agree with the higher-timeframe trend.
- Wait for price to come back. Don’t chase the move that created the zone.
- Choose your entry. Some traders place a limit order at the edge of the zone or at its midpoint. Others wait for a rejection candle that closes back outside it.
- Put the stop beyond the zone. For a long, that’s below the low of the zone. If a candle closes through the zone, the idea is dead.
- Set the target at the next liquidity: the last swing high or low, or an older level where stops are likely to sit.
Traders who use sweeps as a filter can flag them with our liquidity sweep indicator for TradingView.
What’s the best timeframe for order blocks?
There’s no single best timeframe. Higher timeframes print fewer zones, and each one covers more price. Lower timeframes print many more, and traders give each one less weight. A common setup is to mark zones on the 4-hour or daily chart and use the 15-minute or 1-hour chart to time the entry. In our test below, the zones came from the 1-hour and 4-hour charts.
Do order blocks work? We tested it
As a mechanical rule, no, not in our test.
Most guides say these zones are where the big players trade. Few show a result. So we ran our own test in MetaTrader 5.
We wrote the rules down before the first run, so they couldn’t be bent to suit the outcome:
- Zones: the last opposite candle at the start of a move that closed beyond a swing high or low, taken from the 1-hour and 4-hour charts. Only the three newest zones on each side were in play, oversized zones were skipped and overlapping ones were merged. A zone was dropped as soon as a wick traded through its far side.
- Markets: EURUSD and gold on 1-hour charts from 2019 on. EURUSD ran to October 2026 and gold to June 2026, where our gold data ends.
- Verdict: set to come from 2024 onward. Data from 2019 to 2023 was for comparing versions.
The basic rules: each time a candle trades into a zone and closes up at a bullish zone or down at a bearish one, enter at that close, once per visit. Stops sit a set 5 pips beyond the zone on both markets, which is $0.50 of price on gold. Half the position closes when the profit equals the risk and the other half at twice the risk. After the first target, the stop moves to just past entry.
The filtered rules: the same targets, with four changes. Only the first return to a zone counts. The trade has to agree with the last structure break on the 4-hour chart. The entry candle has to close back outside the zone, a rejection candle, which replaces the plain up or down close. And the stop distance beyond the zone scales with the ATR (average true range), not a set number.
Here are the results from 2024 to the end of each data set. “Won” is the share of trades that finished in profit, and “Needed” is the share a version had to win to break even.
| Rules | Won | Needed |
|---|---|---|
| Basic, EURUSD | 43.5% | 50.0% |
| Basic, gold | 43.1% | 50.3% |
| Filtered, EURUSD | 54.0% | 52.6% |
| Filtered, gold | 50.5% | 49.4% |
Risking $100 on each trade, after costs, the basic rules lost about $13 a trade on EURUSD (672 trades, about $9,000 in all) and about $15 a trade on gold (469 trades, about $6,800 in all). The filtered rules took 137 and 101 trades, about a fifth as many, and made about $3 and $2 a trade. That’s flat.
In pips, after costs, the basic rules lost 7.3 a trade on EURUSD and 20.2 on gold, counting a gold pip as $0.10. The filtered rules made 2.9 on EURUSD and 23.1 on gold. Don’t read much into that gold figure: stops on those gold trades averaged about 337 pips, so 23 pips is a small slice of the risk.
That isn’t an edge, meaning a lasting advantage. Read the small plus with these in mind:
- Older data. From 2019 to 2023 the same filtered rules were flat on EURUSD (278 trades) and lost about $19 a trade on gold (229 trades), worse than the basic rules there.
- Small sample. With only 137 and 101 trades, chance alone could move those two results by about $20 a trade either way.
- No pass. None of the four changes rescued the basic rules on its own, and none of the seven versions we wrote down in advance passed the test we had set.
- More tries. We also ran more than 200 variations of the rules, picked the best one on the early data, and it lost on the later data.
- Costs. They were counted at the low end. Our EURUSD data records almost no spread, so its cost is close to commission alone, 0.7 pips a trade. With a typical retail spread, the basic EURUSD line gets a little worse and most of the filtered EURUSD plus is gone.
- Hourly candles. They can’t show whether the stop or a target was hit first. Where one candle touched a stop and a target, we counted the stop, with one exception: on the candle that reached the first target, a touch of the moved stop wasn’t counted. That can only help the results. Counted strictly, the filtered rules made about $1 a trade on EURUSD from 2024 on and lost about $2 a trade on gold, and from 2019 to 2023 they lost about $5 and $22 a trade.
A zone on a chart is a place to watch, and a mechanical order block trading strategy, buy or sell the confirmed retest, didn’t pay in our test. That covers one kind of mechanical rule on two markets. It says nothing about a trader who reads context those rules ignore, or about other markets and timeframes. But when someone sells order blocks as a system that just works, ask for the trade count and the result after costs.
Mark the zones without drawing them by hand
On TradingView, our free FVG + Order Block Toolkit does the marking for you. It looks for a displacement candle, one whose body is larger than 1.3 times the ATR, then boxes the last opposite candle within the five bars before it. A zone disappears once a candle closes through its far side, or after 300 bars. All three numbers are defaults you can change. Its rule is simpler than the zones in our test and asks for no break in structure, so the test numbers don’t describe this script.
If you’ve never added a community script, here’s how to install TradingView custom scripts, step by step.
On MetaTrader, there’s a free order blocks indicator for MT4 and MT5 that draws its own zones from volume. Its rules differ from the candle rule above and from the rules in our test. You’ll find more in the order block indicators collection on our site.
Frequently Asked Questions
Keep your own tally
Want to see how these zones behave on the symbol you trade? Add the FVG + Order Block Toolkit to your TradingView chart and keep a tally as price comes back to each new zone: held or broken on the first return. Don’t judge by scrolling back. The script removes a zone once a candle closes through it and drops any zone after 300 bars, so the past part of the chart only shows recent survivors.
Risk disclaimer: This article explains a way of reading price charts. It isn’t a trading system and doesn’t predict price. Our backtest figures describe set rules on two markets over one period, and past results don’t tell you what comes next. This is shared for educational purposes and is not financial advice.


Discussion no comments yet
Nothing here yet
No one has asked anything about Order Blocks Explained: What They Are, How to Find Them and yet. First question gets answered.